- Analytics
- News and Tools
- Market News
CFD Markets News and Forecasts — 03-09-2024
- AUD/USD trades with mild gains around 0.6715 in Wednesday’s early Asian session.
- Australian Services PMI rose to 52.5 in August vs. 52.2 prior, better than estimated.
- Traders raised their bets on a more aggressive rate cut after the weaker US Manufacturing PMI data.
The AUD/USD pair gains traction near 0.6715 during the early Asian session on Wednesday. The upbeat Australian August Purchasing Managers Index (PMI) provides some support to the Australian Dollar (AUD). However, traders will take more cues from Australia’s Gross Domestic Product (GDP) for the second quarter, which is due Wednesday.
Data released by the Judo Bank and S&P Global on Wednesday showed that the country’s Services PMI came in stronger than expected, rising to 52.5 in August from 52.2 in July. Meanwhile, the Composite PMI improved to 51.7 in August, better than the estimation and the previous reading of 51.4.
Investors will closely watch the Australian GDP growth number, which is expected to grow 0.3% QoQ in the second quarter (Q2) of the year and 1% in the twelve months to June. The stronger-than-estimated GDP could boost the Aussie, while the weaker reading could trigger speculation the Reserve Bank of Australia (RBA) to cut interest rates and might weigh on the AUD.
The US ISM Manufacturing PMI registered the lowest reading since November. The figure rose to 47.2 in August from 46.8 in July, but below the market consensus of 47.5. The weaker reading raised the probability the Federal Reserve (Fed) will cut the interest rate by at least a quarter percentage point later this month.
Traders raised the chance of a more aggressive half-point reduction to 39%, up from 31% before the US ISM Manufacturing PMI report, according to the CME Group’s FedWatch measure. The US ISM Services PMI will be released on Thursday, which is projected to ease to 51.4 in August from 51.1 in July. On Friday, the attention will shift to the US Nonfarm Payrolls (NFP) report for August.
Australian Dollar FAQs
One of the most significant factors for the Australian Dollar (AUD) is the level of interest rates set by the Reserve Bank of Australia (RBA). Because Australia is a resource-rich country another key driver is the price of its biggest export, Iron Ore. The health of the Chinese economy, its largest trading partner, is a factor, as well as inflation in Australia, its growth rate and Trade Balance. Market sentiment – whether investors are taking on more risky assets (risk-on) or seeking safe-havens (risk-off) – is also a factor, with risk-on positive for AUD.
The Reserve Bank of Australia (RBA) influences the Australian Dollar (AUD) by setting the level of interest rates that Australian banks can lend to each other. This influences the level of interest rates in the economy as a whole. The main goal of the RBA is to maintain a stable inflation rate of 2-3% by adjusting interest rates up or down. Relatively high interest rates compared to other major central banks support the AUD, and the opposite for relatively low. The RBA can also use quantitative easing and tightening to influence credit conditions, with the former AUD-negative and the latter AUD-positive.
China is Australia’s largest trading partner so the health of the Chinese economy is a major influence on the value of the Australian Dollar (AUD). When the Chinese economy is doing well it purchases more raw materials, goods and services from Australia, lifting demand for the AUD, and pushing up its value. The opposite is the case when the Chinese economy is not growing as fast as expected. Positive or negative surprises in Chinese growth data, therefore, often have a direct impact on the Australian Dollar and its pairs.
Iron Ore is Australia’s largest export, accounting for $118 billion a year according to data from 2021, with China as its primary destination. The price of Iron Ore, therefore, can be a driver of the Australian Dollar. Generally, if the price of Iron Ore rises, AUD also goes up, as aggregate demand for the currency increases. The opposite is the case if the price of Iron Ore falls. Higher Iron Ore prices also tend to result in a greater likelihood of a positive Trade Balance for Australia, which is also positive of the AUD.
The Trade Balance, which is the difference between what a country earns from its exports versus what it pays for its imports, is another factor that can influence the value of the Australian Dollar. If Australia produces highly sought after exports, then its currency will gain in value purely from the surplus demand created from foreign buyers seeking to purchase its exports versus what it spends to purchase imports. Therefore, a positive net Trade Balance strengthens the AUD, with the opposite effect if the Trade Balance is negative.
- EUR/USD managed to keep a hold of 1.1050 on Tuesday, but action is tilted downside.
- US PMI figures that flubbed forecasts stoked a fresh bid into the Greenback.
- US NFP labor numbers due this week will be a guiding print for Fed rate cut depth.
EUR/USD tilted further into the low side on Tuesday, with intraday bottom bids testing into two-week lows before settling the day near 1.1050 once again. Price action remains limited as markets gear up for one last US Nonfarm Payrolls (NFP) print this week, but a flop in US ISM Purchasing Managers Index (PMI) figures reignited fears of an impending recession.
Forex Today: The prospects of a US soft landing remain challenged by data
Meaningful European data remains limited in the front half of the trading week, and Thursday will see Fiber traders with their hands full thanks to an update to pan-European Retail Sales in July followed by US preview labor figures before Friday’s NFP jobs dump.
Pan-EU Retail Sales for the year ended in July are expected to recovery slightly, forecast to print at 0.1% YoY compared to the previous period’s -0.3% decline. European Gross Domestic Product (GDP) figures are also slated for Friday, and growth is broadly expected to hold steady at previous figures in the second quarter.
ISM’s US Manufacturing PMI for August came in below expectations, printing at 47.2 and missing the median market forecast of 47.5. Despite a soft rebound from July’s multi-month low of 46.8 failed to galvanize markets, giving already flighty investors a perfect excuse to pull back from a recent lopsided tilt into bullish expectations.
Friday's US Nonfarm Payrolls (NFP) report looms large. It represents the last round of key US labor data before the Federal Reserve (Fed) delivers its latest rate call on September 18. Friday's NFP print is widely expected to set the tone for market expectations regarding the depth of a Fed rate cut, with investors fully priced in on the start of a new rate-cutting cycle this month.
EUR/USD price forecast
Fiber has slumped back into near-term technical barriers, but bidders continue to come out of the woodwork in an effort to keep bids on-balance even if they can’t quite pull out a bullish recovery.. EUR/USD popped into a 13-month high just above 1.1200 early last week, and a near-term pullback in Greenback flows sees bids scrambling to hold onto bullish chart paper.
The pair is still trading well north of the 200-day Exponential Moving Average (EMA) at 1.0845. Despite holding deep in the bull country, EUR/USD is still facing a steepening bearish pullback as shorts congregate targets just above the 50-day EMA at 1.0956.
EUR/USD daily chart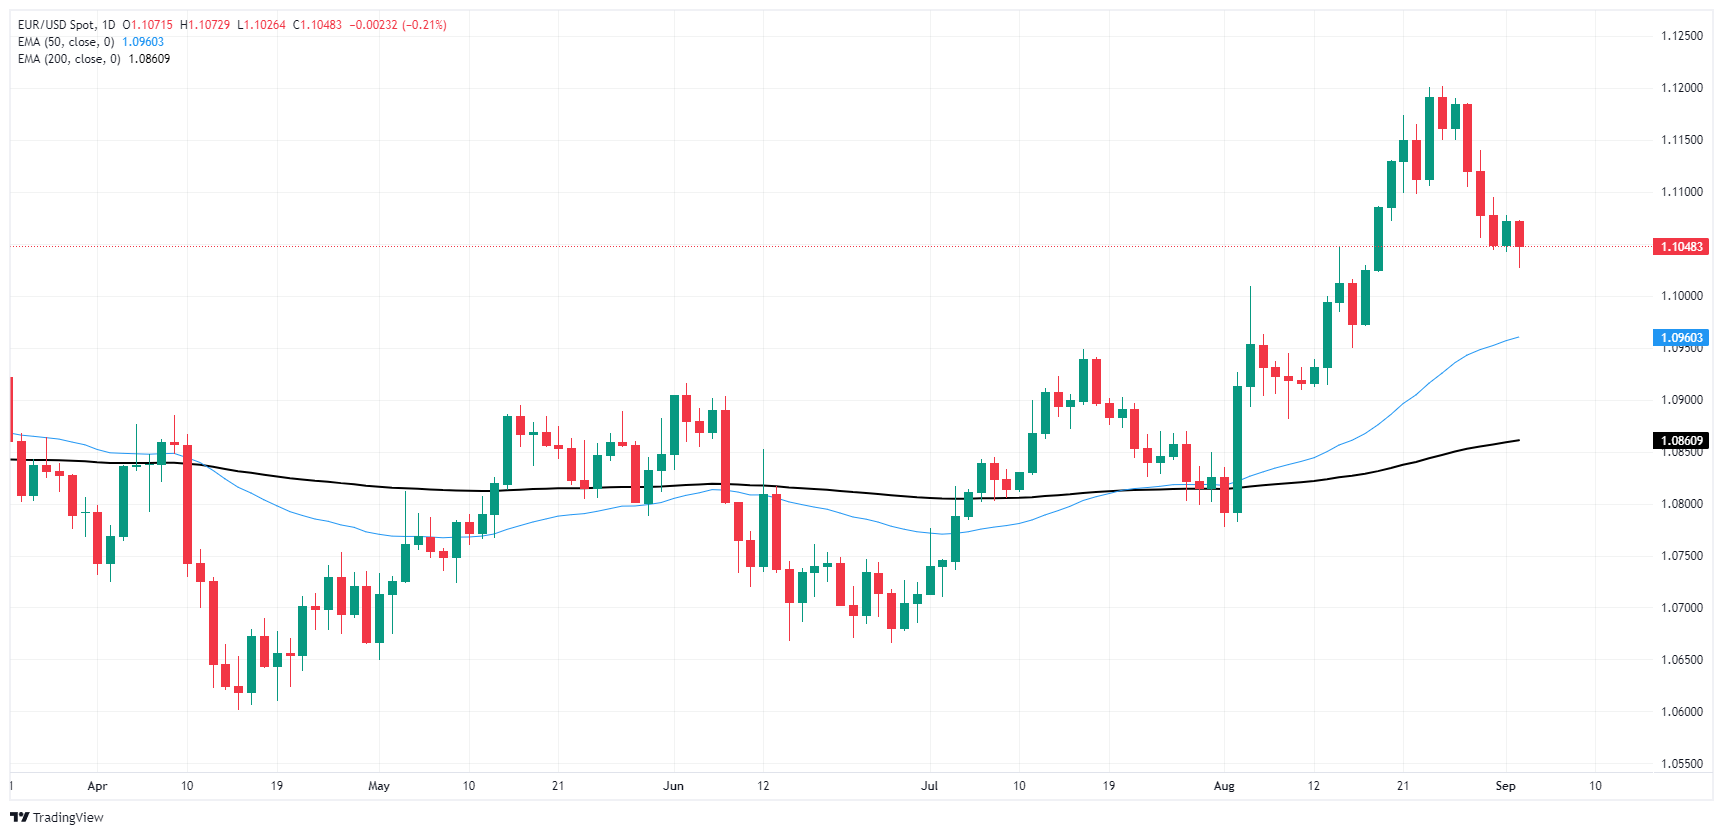
Euro FAQs
The Euro is the currency for the 20 European Union countries that belong to the Eurozone. It is the second most heavily traded currency in the world behind the US Dollar. In 2022, it accounted for 31% of all foreign exchange transactions, with an average daily turnover of over $2.2 trillion a day. EUR/USD is the most heavily traded currency pair in the world, accounting for an estimated 30% off all transactions, followed by EUR/JPY (4%), EUR/GBP (3%) and EUR/AUD (2%).
The European Central Bank (ECB) in Frankfurt, Germany, is the reserve bank for the Eurozone. The ECB sets interest rates and manages monetary policy. The ECB’s primary mandate is to maintain price stability, which means either controlling inflation or stimulating growth. Its primary tool is the raising or lowering of interest rates. Relatively high interest rates – or the expectation of higher rates – will usually benefit the Euro and vice versa. The ECB Governing Council makes monetary policy decisions at meetings held eight times a year. Decisions are made by heads of the Eurozone national banks and six permanent members, including the President of the ECB, Christine Lagarde.
Eurozone inflation data, measured by the Harmonized Index of Consumer Prices (HICP), is an important econometric for the Euro. If inflation rises more than expected, especially if above the ECB’s 2% target, it obliges the ECB to raise interest rates to bring it back under control. Relatively high interest rates compared to its counterparts will usually benefit the Euro, as it makes the region more attractive as a place for global investors to park their money.
Data releases gauge the health of the economy and can impact on the Euro. Indicators such as GDP, Manufacturing and Services PMIs, employment, and consumer sentiment surveys can all influence the direction of the single currency. A strong economy is good for the Euro. Not only does it attract more foreign investment but it may encourage the ECB to put up interest rates, which will directly strengthen the Euro. Otherwise, if economic data is weak, the Euro is likely to fall. Economic data for the four largest economies in the euro area (Germany, France, Italy and Spain) are especially significant, as they account for 75% of the Eurozone’s economy.
Another significant data release for the Euro is the Trade Balance. This indicator measures the difference between what a country earns from its exports and what it spends on imports over a given period. If a country produces highly sought after exports then its currency will gain in value purely from the extra demand created from foreign buyers seeking to purchase these goods. Therefore, a positive net Trade Balance strengthens a currency and vice versa for a negative balance.
- USD/CAD edges lower to near 1.3545 in Wednesday’s early Asian session.
- US ISM Manufacturing PMI came in at 47.2 in August vs. 46.8 prior, missing the estimation.
- The BoC is likely to cut rate at its September meeting on Wednesday.
The USD/CAD pair trades on a weaker note around 1.3545 during the early Asian session on Wednesday. The weaker-than-expected US ISM Purchasing Managers Index (PMI) drags the Greenback lower. The Bank of Canada (BoC) interest rate decision will be the highlight later on Wednesday, with a 25 basis points (bps) rate cut expected.
The business activity in the US manufacturing sector continued to contract, albeit at a softer pace in August. The US ISM Manufacturing PMI rose from an eight-month low in July at 46.8 to 47.2 in August. This figure was below the market consensus of 47.5 and register the lowest reading since November.
The cautious mood ahead of the highly-anticipated US August Nonfarm Payrolls on Friday might provide some support to the US Dollar (USD) and cap the pair’s downside. This event will be closely watched as it might offer some hints about how much the US Federal Reserve (Fed) will cut interest rates. Financial markets have priced in around a 62% chance of a 25 basis points (bps) rate cut by the Fed in September, while the odds of a 50 bps reduction stand at 38%, according to the CME FedWatch tool.
On the Loonie front, the BoC is widely expected to deliver a third consecutive interest rate cut on Wednesday amid easing inflationary pressure in the Canadian economy. Investors see the Canadian central bank to lower its benchmark interest rate by a quarter percentage point to 4.25% followed by several more reductions over this year and 2025. “The Bank of Canada is likely to interpret (last week’s GDP) data as supportive of maintaining its easing bias, with three more quarter-point cuts expected by year-end.” noted Maria Solovieva, TD.
Meanwhile, the further decline in crude oil prices continues to undermine the commodity-linked Canadian Dollar (CAD). It's worth noting that Canada is the largest oil exporter to the United States (US), and lower crude oil prices tend to have a negative impact on the CAD value.
Canadian Dollar FAQs
The key factors driving the Canadian Dollar (CAD) are the level of interest rates set by the Bank of Canada (BoC), the price of Oil, Canada’s largest export, the health of its economy, inflation and the Trade Balance, which is the difference between the value of Canada’s exports versus its imports. Other factors include market sentiment – whether investors are taking on more risky assets (risk-on) or seeking safe-havens (risk-off) – with risk-on being CAD-positive. As its largest trading partner, the health of the US economy is also a key factor influencing the Canadian Dollar.
The Bank of Canada (BoC) has a significant influence on the Canadian Dollar by setting the level of interest rates that banks can lend to one another. This influences the level of interest rates for everyone. The main goal of the BoC is to maintain inflation at 1-3% by adjusting interest rates up or down. Relatively higher interest rates tend to be positive for the CAD. The Bank of Canada can also use quantitative easing and tightening to influence credit conditions, with the former CAD-negative and the latter CAD-positive.
The price of Oil is a key factor impacting the value of the Canadian Dollar. Petroleum is Canada’s biggest export, so Oil price tends to have an immediate impact on the CAD value. Generally, if Oil price rises CAD also goes up, as aggregate demand for the currency increases. The opposite is the case if the price of Oil falls. Higher Oil prices also tend to result in a greater likelihood of a positive Trade Balance, which is also supportive of the CAD.
While inflation had always traditionally been thought of as a negative factor for a currency since it lowers the value of money, the opposite has actually been the case in modern times with the relaxation of cross-border capital controls. Higher inflation tends to lead central banks to put up interest rates which attracts more capital inflows from global investors seeking a lucrative place to keep their money. This increases demand for the local currency, which in Canada’s case is the Canadian Dollar.
Macroeconomic data releases gauge the health of the economy and can have an impact on the Canadian Dollar. Indicators such as GDP, Manufacturing and Services PMIs, employment, and consumer sentiment surveys can all influence the direction of the CAD. A strong economy is good for the Canadian Dollar. Not only does it attract more foreign investment but it may encourage the Bank of Canada to put up interest rates, leading to a stronger currency. If economic data is weak, however, the CAD is likely to fall.
The final reading of Australia's Judo Bank Services Purchasing Managers Index (PMI) rose to 52.5 in August from 52.2 in the previous reading. This figure was above the market consensus of 52.2, the latest data published by Judo Bank and S&P Global showed on Wednesday.
The Composite PMI climbed to 51.7 in August versus 51.4 prior.
Market reaction
At the press time, the AUD/USD pair was up 0.01% on the day to trade at 0.6712.
Australian Dollar FAQs
One of the most significant factors for the Australian Dollar (AUD) is the level of interest rates set by the Reserve Bank of Australia (RBA). Because Australia is a resource-rich country another key driver is the price of its biggest export, Iron Ore. The health of the Chinese economy, its largest trading partner, is a factor, as well as inflation in Australia, its growth rate and Trade Balance. Market sentiment – whether investors are taking on more risky assets (risk-on) or seeking safe-havens (risk-off) – is also a factor, with risk-on positive for AUD.
The Reserve Bank of Australia (RBA) influences the Australian Dollar (AUD) by setting the level of interest rates that Australian banks can lend to each other. This influences the level of interest rates in the economy as a whole. The main goal of the RBA is to maintain a stable inflation rate of 2-3% by adjusting interest rates up or down. Relatively high interest rates compared to other major central banks support the AUD, and the opposite for relatively low. The RBA can also use quantitative easing and tightening to influence credit conditions, with the former AUD-negative and the latter AUD-positive.
China is Australia’s largest trading partner so the health of the Chinese economy is a major influence on the value of the Australian Dollar (AUD). When the Chinese economy is doing well it purchases more raw materials, goods and services from Australia, lifting demand for the AUD, and pushing up its value. The opposite is the case when the Chinese economy is not growing as fast as expected. Positive or negative surprises in Chinese growth data, therefore, often have a direct impact on the Australian Dollar and its pairs.
Iron Ore is Australia’s largest export, accounting for $118 billion a year according to data from 2021, with China as its primary destination. The price of Iron Ore, therefore, can be a driver of the Australian Dollar. Generally, if the price of Iron Ore rises, AUD also goes up, as aggregate demand for the currency increases. The opposite is the case if the price of Iron Ore falls. Higher Iron Ore prices also tend to result in a greater likelihood of a positive Trade Balance for Australia, which is also positive of the AUD.
The Trade Balance, which is the difference between what a country earns from its exports versus what it pays for its imports, is another factor that can influence the value of the Australian Dollar. If Australia produces highly sought after exports, then its currency will gain in value purely from the surplus demand created from foreign buyers seeking to purchase its exports versus what it spends to purchase imports. Therefore, a positive net Trade Balance strengthens the AUD, with the opposite effect if the Trade Balance is negative.
- GBP/USD erased further below 1.3150 on Tuesday as markets bid the Greenback.
- Market sentiment took a hit after US PMI figures failed to meet expectations.
- US NFP figures loom ahead as traders try to gauge the depth of a first Fed rate cut.
GBP/USD softened on Tuesday, briefly testing below 1.3100 as Cable struggles to hold onto a bullish stance amid a near-term bearish pullback. Greenback bidding picked up the pace after a fresh batch of US Purchasing Managers Index (PMI) figures failed to meet market expectations, reigniting investor concerns about the potential for a US recession.
Forex Today: The prospects of a US soft landing remain challenged by data
The data docket remains thin on Wednesday from the UK side, with little of note outside of low-tier final PMI figures for August. US labor figures remain a key point for market participants this week.
ISM’s US Manufacturing PMI for August came in below expectations, printing at 47.2 and missing the median market forecast of 47.5. Despite a soft rebound from July’s multi-month low of 46.8 failed to galvanize markets, giving already flighty investors a perfect excuse to pull back from a recent lopsided tilt into bullish expectations.
Friday's US Nonfarm Payrolls (NFP) report looms large. It represents the last round of key US labor data before the Federal Reserve (Fed) delivers its latest rate call on September 18. Friday's NFP print is widely expected to set the tone for market expectations regarding the depth of a Fed rate cut, with investors fully priced in on the start of a new rate-cutting cycle this month.
GBP/USD price forecast
Cable has backslid from multi-month highs above 1.3250 back below the 1.3150 level as Greenback selling pressure cools, but the pair is stubbornly sticking to recent highs after vaulting to a peak 29-month bid in August. Price action is still tilted firmly into the bullish side above the 200-day Exponential Moving Average (EMA) at 1.2725, while the immediate downside technical target for shorts will be the 50-day EMA just above the 1.2900 handle.
GBP/USD daily chart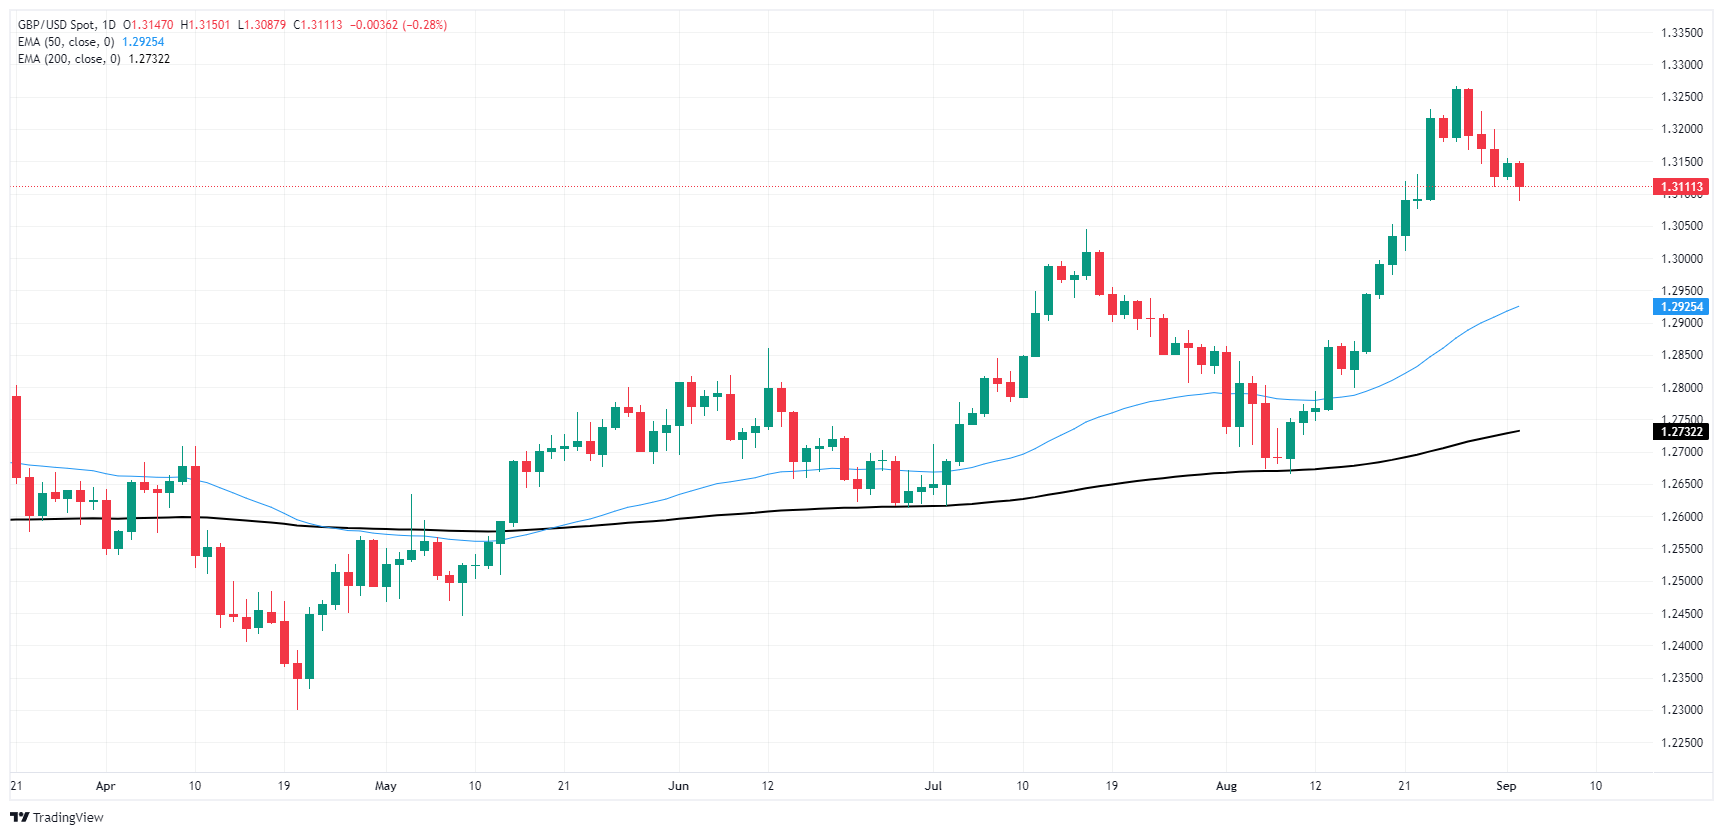
Pound Sterling FAQs
The Pound Sterling (GBP) is the oldest currency in the world (886 AD) and the official currency of the United Kingdom. It is the fourth most traded unit for foreign exchange (FX) in the world, accounting for 12% of all transactions, averaging $630 billion a day, according to 2022 data. Its key trading pairs are GBP/USD, aka ‘Cable’, which accounts for 11% of FX, GBP/JPY, or the ‘Dragon’ as it is known by traders (3%), and EUR/GBP (2%). The Pound Sterling is issued by the Bank of England (BoE).
The single most important factor influencing the value of the Pound Sterling is monetary policy decided by the Bank of England. The BoE bases its decisions on whether it has achieved its primary goal of “price stability” – a steady inflation rate of around 2%. Its primary tool for achieving this is the adjustment of interest rates. When inflation is too high, the BoE will try to rein it in by raising interest rates, making it more expensive for people and businesses to access credit. This is generally positive for GBP, as higher interest rates make the UK a more attractive place for global investors to park their money. When inflation falls too low it is a sign economic growth is slowing. In this scenario, the BoE will consider lowering interest rates to cheapen credit so businesses will borrow more to invest in growth-generating projects.
Data releases gauge the health of the economy and can impact the value of the Pound Sterling. Indicators such as GDP, Manufacturing and Services PMIs, and employment can all influence the direction of the GBP. A strong economy is good for Sterling. Not only does it attract more foreign investment but it may encourage the BoE to put up interest rates, which will directly strengthen GBP. Otherwise, if economic data is weak, the Pound Sterling is likely to fall.
Another significant data release for the Pound Sterling is the Trade Balance. This indicator measures the difference between what a country earns from its exports and what it spends on imports over a given period. If a country produces highly sought-after exports, its currency will benefit purely from the extra demand created from foreign buyers seeking to purchase these goods. Therefore, a positive net Trade Balance strengthens a currency and vice versa for a negative balance.
- Australian Gross Domestic Product is expected to post a modest 1% yearly advance.
- The Reserve Bank of Australia will monitor GDP figures before the September meeting.
- Australian Dollar likely to extend its decline with the expected tepid figures.
Australia will release Gross Domestic Product (GDP) figures on Wednesday. The Australian Bureau of Statistics (ABS) is expected to report that the economy grew 0.3% in the second quarter (Q2) of the year and 1% in the twelve months to June. Annual growth in the first quarter printed at 1.1%. Should the expected 1% be confirmed, it will be the lowest pace of growth since the coronavirus-led recession in 2020.
What to expect from the Q2 GDP report
As previously noted, the Australian economy is expected to have grown by 1% in the year to June. But what does that mean for the Australian Dollar (AUD)?
Despite tepid growth, the Reserve Bank of Australia (RBA) is among those that maintain interest rates unchanged at multi-year highs. The Official Cash Rate (OCR) was lifted for the last time in November 2023 and currently stands at 4.35%. Even further, the RBA is nowhere near trimming interest rates as inflationary pressures have remained high.
And there is a good reason for it. The latest data available shows that consumer prices rose by 3.5% in the year to July, down from the 3.8% pace recorded in the 12 months to June. The RBA’s mandate is to keep annual consumer price inflation between 2% and 3%.
However, high interest rates usually translate into slower economic progress amid higher financial costs. To stimulate growth, the central bank would need to lower the OCR. The tricky thing is that boosting the economy is not within RBA’s mandate.
Theoretically, growth-related figures should not affect policymakers’ decisions. Nevertheless, they do. RBA officials will not acknowledge concerns on the matter but rather maintain the focus on inflation.
Meanwhile, underlying inflation in Australia increased throughout the first half of the year, boosting speculation the RBA could hike interest rates. Since the last meeting, inflation has eased modestly, and market players are willing to believe the OCR has peaked.
How can the GDP report affect the Australian Dollar?
The GDP report will be released on Wednesday at 01:30 GMT, and market participants will likely assess how the outcome could affect the upcoming RBA decision. Faster-than-anticipated growth will have a positive impact on the AUD as it will reflect not only economic progress but also spook fears of higher interest rates.
On the other hand, softer-than-expected progress could trigger multiple alarms. Not only will it push the AUD lower, but it will also fuel speculation the RBA should speed up the decision to trim interest rates, which will also negatively affect the local currency.
Valeria Bednark, FXStreet Chief Analyst, adds: “The Aussie is under strong selling pressure ahead of the announcement, with AUD/USD trading at around 0.6740. The pair fell amid mounting risk-aversion ahead of the release of United States (US) employment-related figures scheduled throughout the rest of the week. The US Dollar benefits from the dismal mood, which means that AUD/USD could easily pierce the 0.6700 mark with GDP figures below expected. Next support is located at 0.6660, en route to the 0.6630 price zone.”
Bednarik also notes: “Upbeat figures could trigger AUD near-term demand, but if risk aversion persists, gains could be limited. Even further, AUD/USD may resume its decline after the dust settles. The 0.6780 region is the immediate bullish target, followed by the 0.6810 price zone. Sellers may reappear around the latter, should the GDP post a modest beat. Finally, outrageous growth data could push the pair further up, with AUD/USD aiming to test the 0.6840 area.
Economic Indicator
Gross Domestic Product (YoY)
The Gross Domestic Product (GDP), released by the Australian Bureau of Statistics on a quarterly basis, is a measure of the total value of all goods and services produced in Australia during a given period. The GDP is considered as the main measure of Australian economic activity. The YoY reading compares economic activity in the reference quarter compared with the same quarter a year earlier. Generally, a rise in this indicator is bullish for the Australian Dollar (AUD), while a low reading is seen as bearish.
Read more.Next release: Wed Sep 04, 2024 01:30
Frequency: Quarterly
Consensus: 1%
Previous: 1.1%
Source: Australian Bureau of Statistics
The Australian Bureau of Statistics (ABS) releases the Gross Domestic Product (GDP) on a quarterly basis. It is published about 65 days after the quarter ends. The indicator is closely watched, as it paints an important picture for the economy. A strong labor market, rising wages and rising private capital expenditure data are critical for the country’s improved economic performance, which in turn impacts the Reserve Bank of Australia’s (RBA) monetary policy decision and the Australian dollar. Actual figures beating estimates is considered AUD bullish, as it could prompt the RBA to tighten its monetary policy.
GDP FAQs
A country’s Gross Domestic Product (GDP) measures the rate of growth of its economy over a given period of time, usually a quarter. The most reliable figures are those that compare GDP to the previous quarter e.g Q2 of 2023 vs Q1 of 2023, or to the same period in the previous year, e.g Q2 of 2023 vs Q2 of 2022. Annualized quarterly GDP figures extrapolate the growth rate of the quarter as if it were constant for the rest of the year. These can be misleading, however, if temporary shocks impact growth in one quarter but are unlikely to last all year – such as happened in the first quarter of 2020 at the outbreak of the covid pandemic, when growth plummeted.
A higher GDP result is generally positive for a nation’s currency as it reflects a growing economy, which is more likely to produce goods and services that can be exported, as well as attracting higher foreign investment. By the same token, when GDP falls it is usually negative for the currency. When an economy grows people tend to spend more, which leads to inflation. The country’s central bank then has to put up interest rates to combat the inflation with the side effect of attracting more capital inflows from global investors, thus helping the local currency appreciate.
When an economy grows and GDP is rising, people tend to spend more which leads to inflation. The country’s central bank then has to put up interest rates to combat the inflation. Higher interest rates are negative for Gold because they increase the opportunity-cost of holding Gold versus placing the money in a cash deposit account. Therefore, a higher GDP growth rate is usually a bearish factor for Gold price.
- XAG/USD hovers near $28.00, pressured by bearish RSI and moving averages above current levels.
- Breaking below $28.00 opens the door for further declines toward $27.71, potentially targeting the 200-DMA at $26.59.
- Bulls must reclaim the 100-DMA at $29.14 to shift momentum and regain control over Silver prices.
Silver price ended Tuesday’s session with losses of more than 1.50%, after economic data in the US hints that manufacturing activity continues to decelerate. Although it justifies the Federal Reserve’s first interest rate cut in September, the Greenback advanced sharply on relief that the labor market is cooling gradually. The XAG/USD trades at $28.05.
XAG/USD Price Forecast: Technical outlook
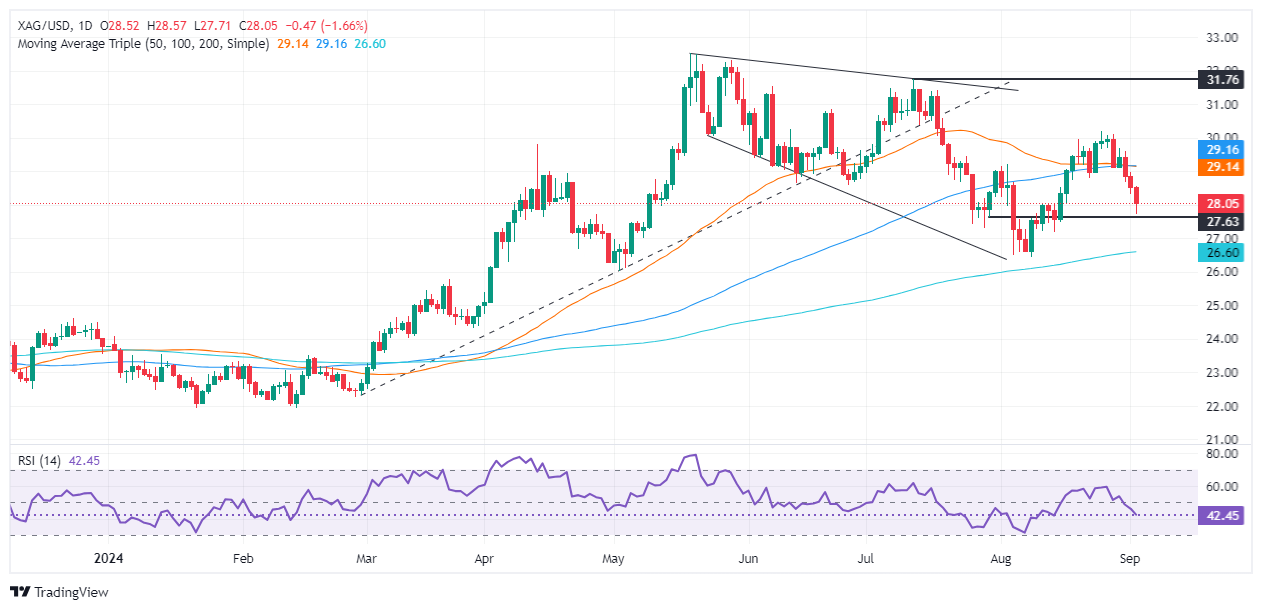
At the time of writing, XAG/USD hovers around the $28.00 mark after hitting a two-week low of $27.71, yet buyers recovered some ground. However, momentum is tilted bearish, as shown by the Relative Strength Index (RSI) and the 50 and 100-daily moving averages (DMAs) standing above the current Silver price.
For a bearish resumption, XAG/USD must clear the $28.00 figure, followed by the September 3 low of $27.71. Further weakness will sponsor a leg-down toward the August 14 swing low of $27.18, followed by the 200-day moving average (DMA) at $26.59.
Conversely, buyers need to reclaim the 100-DMA at $29.14 if they would like to regain control.
XAG/USD Price Action – Daily Chart
Silver FAQs
Silver is a precious metal highly traded among investors. It has been historically used as a store of value and a medium of exchange. Although less popular than Gold, traders may turn to Silver to diversify their investment portfolio, for its intrinsic value or as a potential hedge during high-inflation periods. Investors can buy physical Silver, in coins or in bars, or trade it through vehicles such as Exchange Traded Funds, which track its price on international markets.
Silver prices can move due to a wide range of factors. Geopolitical instability or fears of a deep recession can make Silver price escalate due to its safe-haven status, although to a lesser extent than Gold's. As a yieldless asset, Silver tends to rise with lower interest rates. Its moves also depend on how the US Dollar (USD) behaves as the asset is priced in dollars (XAG/USD). A strong Dollar tends to keep the price of Silver at bay, whereas a weaker Dollar is likely to propel prices up. Other factors such as investment demand, mining supply – Silver is much more abundant than Gold – and recycling rates can also affect prices.
Silver is widely used in industry, particularly in sectors such as electronics or solar energy, as it has one of the highest electric conductivity of all metals – more than Copper and Gold. A surge in demand can increase prices, while a decline tends to lower them. Dynamics in the US, Chinese and Indian economies can also contribute to price swings: for the US and particularly China, their big industrial sectors use Silver in various processes; in India, consumers’ demand for the precious metal for jewellery also plays a key role in setting prices.
Silver prices tend to follow Gold's moves. When Gold prices rise, Silver typically follows suit, as their status as safe-haven assets is similar. The Gold/Silver ratio, which shows the number of ounces of Silver needed to equal the value of one ounce of Gold, may help to determine the relative valuation between both metals. Some investors may consider a high ratio as an indicator that Silver is undervalued, or Gold is overvalued. On the contrary, a low ratio might suggest that Gold is undervalued relative to Silver.
- USD/JPY forms a bearish engulfing pattern, signaling potential further downside in the near term.
- RSI momentum supports sellers, with first support eyed at Tenkan-Sen 145.33 and psychological 145.00 level.
- Bulls must reclaim Kijun-Sen at 148.45, with 150.00 needed to reverse the bearish trend.
The USD/JPY dropped late in the North American session, registering losses of over 0.80% or more than 100 pips. It now trades at 145.68.
During the overnight session for US traders, headlines revealed that Bank of Japan (BoJ) Governor Kazuo Ueda reiterated his hawkish stance on remarks submitted to a government panel. This was the main driver of the pair, along with the plunge of the yield of the US 10-year Treasury note.
USD/JPY Price Forecast: Technical outlook
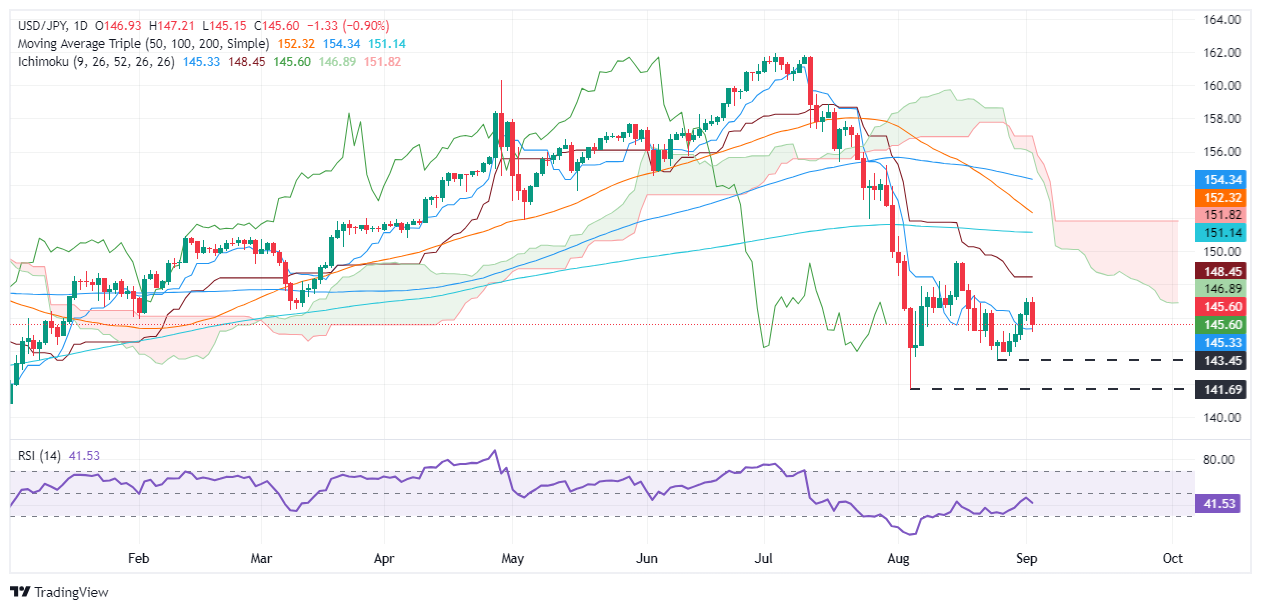
From a technical standpoint, the USD/JPY is downward biased, forming a ‘bearish engulfing’ chart pattern. This hints that more downside is seen, further confirmed by the Relative Strength Index (RSI), reassuring that momentum supports sellers.
With the path of least resistance tilted to the downside, USD/JPY's first support would be the Tenkan-Sen at 145.33. If hurdled, the next stop would be the 145.00 figure, ahead of testing the next cycle low of 143.45, the August 26 daily low. This would be the last line of defense for bulls, ahead of the August 5 low of 141.69.
For bulls to regain control, they must regain the Kijun-Sen at 148.45 before reclaiming the 150.00 figure above the latest cycle high of 149.39.
USD/JPY Price Action – Daily Chart
Japanese Yen PRICE Today
The table below shows the percentage change of Japanese Yen (JPY) against listed major currencies today. Japanese Yen was the strongest against the Australian Dollar.
| USD | EUR | GBP | JPY | CAD | AUD | NZD | CHF | |
|---|---|---|---|---|---|---|---|---|
| USD | 0.26% | 0.28% | -0.92% | 0.42% | 1.19% | 0.93% | -0.12% | |
| EUR | -0.26% | 0.00% | -1.16% | 0.14% | 0.91% | 0.55% | -0.39% | |
| GBP | -0.28% | -0.01% | -1.18% | 0.14% | 0.90% | 0.55% | -0.39% | |
| JPY | 0.92% | 1.16% | 1.18% | 1.32% | 2.10% | 1.67% | 0.77% | |
| CAD | -0.42% | -0.14% | -0.14% | -1.32% | 0.75% | 0.32% | -0.53% | |
| AUD | -1.19% | -0.91% | -0.90% | -2.10% | -0.75% | -0.46% | -1.29% | |
| NZD | -0.93% | -0.55% | -0.55% | -1.67% | -0.32% | 0.46% | -0.83% | |
| CHF | 0.12% | 0.39% | 0.39% | -0.77% | 0.53% | 1.29% | 0.83% |
The heat map shows percentage changes of major currencies against each other. The base currency is picked from the left column, while the quote currency is picked from the top row. For example, if you pick the Japanese Yen from the left column and move along the horizontal line to the US Dollar, the percentage change displayed in the box will represent JPY (base)/USD (quote).
- Gold prices fall as traders return from Labor Day, despite a stronger Dollar amid US economic slowdown signs.
- US ISM Manufacturing PMI remains in contraction; employment sub-component improvement offers market some relief.
- Despite a drop in 10-year Treasury yields to 3.84%, gold only briefly recovers after dipping to $2,473.
Gold prices fell during the North American session as traders returned to their desks following the Labor Day holiday. Data from the United States (US) hinted that business activity contracted, though traders bought the Greenback, a headwind for the golden metal. The XAU/USD trades at 2490, down 0.34%.
Earlier, the Institute for Supply Management (ISM) revealed the August manufacturing PMI, remained below the 50-line contraction/expansion level, an indication of an economic slowdown. Despite this, an employment sub-component of the report improved slightly.
This is a relief for Federal Reserve officials, who remained worried about the labor market weakness. Fed Chair Jerome Powell said in a speech in Jackson Hole that employment risks are tilted to the upside.
Bullion prices ignored the fall in US Treasury bond yields yet recovered some ground after hitting a low of $2,473. The US 10-year Treasury note yields 3.84%, dropping eight basis points after the ISM’s report.
According to the CME FedWatch Tool, markets are pricing in a 65% chance of the Fed cutting its rate by 25 basis points (bps) at the upcoming September meeting. This will be a headwind for the Greenback and a tailwind for the non-yielding metal, which is expected to rise moderately, as 35% of the traders had positioned for a 50 bps cut.
"If the US jobs report is significantly weaker, speculation about a U.S. recession and faster rate cuts will resurface, further supporting gold," analysts at Commerzbank noted.
The US economic docket will be busy this week with the release of JOLTS job openings, the ADP National Employment Change, and the Nonfarm Payrolls (NFP) figures.
Daily digest market movers: Gold price traders await busy US economic calendar
- ISM Manufacturing PMI for August improved from 46.8 to 47.2, below estimates of 47.5.
- July’s JOLTS job openings are expected at 8.10 million, down from 8.184 million in June.
- Private hiring, revealed by the ADP National Employment Change report, is foreseen increasing from 122K in July to 150K in August.
- August’s NFP figures are expected to rise from 114K to 163K, while the Unemployment Rate could dip, according to the consensus, from 4.3% to 4.2%.
- December 2024 Chicago Board of Trade (CBOT) fed funds future rates contract hints that investors are eyeing 98 basis points of Fed easing this year.
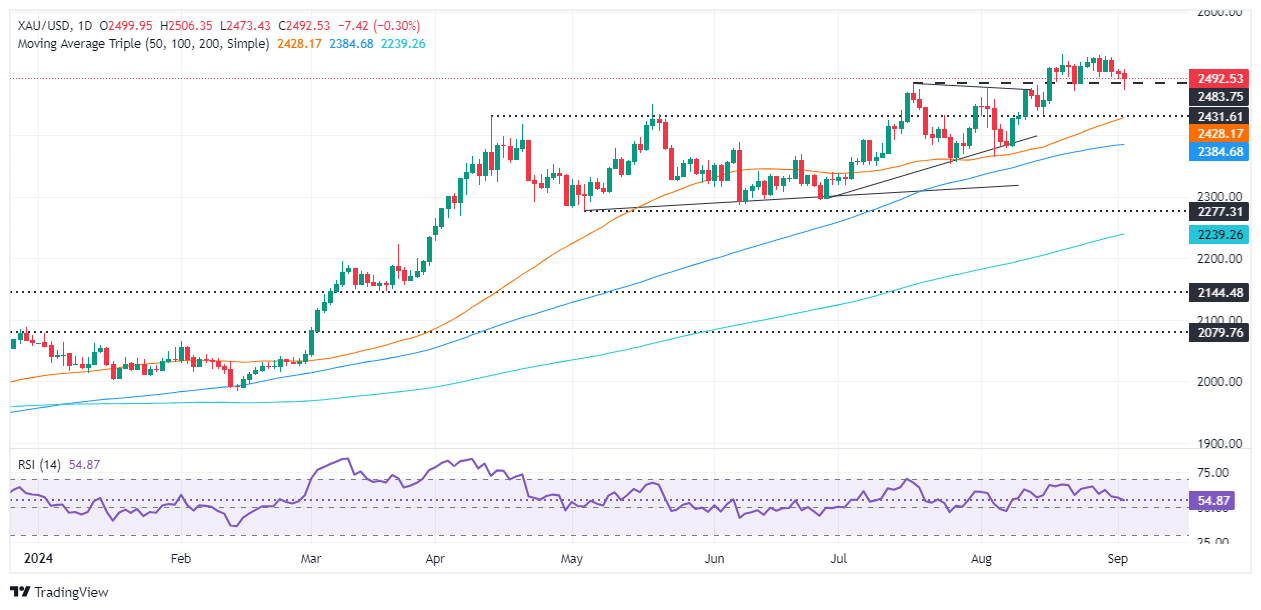
Technical outlook: Gold price set to dive further below $2,500
Gold price is upward biased, even though momentum shifted in sellers’ favor and opened the door for a drop to $2,470. The Relative Strength Index (RSI) hints that buyers are in charge, but in the near-term, the yellow metal could weaken.
In that event, if XAU/USD drops below $2,500, the next support would be the August 22 low at $2,470. Once surpassed, the next stop would be the confluence of the August 15 swing low and the 50-day Simple Moving Average (SMA) near the $2,427-$2,431 area.
Conversely, if XAU/USD stays above $2,500, the next resistance would be the ATH, and the following resistance would be the $2,550 mark. A breach of the latter will expose $2,600.
Gold FAQs
Gold has played a key role in human’s history as it has been widely used as a store of value and medium of exchange. Currently, apart from its shine and usage for jewelry, the precious metal is widely seen as a safe-haven asset, meaning that it is considered a good investment during turbulent times. Gold is also widely seen as a hedge against inflation and against depreciating currencies as it doesn’t rely on any specific issuer or government.
Central banks are the biggest Gold holders. In their aim to support their currencies in turbulent times, central banks tend to diversify their reserves and buy Gold to improve the perceived strength of the economy and the currency. High Gold reserves can be a source of trust for a country’s solvency. Central banks added 1,136 tonnes of Gold worth around $70 billion to their reserves in 2022, according to data from the World Gold Council. This is the highest yearly purchase since records began. Central banks from emerging economies such as China, India and Turkey are quickly increasing their Gold reserves.
Gold has an inverse correlation with the US Dollar and US Treasuries, which are both major reserve and safe-haven assets. When the Dollar depreciates, Gold tends to rise, enabling investors and central banks to diversify their assets in turbulent times. Gold is also inversely correlated with risk assets. A rally in the stock market tends to weaken Gold price, while sell-offs in riskier markets tend to favor the precious metal.
The price can move due to a wide range of factors. Geopolitical instability or fears of a deep recession can quickly make Gold price escalate due to its safe-haven status. As a yield-less asset, Gold tends to rise with lower interest rates, while higher cost of money usually weighs down on the yellow metal. Still, most moves depend on how the US Dollar (USD) behaves as the asset is priced in dollars (XAU/USD). A strong Dollar tends to keep the price of Gold controlled, whereas a weaker Dollar is likely to push Gold prices up.
- The Dow Jones tumbled 500 points on Monday as investor confidence buckles.
- Markets have fallen victim to new recession fears after US ISM figures miss the mark.
- Investors are jostling for position ahead of this week’s bumper NFP jobs report.
The Dow Jones Industrial Average (DJIA) backslid to kick off the new trading week on Tuesday after US markets took the Labor Day holiday off. US traders were greeted by a fresh misprint in US ISM Manufacturing Purchasing Managers Index (PMI) figures that failed to meet expectations of a rebound in the print, sending a fresh round of recession fears rippling through equity markets.
ISM’s Manufacturing PMI for August came in below expectations, printing at 47.2 and missing the median market forecast of 47.5. Despite a soft rebound from July’s multi-month low of 46.8 failed to galvanize markets, giving already flighty investors a perfect excuse to pull back from a recent lopsided tilt into bullish expectations.
Tuesday’s overall decline has kicked off September’s trading with a notable bearish note as markets remain leery of softer US data on a per-release basis. An overall decline in the tech sector extended a broad-market pullback as the AI darling race begins to show cracks, with high-profile semiconductor companies struggling to hit lofty growth metrics.
Friday's US Nonfarm Payrolls (NFP) report looms large on Friday, and represents the last round of key US labor data before the Federal Reserve (Fed) delivers its latest rate call on September 18. Friday's NFP print is widely expected to set the tone for market expectations regarding the depth of a Fed rate cut, with investors fully priced in on the start of a new rate cutting cycle this month.
Dow Jones news
Most of the Dow Jones equity board dipped into the red on Tuesday, with less than a third of the index finding the green. Verizon Communications (VZ) still managed to squeeze out a 2.4% gain on the day, rising to $42.80 per share, while Intel (INTC) plummeted roughly 8.5% to $20.17 per share.
According to market experts, Intel runs the risk of being dropped from the Dow Jones index, due in no small part to reports that the tech company is continuing to weigh slashing even more departments from the company in a bid to appease investors.
Elsewhere, 3M (MMM) is now at the top of the Dow Jones leaderboard, outperforming the rest of the equity index. 3M has climbed nearly 50% YTD, in a stellar recovery after spending half a decade in the dumps.
Dow Jones price forecast
The Dow Jones’ Tuesday plunge has dragged the index back below the 41,000 handle, declining over a full percent from the day’s opening bids and poised for its worst single-day performance in a month. The Dow Jones has tumbled 550 points after chalking in fresh record highs only last week, when DJIA bidders came within a stroke of 41,600.
Despite a near-term pullback, the Dow Jones is still trading deep into bull country, holding well above the 200-day Exponential Moving Average (EMA) at 38,558. The nearest technical barrier for short pressure to take aim at rests at the 50-day EMA near 40,230.
Dow Jones daily chart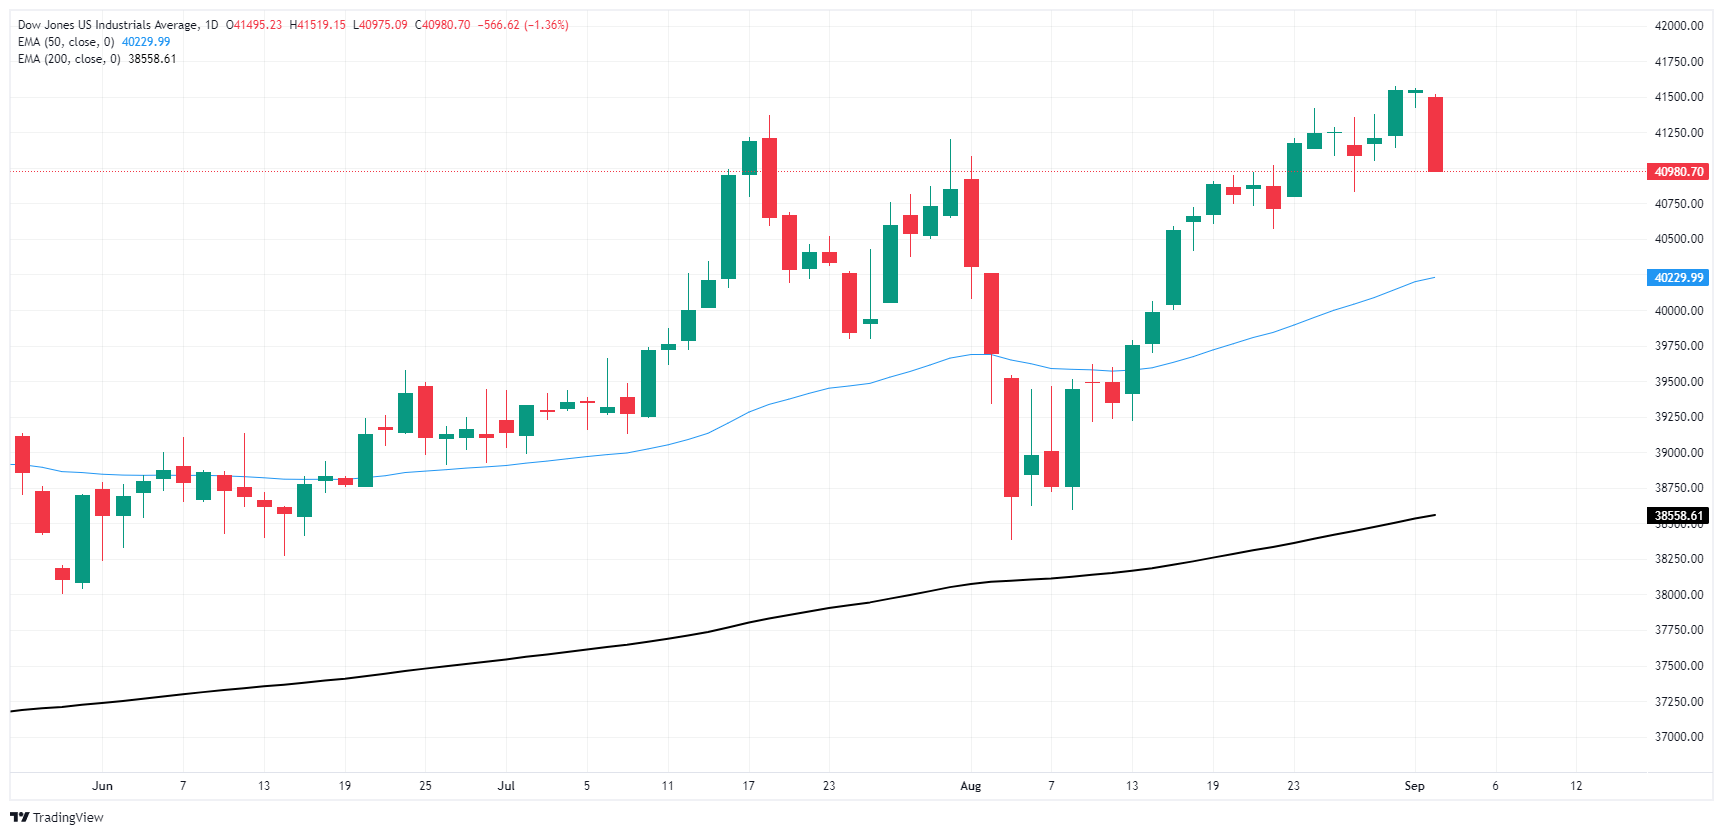
Dow Jones FAQs
The Dow Jones Industrial Average, one of the oldest stock market indices in the world, is compiled of the 30 most traded stocks in the US. The index is price-weighted rather than weighted by capitalization. It is calculated by summing the prices of the constituent stocks and dividing them by a factor, currently 0.152. The index was founded by Charles Dow, who also founded the Wall Street Journal. In later years it has been criticized for not being broadly representative enough because it only tracks 30 conglomerates, unlike broader indices such as the S&P 500.
Many different factors drive the Dow Jones Industrial Average (DJIA). The aggregate performance of the component companies revealed in quarterly company earnings reports is the main one. US and global macroeconomic data also contributes as it impacts on investor sentiment. The level of interest rates, set by the Federal Reserve (Fed), also influences the DJIA as it affects the cost of credit, on which many corporations are heavily reliant. Therefore, inflation can be a major driver as well as other metrics which impact the Fed decisions.
Dow Theory is a method for identifying the primary trend of the stock market developed by Charles Dow. A key step is to compare the direction of the Dow Jones Industrial Average (DJIA) and the Dow Jones Transportation Average (DJTA) and only follow trends where both are moving in the same direction. Volume is a confirmatory criteria. The theory uses elements of peak and trough analysis. Dow’s theory posits three trend phases: accumulation, when smart money starts buying or selling; public participation, when the wider public joins in; and distribution, when the smart money exits.
There are a number of ways to trade the DJIA. One is to use ETFs which allow investors to trade the DJIA as a single security, rather than having to buy shares in all 30 constituent companies. A leading example is the SPDR Dow Jones Industrial Average ETF (DIA). DJIA futures contracts enable traders to speculate on the future value of the index and Options provide the right, but not the obligation, to buy or sell the index at a predetermined price in the future. Mutual funds enable investors to buy a share of a diversified portfolio of DJIA stocks thus providing exposure to the overall index.
The Greenback regained balance and returned in a strong fashion following Monday’s inconclusive price action amidst the Labor Day holiday, advancing to two-week highs against the backdrop of further weakness in the risk-linked assets.
Here is what you need to know on Wednesday, September 4:
The US Dollar Index (DXY) advanced further and flirted with the key 102.00 barrier following reignited recession concerns and despite declining US yields. The weekly Mortgage Applications by MBA are due on September 4, followed by Balance of Trade results, Factory Orders, and the Fed Beige Book.
EUR/USD picked up extra downside traction and dropped below 1.1030 following the strong bounce in the Greenback. The final HCOB Services PMI in Germany and the euro bloc is expected on September 4.
GBP/USD added to the ongoing bearish correction and breached the 1.3100 support to hit two-week lows. The final S&P Global Services PMI will be released on September 4.
The sharp comeback of the Japanese yen dragged USD/JPY to the proximity of the 145.00 zone after four consecutive daily advances. On September 4, comes the final Jibun Bank Services PMI.
AUD/USD plummeted more than 1% and traded just pips away from the key support at 0.6700 the figure, all in response to the stronger US Dollar, Chinese demand jitters, and persistent weakness around commodities. The Ai Group Industry Index and the final Judo Bank Services PMI are due on September 4.
WTI prices collapsed to the boundaries of the key $70.00 mark per barrel on the back of a potential deal in Libya, which could see local oil production and exports resume their activity in the very near term.
Prices of Gold broke below the $2,500 mark per ounce troy to print new multi-day lows amidst the resumption of the bid bias in the US Dollar. Silver also saw its recent leg lower gather pace, deflating to three-week lows below the $28.00 mark per ounce.
- Mexican Peso on backfoot as Congress votes on controversial judicial reform.
- Morena’s supermajority is expected to pass the bill to the Senate, where they don’t have the majority.
- Mexico’s Unemployment Rate rises in July, reflecting economic weakness.
The Mexican Peso registered losses for the second straight day against the Greenback, yet it has recovered some ground. The USD/MXN fell from around 19.98 after the release of the US Institute for Supply Management (ISM) Manufacturing PMI report. The USD/MXN trades at 19.85 and gains some 0.30% at the time of writing.
Political turmoil in Mexico weighs on the Mexican currency as Congress prepares to vote for the judicial reform, which, according to foreign governments, workers of the Mexican court system, and multinational companies, if approved, could threaten democracy and open the door for criminal organizations to infiltrate the courts.
It is expected that Morena’s supermajority will approve the bill at the Chamber of Deputies. However, in the Senate, Morena remains slightly short of achieving the majority needed to modify the Constitution.
Regarding this, a judge granted a stay over the weekend to prevent debate on the proposal. The initiative has sparked a strike in the judicial sector, strained relations with the United States, and shaken local markets amid widespread doubts it generates.
In July, Fitch Ratings commented that it could negatively affect Mexico's investment appetite.
In addition, President Andres Manuel Lopez Obrador has also pushed bills to abolish autonomous bodies, such as the antitrust regulator and the Transparency Institute.
Mexico’s economic docket featured jobless rate data, which showed an uptick in the Unemployment Rate, which was aligned with the estimated rate, though higher than in June, according to the National Statistics Agency (INEGI).
Across the border, the US ISM Manufacturing PMI remained in contractionary territory, yet the Employment sub-component improved compared to July’s data, welcomed by investors as Federal Reserve (Fed) officials had shifted to achieve the maximum employment mandate.
Daily digest market movers: Mexican Peso tumbles as economic data confirms slowdown
- Mexico’s Unemployment Rate increased to 2.9% in July as expected, but it was higher than the 2.8% from June. Seasonally-adjusted figures showed Jobless Rate was unchanged at 2.7%.
- Monday’s data in Mexico showed an improvement in Business Confidence, while business activity deteriorated further as measured by the S&P Global Manufacturing PMI.
- Most banks expect the Bank of Mexico (Banxico) to reduce rates by at least 50 basis points (bps) for the remainder of 2024. This would pressure the Mexican currency, which has already depreciated 15.38% year to date (YTD).
- ISM Manufacturing PMI in August came at 47.2, below estimates of 47.5 but above July’s 46.8. Meanwhile, the Employment sub-component index rose from 43.4 to 46.0.
- US Nonfarm Payrolls in August are expected to grow from 114K to 163K, while the Unemployment Rate is foreseen ticking lower from 4.3% to 4.2%.
- Data from the Chicago Board of Trade (CBOT) suggests the Fed will cut at least 96.5 basis points, according to the fed funds rate futures contract for December 2024.
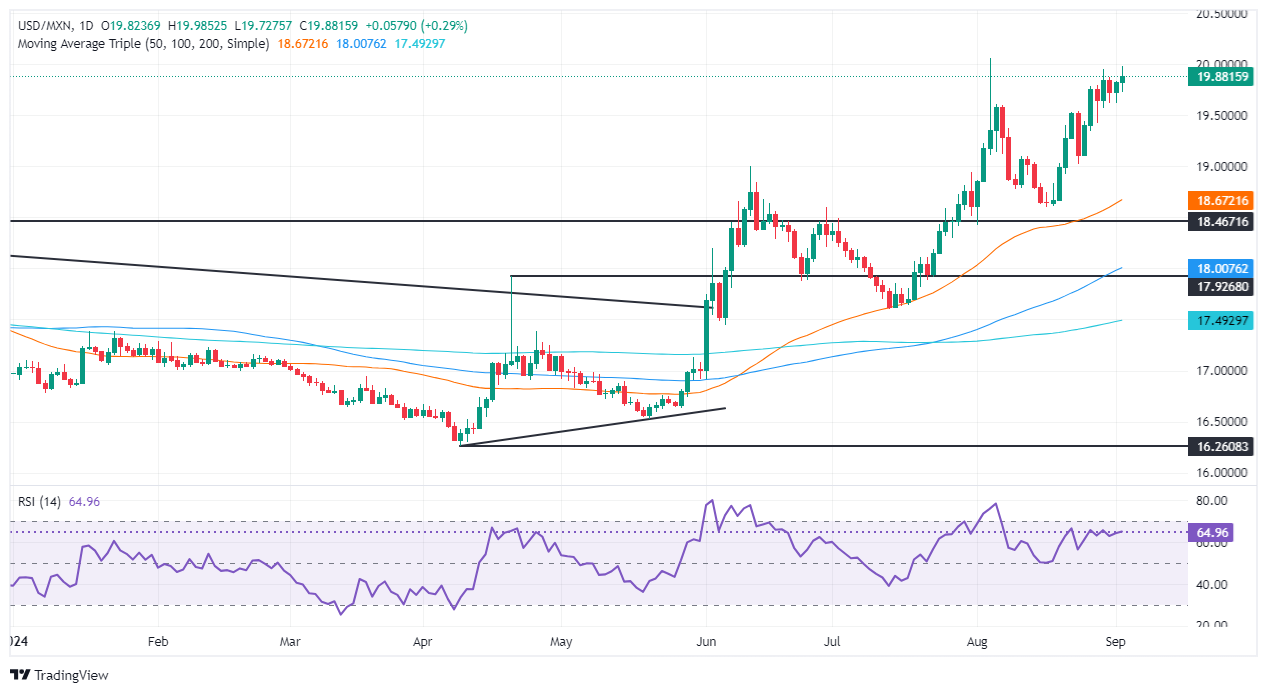
Technical outlook: Mexican Peso slumps as USD/MXN climbs above 19.80
The USD/MXN is upwardly biased, consolidating near the 19.50-20.00 area. The Relative Strength Index (RSI) is flat, though it remains bullish, indicating that momentum shows further upside in the exotic pair.
If USD/MXN buyers clear the 20.00 figure, plenty of additional topside targets exist. The next resistance would be the YTD high at 20.22, followed by the September 28, 2022, daily high at 20.57. If those two levels are surrendered, the next stop would be August 2, 2022, swing high at 20.82, ahead of 21.00.
On further USD/MXN weakness, the first support would be 19.50. A breach of the latter will expose the August 23 swing low of 19.02 before giving way for sellers eyeing a test of the 50-day Simple Moving Average (SMA) at 18.65.
Mexican Peso FAQs
The Mexican Peso (MXN) is the most traded currency among its Latin American peers. Its value is broadly determined by the performance of the Mexican economy, the country’s central bank’s policy, the amount of foreign investment in the country and even the levels of remittances sent by Mexicans who live abroad, particularly in the United States. Geopolitical trends can also move MXN: for example, the process of nearshoring – or the decision by some firms to relocate manufacturing capacity and supply chains closer to their home countries – is also seen as a catalyst for the Mexican currency as the country is considered a key manufacturing hub in the American continent. Another catalyst for MXN is Oil prices as Mexico is a key exporter of the commodity.
The main objective of Mexico’s central bank, also known as Banxico, is to maintain inflation at low and stable levels (at or close to its target of 3%, the midpoint in a tolerance band of between 2% and 4%). To this end, the bank sets an appropriate level of interest rates. When inflation is too high, Banxico will attempt to tame it by raising interest rates, making it more expensive for households and businesses to borrow money, thus cooling demand and the overall economy. Higher interest rates are generally positive for the Mexican Peso (MXN) as they lead to higher yields, making the country a more attractive place for investors. On the contrary, lower interest rates tend to weaken MXN.
Macroeconomic data releases are key to assess the state of the economy and can have an impact on the Mexican Peso (MXN) valuation. A strong Mexican economy, based on high economic growth, low unemployment and high confidence is good for MXN. Not only does it attract more foreign investment but it may encourage the Bank of Mexico (Banxico) to increase interest rates, particularly if this strength comes together with elevated inflation. However, if economic data is weak, MXN is likely to depreciate.
As an emerging-market currency, the Mexican Peso (MXN) tends to strive during risk-on periods, or when investors perceive that broader market risks are low and thus are eager to engage with investments that carry a higher risk. Conversely, MXN tends to weaken at times of market turbulence or economic uncertainty as investors tend to sell higher-risk assets and flee to the more-stable safe havens.
Despite the current massive production losses in Libya, a media report on Friday, according to which six sources close to OPEC indicated that the eight OPEC+ countries would stick to their announcement and reduce voluntary cuts from October, caused a massive setback in the oil market, Commerzbank’s commodity analyst Barbara Lambrecht notes.
OPEC+ to ‘pay’ for its phase-out with significantly lower prices
“The price of Brent crude fell from just over $80 to just under $77 per barrel. On the one hand, the window of opportunity for production increases of around 180,000 barrels per day per month seems favorable in view of the massive production shortfalls.”
“On the other hand, it is not possible to predict 1) how long the production losses in Libya will last – the UN is already trying to mediate between the parties to the conflict; 2) whether Iraq (and Kazakhstan) will actually compensate for the overproduction from September and reduce their production; and 3) whether global demand for oil will actually recover as strongly in the second half of the year as the IEA has so far assumed.”
“In its August report, it projected that global oil demand would be more than 1.5 million barrels per day higher than in the first half of the year. China's recently subdued imports are a particular cause for skepticism: the poor mood in Chinese industry does not give rise to hopes of a rapid turnaround. As a result, there is a risk that OPEC+ will ‘pay’ for its phase-out in the form of significantly lower prices.”
The UK S&P Global Manufacturing PMI for August was confirmed at 52.5 yesterday, the strongest result for the index in a little over two years, Scotiabank’s Chief FX Strategist Shaun Osborne notes.
GBP gains above 1.3160 may drive some short-term gains
“Growth momentum, still elevated wages and inflation hotspots will keep the BoE sidelined in September (just 5-6bps of cuts are priced in for the policy meeting on the 19th) as many other core central banks ease policy. Slower rate cuts in the UK relative to other top central banks should limit scope for GBP losses in the near term.”
“GBP/USD has corrected a bit less than a quarter of the August rally and looks to be finding support around 1.3120 Fibonacci retracement (23.6% of the 1.2660/1.3266 rally). A low close on the week through Friday suggests consolidation rather than outright bearishness for the pound.”
“GBP gains above 1.3160 may drive some short-term gains while a push under 1.3120 will likely drive a little more weakness towards the 1.2950/1.3050 range.”
- GBP/USD slips below 1.3100 despite RSI giving mixed signals.
- RSI trends bullish but momentum shifts to sellers, descending towards neutral.
- A drop below 1.3100, GBP/USD could test July 17 high at 1.3043; further drops may reach psychological 1.3000, then 50-DMA at 1.2894.
- Bullish trend resumes if GBP/USD sustains above 1.3100, surpassing September 2 peak at 1.3155, aiming for channel top at 1.3200.
The GBP/USD makes a U-turn, dives in early trading on Tuesday during the North American session, losing around 0.20%, and trades at 1.3099, below the 1.3100 figure.
The US ISM Manufacturing PMI for August missed estimates, suggesting the economy is cooling due to the Fed's restrictive policy. However, an employment sub-component inside the report showed a slight improvement, which could be a prelude to Friday’s Nonfarm Payrolls report.
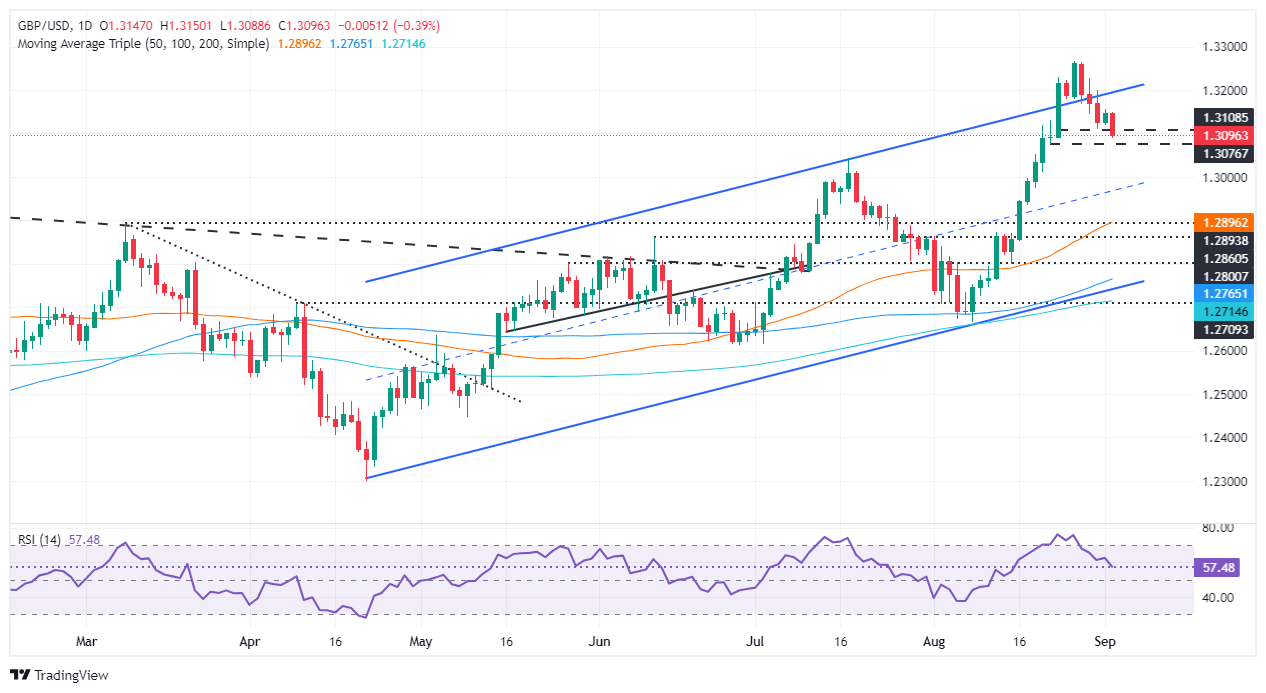
GBP/USD Price Forecast: Technical outlook
The GBP/USD slid sharply on the data release, about to crack the 1.3100 figure. The Relative Strength Index (RSI) remains bullish, but momentum has swung in the sellers' favor as the RSI aims lower, approaching its neutral level.
If GBP/USD tumbles below 1.3100, this could clear the path to test the 1.3043, July 17 high turned support. A drop below could cause the pair to test 1.3000, and if surpassed, the 50-day moving average (DMA) would be up next at 1.2894.
If bulls want to remain in charge, they must hold GBP/USD above 1.3100. For an uptrend resumption, clear the September 2 peak at 1.3155 before challenging the ascending channel top-trendline at 1.3200.
GBP/USD Price Action – Daily Chart
British Pound PRICE Today
The table below shows the percentage change of British Pound (GBP) against listed major currencies today. British Pound was the strongest against the Australian Dollar.
| USD | EUR | GBP | JPY | CAD | AUD | NZD | CHF | |
|---|---|---|---|---|---|---|---|---|
| USD | 0.28% | 0.40% | -1.03% | 0.41% | 1.07% | 0.88% | -0.25% | |
| EUR | -0.28% | 0.11% | -1.30% | 0.13% | 0.78% | 0.50% | -0.57% | |
| GBP | -0.40% | -0.11% | -1.43% | 0.02% | 0.67% | 0.39% | -0.67% | |
| JPY | 1.03% | 1.30% | 1.43% | 1.45% | 2.12% | 1.74% | 0.75% | |
| CAD | -0.41% | -0.13% | -0.02% | -1.45% | 0.63% | 0.28% | -0.69% | |
| AUD | -1.07% | -0.78% | -0.67% | -2.12% | -0.63% | -0.39% | -1.33% | |
| NZD | -0.88% | -0.50% | -0.39% | -1.74% | -0.28% | 0.39% | -0.95% | |
| CHF | 0.25% | 0.57% | 0.67% | -0.75% | 0.69% | 1.33% | 0.95% |
The heat map shows percentage changes of major currencies against each other. The base currency is picked from the left column, while the quote currency is picked from the top row. For example, if you pick the British Pound from the left column and move along the horizontal line to the US Dollar, the percentage change displayed in the box will represent GBP (base)/USD (quote).
The Reuters news agency yesterday published a first survey-based estimate of OPEC's August production: at 26.4 million barrels, the cartel's daily output was 340 thousand barrels lower than in July and thus the lowest level since January, Commerzbank’s commodity analyst Barbara Lambrecht notes.
August OPEC output is the lowest level since January
“The main reason for this was a significant drop in production in Libya of 290 thousand barrels per day. This reflects not only recent production losses, but also the shutdown of the Sharara oil field earlier in the month. Although Libya is an OPEC member, it is not bound by production targets. Quota-bound OPEC members are still producing 220 thousand barrels per day above target, according to the Reuters report, which is still largely due to Iraq.”
“However, OPEC production could fall further in September: First, if Libyan oil production is cut for an extended period of time - on August 28, production was down to just under 600,000 barrels per day, and yesterday "force majeure" was reported for another oil field. And second, if Iraq actually implements the plans it confirmed during the OPEC Secretary General's visit and reduces its production to below 4 million barrels.”
For the first time in months, CTAs could start liquidating Gold in a downtape over the coming week, reinforcing the set-up for our tactical short. Alternative takes on the positioning set-up are of the view that Western money managers can continue to increase their length, underscored by a naked read of CFTC positioning data which suggests speculator positioning is only a touch frothy and well below its historical maximum, TDS commodity analyst Daniel Ghali notes.
Possible CTA selling activity to start over the coming week
“Our advanced positioning analytics, however, provide an edge on this read. Our point of contention: accounting for the leverage context suggests it is already effectively maxed out. CTAs' and risk parity portfolios' positioning is constrained by the leverage environment, which explains why we believe the CFTC data has already effectively reached a local maximum even though it remains below its historical max.”
“Macro fund positioning is also effectively maxed out. This positioning remains statistically consistent with more than 400bps of Fed cuts over the coming year, and is at levels that marked local highs in several previous cycles, followed by drawdowns in the 7%-10% range.”
“With several cohorts simultaneously vulnerable, a continued downtape in Gold can finally start to catalyze CTA selling activity over the coming week, reinforcing our view that the first cohort to blink can snowball subsequent selling activity. After all, we estimate that nearly half of trend followers positions will be liquidated in a revisit towards $2400/oz. Downside risks are now more potent.”
- USD/CAD surges to near 1.3550 as the Canadian Dollar weakens ahead of the BoC policy meeting.
- The US Dollar surrenders its intraday gains with US NFP in focus.
- The US ISM Manufacturing PMI contracted again in August.
The USD/CAD pair climbs to near 1.3550 in Tuesday’s North American session. The Loonie asset gains sharply as the Canadian Dollar (CAD) weakens amid uncertainty ahead of the Bank of Canada’s (BoC) monetary policy meeting, which will be announced on Wednesday.
Investors see the BoC reducing interest rates again by 25 basis points (bps) 4.25%. This would be the third straight interest rate cut in a row due to easing price pressures, economic slowdown, and downside risks to the labor market.
The US Dollar (USD) gives up its intraday gains with investors focusing on the United States (US) Nonfarm Payrolls (NFP) data for August, releasing on Friday, which will influence market speculation for Federal Reserve (Fed) interest rate cuts.
Meanwhile, the US ISM has reported weaker-than-expected Manufacturing PMI data for August. The report showed that activities contracted at a slower pace, with PMI coming in at 47.2, lower than estimates of 47.5 but higher than the former release of 46.8.
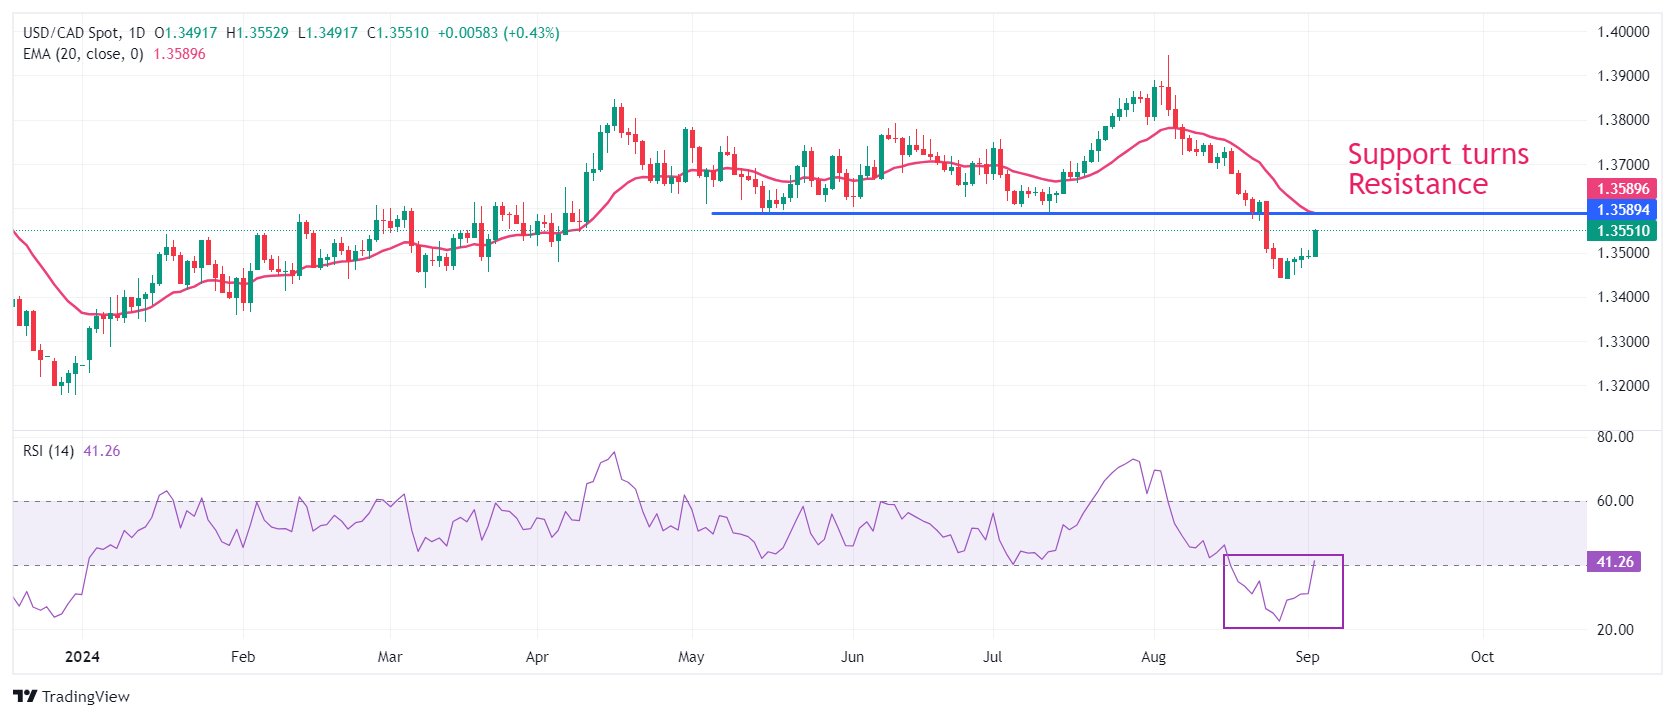
USD/CAD rebounds sharply after a V-shape recovery from a fresh five-month low of 1.3440 on a daily timeframe. The asset is expected to extend its recovery to near the horizontal resistance plotted from May 15 low of 1.3590, which used to be a key support for the US Dollar bulls.
The declining 20-day Exponential Moving Average (EMA) near 1.3590 suggests that the near-term trend is bearish. The 14-day Relative Strength Index (RSI) rebounds sharply after turning oversold near 22.50. The movement suggests that the bearish momentum has ended for now, however, the overall trend is still bearish.
Further pullback May 15 low of 1.3590 will likely be a selling opportunity for market participants, which would drag the asset towards April 5 low of 1.3540, followed by the psychological support of 1.3500.
On the flip side, an upside recovery above August 21 high of 1.3626 would drive the asset towards 19 August high of 1.3687 and August 15 high of 1.3738.
USD/CAD daily chart
Canadian Dollar FAQs
The key factors driving the Canadian Dollar (CAD) are the level of interest rates set by the Bank of Canada (BoC), the price of Oil, Canada’s largest export, the health of its economy, inflation and the Trade Balance, which is the difference between the value of Canada’s exports versus its imports. Other factors include market sentiment – whether investors are taking on more risky assets (risk-on) or seeking safe-havens (risk-off) – with risk-on being CAD-positive. As its largest trading partner, the health of the US economy is also a key factor influencing the Canadian Dollar.
The Bank of Canada (BoC) has a significant influence on the Canadian Dollar by setting the level of interest rates that banks can lend to one another. This influences the level of interest rates for everyone. The main goal of the BoC is to maintain inflation at 1-3% by adjusting interest rates up or down. Relatively higher interest rates tend to be positive for the CAD. The Bank of Canada can also use quantitative easing and tightening to influence credit conditions, with the former CAD-negative and the latter CAD-positive.
The price of Oil is a key factor impacting the value of the Canadian Dollar. Petroleum is Canada’s biggest export, so Oil price tends to have an immediate impact on the CAD value. Generally, if Oil price rises CAD also goes up, as aggregate demand for the currency increases. The opposite is the case if the price of Oil falls. Higher Oil prices also tend to result in a greater likelihood of a positive Trade Balance, which is also supportive of the CAD.
While inflation had always traditionally been thought of as a negative factor for a currency since it lowers the value of money, the opposite has actually been the case in modern times with the relaxation of cross-border capital controls. Higher inflation tends to lead central banks to put up interest rates which attracts more capital inflows from global investors seeking a lucrative place to keep their money. This increases demand for the local currency, which in Canada’s case is the Canadian Dollar.
Macroeconomic data releases gauge the health of the economy and can have an impact on the Canadian Dollar. Indicators such as GDP, Manufacturing and Services PMIs, employment, and consumer sentiment surveys can all influence the direction of the CAD. A strong economy is good for the Canadian Dollar. Not only does it attract more foreign investment but it may encourage the Bank of Canada to put up interest rates, leading to a stronger currency. If economic data is weak, however, the CAD is likely to fall.
- US ISM Manufacturing PMI rose slightly in August.
- US Dollar Index stays in daily range above 101.50.
The business activity in the US manufacturing sector continued to contract, albeit at a softer pace in August, with the ISM Manufacturing PMI edging higher to 47.2 from 46.8 in July. This reading came in slightly below the market expectation of 47.5.
The Employment Index of the PMI recovered to 46 from 43.4 in July, while the New Orders Index fell to 44.6 from 47.4 in the same period. Finally, the Prices Paid Index, the inflation component, rose to 54 from 52.9.
Commenting on the survey's findings, “while still in contraction territory, U.S. manufacturing activity contracted slower compared to last month," said Timothy R. Fiore, Chair of the Institute for Supply Management (ISM) Manufacturing Business Survey Committee. "Demand continues to be weak, output declined, and inputs stayed accommodative."
Market reaction
These figures don't seem to be having a significant impact on the US Dollar's valuation. At the time of press, the US Dollar Index was virtually unchanged on the day at 101.62.
- WTI Oil has fallen to the $70 level as rumors OPEC is preparing to ramp up production lead traders to press sell.
- A slowdown in Chinese demand and weak Manufacturing figures further weigh.
- Mixed US inventory data, Libyan outages and possible Federal Reserve cuts are further factors.
West Texas Intermediate (WTI), the US crude Oil benchmark, is declining sharply into the $70.50s, down over 4.0% on Tuesday, as rumors of OPEC+ production cuts and concerns around slowing China demand weigh on the black gold.
Six sources from inside the Organization of the Petroleum Exporting Countries (OPEC) and its allies recently told Reuters the organization is planning to increase production from October.
“Eight OPEC+ members are scheduled to boost output by 180,000 barrels per day (bpd) in October as part of a plan to begin unwinding their most recent supply cuts of 2.2 million bpd while keeping other cuts in place until the end of 2025,” said Reuters.
The production increases come as OPEC+ struggles to compete with US shale producers. By increasing the output of its members it hopes to push down the price of Oil until it is at or below the cost of production of shale, thereby eroding shale companies’ profit margins.
WTI Oil weakens on slowdown in China demand
WTI Oil is further pressured by a slowdown in demand from China, the largest Oil consumer in the world. The Chinese economy is growing more slowly and recent data showed Chinese manufacturing activity in August hit a six-month low as measured by the official Manufacturing PMI. Although a separate private survey – the Caixin Manufacturing PMI – showed an increase in activity, markets were spooked.
Chinese stocks have seen deep sell-offs recently, with the Shanghai Composite Index losing 11.88% since May 2024, falling from 3181 to 2803 over the period.
According to analysts, China’s economy is undergoing a structural shift which will make it less dependent on Oil in the future, a further headwind for WTI. These structural changes include “fuel-switching to Electric Vehicles (EV) and from Oil to Liquified Natural Gas (LNG),” said Daan Struyven, Head of Research at Goldman Sachs in a recent interview.
Oil inventories and Libyan outages to support
Another factor in the decline in WTI Oil may also be mixed inventory figures reflecting a fluctuation in US demand. The Energy Information Agency (EIA) figures for the week of August 23 showed Oil inventories did not fall as steeply as had been expected and contrasted the API data released on the day before, which showed a deeper-than-expected inventory draw. That said, Oil demand has been high in the US over the summer with eight out of the last nine inventory releases showing a decline in inventories, according to Bloomberg News.
Oil production in Libya was halted on Monday amid the ongoing conflicts between various factions in the country. Exports were halted at major Libyan ports according to Reuters, as a standoff between rival political factions over control of the central bank and Oil revenue disrupted supply.
Last week one of the factions, the Libyan National Army (LNA) closed down the Sarir Oil field in protest at the Libyan government’s sacking of the Governor of the Central Bank of Libya (CBL), Sadiq al-Kabir. Production at the El Feel Oil field was also halted from Monday.
Yet, Libyan Oil supply disruption has provided little support for WTI prices.
“The current disturbances in Libya's oil production could provide room for added supply from OPEC+. But these fluctuations have become quite normal over the last few years, meaning any outages will probably be short-lived; with the news flow indicating signals for a restart of production have already been given," said Bjarne Schieldrop, chief commodity analyst at SEB.
Impact of Federal Reserve
WTI Oil could be impacted by the decisions of the Federal Reserve (Fed) as they contemplate cutting interest rates in the US amid a slowdown in inflation.
Markets are currently debating whether the Fed will need to make a 50 basis point (bps) cut to interest rates in September or just a standard 25 bps cut. The latter is fully expected whilst market-based probabilities for the former sit currently at around 30%, according to the CME FedWatch Tool. A larger cut in interest rates would be bullish for WTI Oil as it would decrease the opportunity cost of holding the non interest-paying asset.
Whether or not the Fed makes a larger 50 bps cut or not could depend on US labor market data out this week. At a pivotal speech in Jackson Hole, the Fed Chairman Jerome Powell said the downside risks to employment were now greater than upside risks to inflation.
If labor market data out this week, in the form of JOLTS Job Openings, ADP Employment Change, Jobless Claims, ISM Services Employment Index, and Nonfarm Payrolls (NFP) on Friday, come out weaker than expected, backing up Powell’s concerns, it will probably lead the Fed to make a bigger half a percent cut, causing a tumble in the US Dollar (USD) and a recovery in WTI Oil.
Gold prices eased slightly at the start of the week and are currently trading around $2500 an ounce. Gold is still on hold ahead of Friday's US Nonfarm Payrolls report, Commerzbank’s commodity analyst Volkmar Baur notes.
Gold may fall further
“If the report comes in as expected by most analysts according to the Bloomberg survey, Gold could fall further. The futures market is still pricing in a roughly 30% chance that the Fed will cut rates by 50 basis points in September.”
“However, if the report shows, as expected, that the labor market continues to cool but not collapse, this probability should be priced out. On the other hand, if the US jobs report is significantly weaker, speculation about a US recession and faster rate cuts will resurface, further supporting Gold. One day after the US employment report, China will also release data on its foreign exchange reserves.”
“As it has been reported several times in recent months that the Chinese central bank has stopped importing Gold, an increase in Gold reserves would be a surprise that would also support the price of Gold. However, this is unlikely to happen.”
The Euro (EUR) is drifting lower, in line with the broader recovery in the US Dollar (USD), Scotiabank’s Chief FX Strategist Shaun Osborne notes.
Scope for some further, corrective losses in the EUR
“The EUR itself is facing the risk of another rate cut from the ECB soon (25bps is priced in for the September 12th meeting). But a Reuters report yesterday highlighted divisions among ECB policymakers on the outlook thereafter, with some growing more concerned about recession amid weakening activity in Germany, and others more concerned about stubborn inflationary pressures.”
“A more cautious ECB into the end of the year suggests that EUR losses may not extend too far in the short run. EUR/USD has given back a little more than a third of the August rally and looks poised to cede a bit more ground in the short run at least.”
“A low close on the week through last Friday saw a bearish ‘dark cloud cover’ weekly candle signal develop which suggests scope for some further, corrective losses in the EUR. Support is 1.0990 and (stronger) at 1.0920/40. Resistance is 1.1070/75.”
The Canadian Dollar (CAD) is losing ground in line with the core majors so far today and is outperforming its commodity cousins (AUD and NZD) by a fair margin as a result, Scotiabank’s Chief FX Strategist Shaun Osborne notes.
CAD slips as recovery momentum fades
“The CAD rally has run out of momentum as short-covering demand has faded, for now at least. Markets are focused on developments in the US primarily this week but there is also some significant calendar risk ahead for the CAD—even though the Bank of Canada policy decision tomorrow is widely expected to result in a 25bps cut in the Bank’s 4.50% target rate.”
“A dovish-leaning statement and press conference will support market expectations that rates will continue to fall over the balance of the year (swaps imply a further 50bps of easing is expected beyond this week’s decision).”
“Corrective USD gains are liable to extend to the mid/upper 1.35s in the short run at least. A bullish ‘hammer’ signal on the weekly charts through last Friday suggest the risk of a more significant USD rebound is not to be excluded in the next few weeks. Firmer USD resistance may develop in the mid/upper 1.36s. Support is 1.35000/05.”
- USD/JPY drops sharply to near 146.00 as BoJ Ueda delivers hawkish interest rate guidance.
- BoJ Ueda reiterated the need to raise interest rates further this year.
- The Fed is now more focused on controlling downside risks to the US labor market.
The USD/JPY pair falls sharply to near 146.00 in Tuesday’s North American session. The asset faces selling pressure as the Japanese Yen (JPY) strengthens after Bank of Japan (BoJ) Governor Kazuo Ueda’s hawkish commentary on interest rates.
Kazuo Ueda reiterated in a document submitted to a government panel on Tuesday that the central bank won’t hesitate to raise interest rates further if the economy and inflation perform as expected, Reuters reported. Inflationary pressures in the Japanese economy continue to remain stubborn. Tokyo Consumer Price Index (CPI), excluding Fresh Food, released on Thursday, rose at a faster pace to 2.4% in August from estimates and July’s release of 2.2%.
USD/JPY remains on the backfoot despite further upside in the US Dollar (USD). The US Dollar Index (DXY), which tracks the Greenback’s value against six major currencies, rises towards a two-week high of 102.00.
The US Dollar gains as investors turn cautious ahead of the United States (US) Nonfarm Payrolls (NFP) data for August, which will be published on Friday. Market participants will keenly focus on the official labor market data as the Federal Reserve (Fed) is now more focused on preventing labor demand, given that officials are confident about price pressures returning sustainably to the bank’s target of 2%.
In today’s session, investors will focus on the US ISM Manufacturing PMI data for August, which will be published at 14:00 GMT. Economists expect that activities in the manufacturing sector contracted at a slower pace, with the PMI coming in at 47.5 from July’s reading of 46.8.
Japanese Yen FAQs
The Japanese Yen (JPY) is one of the world’s most traded currencies. Its value is broadly determined by the performance of the Japanese economy, but more specifically by the Bank of Japan’s policy, the differential between Japanese and US bond yields, or risk sentiment among traders, among other factors.
One of the Bank of Japan’s mandates is currency control, so its moves are key for the Yen. The BoJ has directly intervened in currency markets sometimes, generally to lower the value of the Yen, although it refrains from doing it often due to political concerns of its main trading partners. The current BoJ ultra-loose monetary policy, based on massive stimulus to the economy, has caused the Yen to depreciate against its main currency peers. This process has exacerbated more recently due to an increasing policy divergence between the Bank of Japan and other main central banks, which have opted to increase interest rates sharply to fight decades-high levels of inflation.
The BoJ’s stance of sticking to ultra-loose monetary policy has led to a widening policy divergence with other central banks, particularly with the US Federal Reserve. This supports a widening of the differential between the 10-year US and Japanese bonds, which favors the US Dollar against the Japanese Yen.
The Japanese Yen is often seen as a safe-haven investment. This means that in times of market stress, investors are more likely to put their money in the Japanese currency due to its supposed reliability and stability. Turbulent times are likely to strengthen the Yen’s value against other currencies seen as more risky to invest in.
A big week lies ahead for markets. There is plenty of US data to work through but the NFP update at the end of the week is the primary focus for traders looking for guidance on how aggressive a widely expected Fed rate cut on September 18th will be, Scotiabank’s Chief FX Strategist Shaun Osborne notes.
Last week’s USD rebound develops ahead of NFP data
“The US Dollar (USD) rebound that got underway last week has extended a little today after a quiet session Monday while North America was out. USD short-covering is the primary motivation behind USD gains, although the risk backdrop does look soft today amid broad losses in global stocks. Fed rate cut expectations have not changed—swaps still reflect the risk that the Fed cuts by more than 25bps at next week’s meeting and continue to price in 100bps of cuts over the remainder of the year.”
“Short-term rate spreads moved significantly back in the USD’s favour. The situation leaves the DXY looking moderately overvalued, based on weighted 2Y interest rate differentials, according to my model. The charts do suggest there is a chance that the DXY rebound extends a little more after last week’s firm (technically bullish) close, however. Over the longer run, lower US interest rates and slowing growth momentum are likely to weigh on the USD.”
“On the session so far, the USD is notching up gains against most of the majors, with the exception of the JPY and MXN. The JPY is outperforming broadly after BoJ Governor Ueda submitted a report to the government reiterating that the central bank will tighten rates further if the economy develops as anticipated. Doubts around further BoJ tightening steps arose following the volatile reaction to the July rate hike.”
- GBP/MXN has formed a bullish Pennant pattern with an upside target in the 27.00s.
- The pair is in an uptrend within a rising channel with odds favor a continuation higher.
GBP/MXN has formed a bullish Pennant continuation pattern during its uptrend within a rising channel.
The pattern indicates that a breakout higher would probably lead to substantial further gains, probably all the way up to the upper channel line of the ascending channel.
GBP/MXN Daily Chart
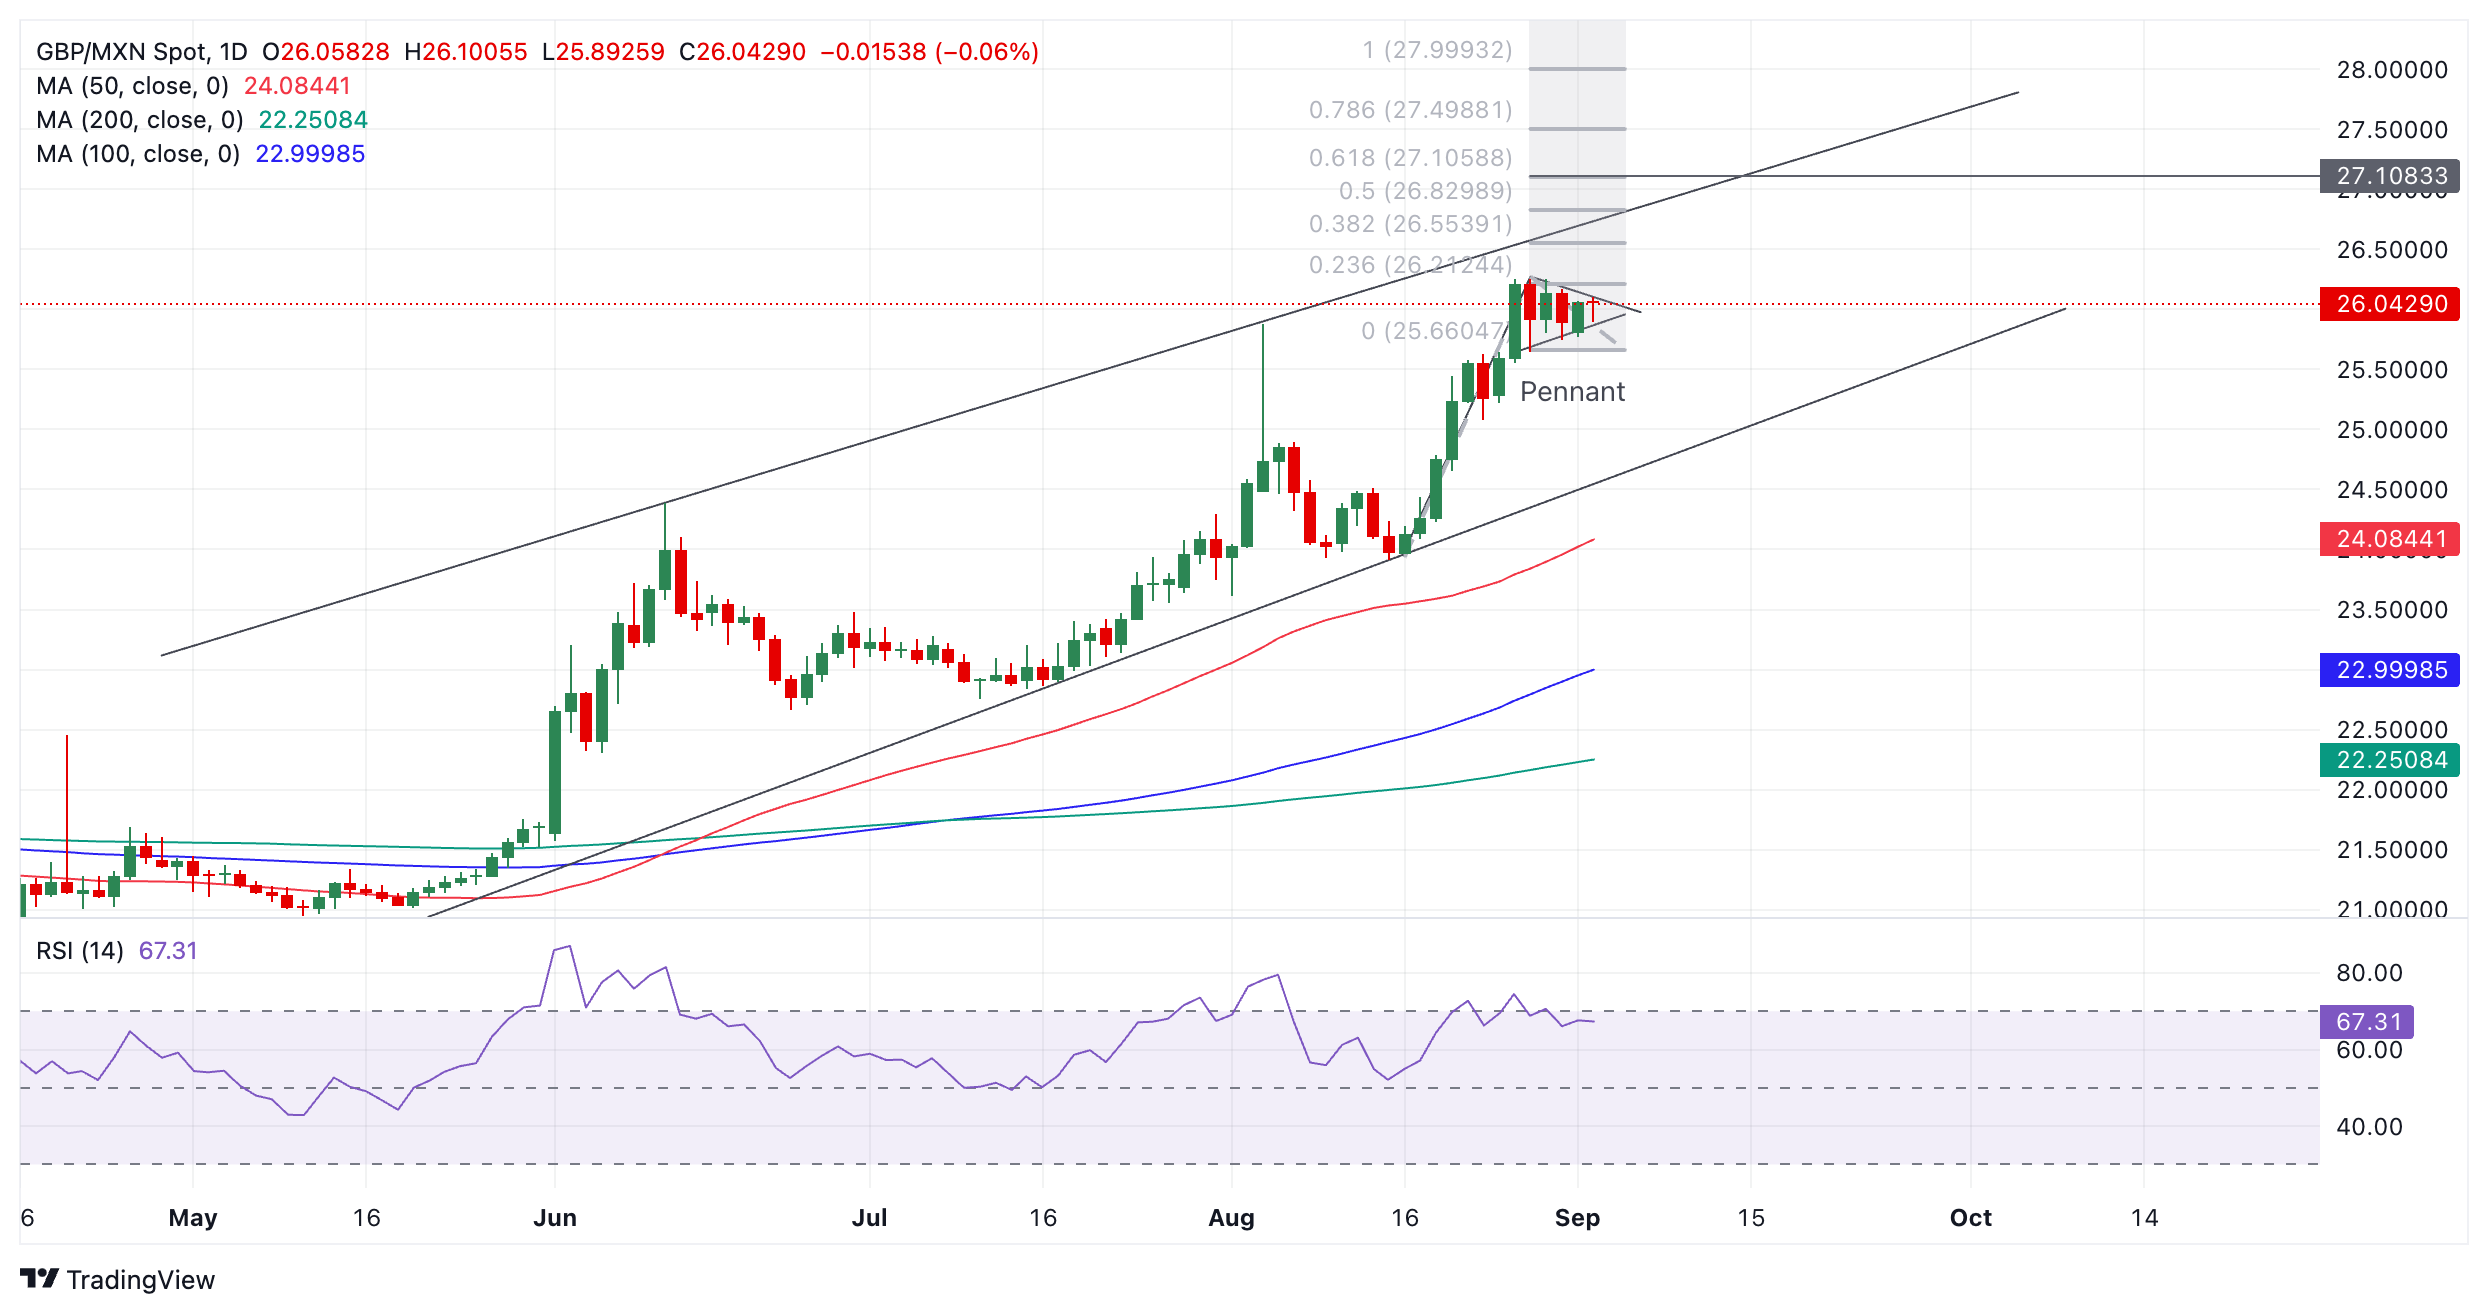
The Pennant probably began at the August 16 low, with the long line of up days during the second half of August comprising the pattern’s “pole” with the actual triangular “pennant” currently unfolding.
A break above the top of the pattern at 26.25 would confirm a continuation higher to a conservative target at the 0.618 ratio of the length of the pole extrapolated higher. This suggests an upside target at 27.11.
The Relative Strength Index (RSI) momentum indicator is below the overbought level, suggesting the pair has more upside potential before it becomes overbought again.
- USD/CHF has formed a new uptrend after reversing higher following the August 29 low.
- The RSI has exited overbought, indicating a risk of a pull back developing within the uptrend.
USD/CHF has been recovering since bottoming out at the August 29 lows. The pair kicked off the uptrend with a bullish Three White Soldiers Japanese candlestick pattern right after the August 29 bottom. This occurs when three green candlesticks of a similar size follow a new low.
USD/CHF has probably now started a new uptrend and since “the trend is your friend” the odds favor more upside.
USD/CHF 4-hour Chart
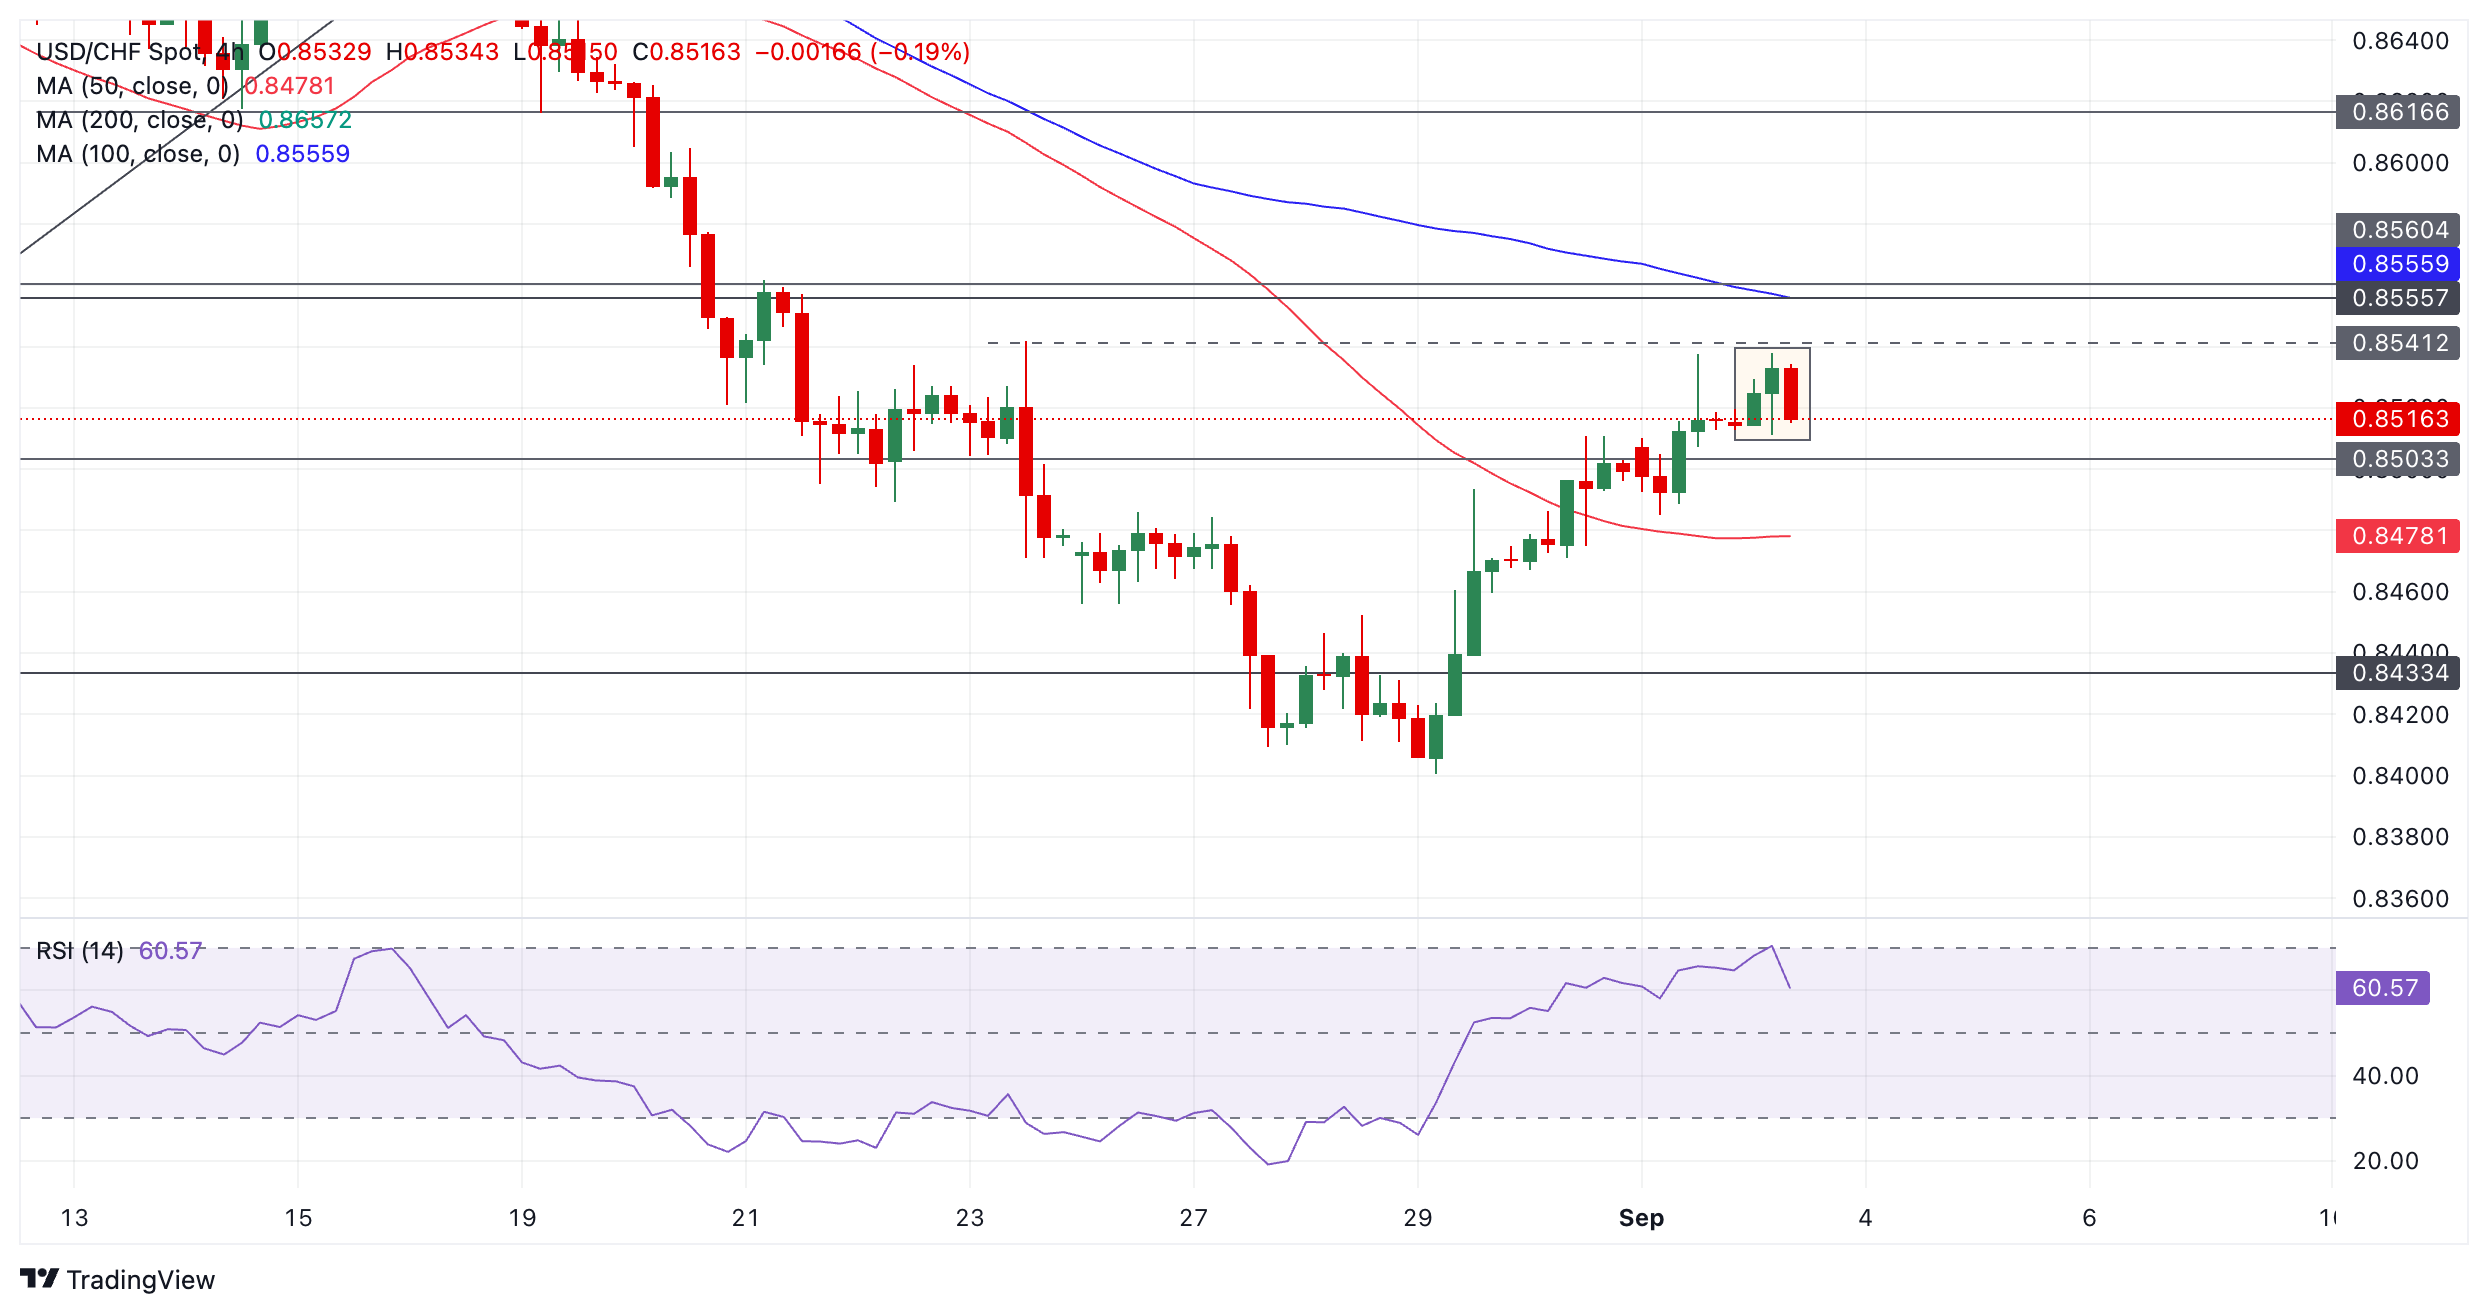
There is a risk USD/CHF could temporarily pull back before it continues higher, however, as the Relative Strength Index (RSI) momentum indicator has just exited overbought territory. This provides a signal that the trend is likely to correct or reverse.
The RSI exiting overbought was accompanied by the formation of a bearish Hanging Man Japanese candlestick pattern (shaded rectangle). The current candle is red and looking like it will probably end as a down candle, adding confirmation to the Hanging Man.
If a correction unfolds it will probably pull back down to support at either 0.8503 or 0.8485.
The dominant short-term uptrend is likely to eventually resume, however, and take the price back up. A break above 0.8541 (August 23 high) would see resistance at 0.8557 come into view, followed by 0.8617 if the uptrend proves strong.
- The US Dollar trades slightly in the green against almost every major currency.
- US markets open up after the Labor Day holiday and gear up for ISM PMI data.
- The US Dollar Index has an important resistance level within reach for a breakout.
The US Dollar (USD) trades broadly stable on Tuesday as it officially starts its trading week after US markets were closed on Monday for Labor Day. The Greenback is slightly up against almost every major currency on the quote board, except for the Japanese Yen (JPY). Meanwhile, markets tremble a little bit on the back of news that German car maker Volkswagen is considering closing factories in its home country for the first time ever, which is a massive blow to the German government and the European economy.
Tuesday’s economic calendar features the Institute for Supply Management (ISM) Manufacturing survey for August. Traders will get to see how the US manufacturing sector is holding up. Seeing the recent headlines out of Germany, a clear split between the two nations could drive the DXY higher.
Daily digest market movers: Catching up after the holiday
- At 13:45 GMT, S&P Global will release its final Manufacturing number from the Purchasing Managers Index for August. The preliminary reading stood at 48 and it isn’t expected to be revised.
- At 14:00 GMT, the Institute for Supply Management (ISM) will release its Manufacturing numbers for August:
- The headline PMI is expected to head to 47.5 from 46.8.
- The Prices Paid component should head to 52.5 from 52.9.
- The New Orders index stood at 47.4 in July, and the Employment Index was at 43.4.
- Apart from the ISM, the TechnoMetrica Institute of Policy and Politics (TIPP) will release its economic Optimism survey for September. The previous reading was at 44.5 with 46.2 expected.
- Equities are struggling across the board, with minor losses for all European indices and US futures on the back foot as well.
- The CME Fedwatch Tool shows a 69.0% chance of a 25 basis points (bps) interest rate cut by the Fed in September against a 31.0% chance for a 50 bps cut. Another 25 bps cut (if September is a 25 bps cut) is expected in November by 49.9%, while there is a 41.5% chance that rates will be 75 bps (25 bps + 50 bps) below the current levels and an 8.6% probability of rates being 100 (25 bps + 75 bps) basis points lower.
- The US 10-year benchmark rate trades at 3.90%, slightly down on the day after opening at 3.93%.
Economic Indicator
ISM Manufacturing PMI
The Institute for Supply Management (ISM) Manufacturing Purchasing Managers Index (PMI), released on a monthly basis, is a leading indicator gauging business activity in the US manufacturing sector. The indicator is obtained from a survey of manufacturing supply executives based on information they have collected within their respective organizations. Survey responses reflect the change, if any, in the current month compared to the previous month. A reading above 50 indicates that the manufacturing economy is generally expanding, a bullish sign for the US Dollar (USD). A reading below 50 signals that factory activity is generally declining, which is seen as bearish for USD.
Read more.Next release: Tue Sep 03, 2024 14:00
Frequency: Monthly
Consensus: 47.5
Previous: 46.8
Source: Institute for Supply Management
The Institute for Supply Management’s (ISM) Manufacturing Purchasing Managers Index (PMI) provides a reliable outlook on the state of the US manufacturing sector. A reading above 50 suggests that the business activity expanded during the survey period and vice versa. PMIs are considered to be leading indicators and could signal a shift in the economic cycle. Stronger-than-expected prints usually have a positive impact on the USD. In addition to the headline PMI, the Employment Index and the Prices Paid Index numbers are watched closely as they shine a light on the labour market and inflation.
US Dollar Index Technical Analysis: Next step
The US Dollar Index (DXY) is at a crossroads this Tuesday, when the ISM numbers might be moving the DXY either above a pivotal resistance or trigger a firm rejection and send it back down. Expect to see a very whipsaw DXY on the charts this week with nearly every trading day bearing substantial economic data points.
Looking up, 101.90 is very close and could easily be broken should ISM come in stronger. A steep 2% uprising would be needed to get the index to 103.18. A very heavy resistance level near 104.00 not only holds a pivotal technical value, but it also bears the 200-day Simple Moving Average (SMA) as the second heavyweight to cap price action.
On the downside, 100.62 (the low from December 28) holds as support, although it looks rather feeble. Should it break, the low from July 14, 2023, at 99.58 will be the ultimate level to look out for. Once that level gives way, early levels from 2023 are coming in near 97.73.
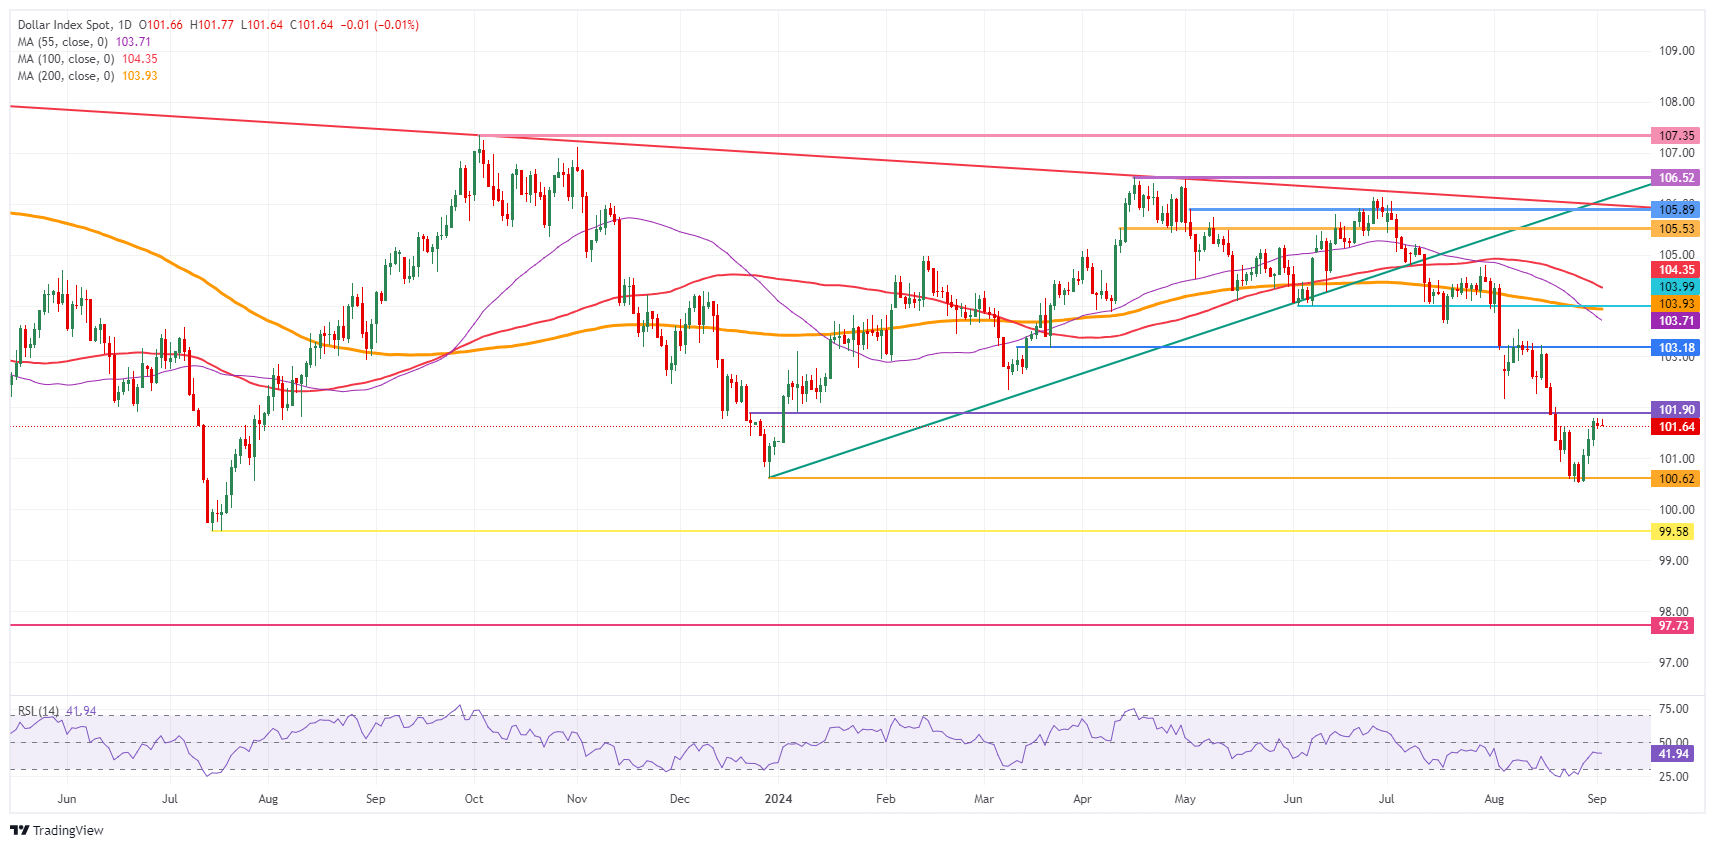
US Dollar Index: Daily Chart
US Dollar FAQs
The US Dollar (USD) is the official currency of the United States of America, and the ‘de facto’ currency of a significant number of other countries where it is found in circulation alongside local notes. It is the most heavily traded currency in the world, accounting for over 88% of all global foreign exchange turnover, or an average of $6.6 trillion in transactions per day, according to data from 2022. Following the second world war, the USD took over from the British Pound as the world’s reserve currency. For most of its history, the US Dollar was backed by Gold, until the Bretton Woods Agreement in 1971 when the Gold Standard went away.
The most important single factor impacting on the value of the US Dollar is monetary policy, which is shaped by the Federal Reserve (Fed). The Fed has two mandates: to achieve price stability (control inflation) and foster full employment. Its primary tool to achieve these two goals is by adjusting interest rates. When prices are rising too quickly and inflation is above the Fed’s 2% target, the Fed will raise rates, which helps the USD value. When inflation falls below 2% or the Unemployment Rate is too high, the Fed may lower interest rates, which weighs on the Greenback.
In extreme situations, the Federal Reserve can also print more Dollars and enact quantitative easing (QE). QE is the process by which the Fed substantially increases the flow of credit in a stuck financial system. It is a non-standard policy measure used when credit has dried up because banks will not lend to each other (out of the fear of counterparty default). It is a last resort when simply lowering interest rates is unlikely to achieve the necessary result. It was the Fed’s weapon of choice to combat the credit crunch that occurred during the Great Financial Crisis in 2008. It involves the Fed printing more Dollars and using them to buy US government bonds predominantly from financial institutions. QE usually leads to a weaker US Dollar.
Quantitative tightening (QT) is the reverse process whereby the Federal Reserve stops buying bonds from financial institutions and does not reinvest the principal from the bonds it holds maturing in new purchases. It is usually positive for the US Dollar.
According to press reports, Turkish President Recep Tayyip Erdogan is seeking to have his country accepted into the group of BRICS states. This group of currently nine states (Brazil, Russia, India, China, South Africa, Egypt, Ethiopia, Iran, UAE) has no formal admission process, but I could well imagine that Turkey would be welcomed with open arms, Commerzbank’s Head of FX and Commodity Research Ulrich Leuchtmann notes.
Turkey's deficit current account needs constant financing
“With China, Russia and the UAE, three of the economies with particularly high current account surpluses are BRICS members. And because Turkey's notoriously deficit current account needs constant financing, it may seem favorable from Erdogan's point of view not to make the necessary capital inflow dependent on whether profit-oriented lenders consider his country an attractive target for capital flows from an economic point of view.”
“I think Turkey is an economy with extraordinary potential. It should, under normal circumstances, generate an environment in which capital providers line up to invest there. If the government has legitimate concerns about the stability of capital inflows, then these are due entirely to problems of its own making, in particular years of inappropriate monetary policy that have driven inflation to dizzying heights, forcing the central bank to respond with extremely high interest rates.”
“In an ideal world, a government would feel compelled by hesitant lenders to switch to a credible, lasting fight against inflation. Any attempt by Erdogan to secure capital inflows is also an attempt to avoid this step. This may enable the financing of the current account deficits for a long time; it does not bring Turkish politics any closer to a truly sustainable solution.”
Yesterday's PMI numbers showed slight signs of improvement in industrial sentiment for August in most countries, but still across the board remains well below the 50p threshold. At the same time, Turkey's second-quarter GDP delivered a negative surprise pointing to weakening momentum, ING’s FX strategist Frantisek Taborsky notes.
Markets are back in full mode after the US holiday
“This morning saw the release of the 2Q GDP breakdown in Hungary and later today we will see second-quarter wages in the Czech Republic, which we see rising 4.2% YoY in real terms, slightly below market expectations, while the Czech National Bank (CNB) expects 4.6%. This could be the first time in a while that a data print will have the attention of the CNB and could bring some volatility to the summer stable market levels.”
“Also today, in Turkey, we expect inflation to drop again from 61.8% to 51.8% YoY, which is also the market's consensus, mainly due to the base effect and weaker food price growth. After the US holiday, the markets are back in full mode and we maintain our bias from yesterday for CEE FX.”
“PLN saw the biggest gains within the region following continued repricing up in the rates space ahead of Wednesday's National Bank of Poland meeting. We think there is more to come here plus EUR/USD showed some reversal limiting the negative impact from the previous days. Hence, we continue to be bullish on PLN but also CZK heading below 25.00 EUR/CZK.”
USD/SGD rebounded, in line with our caution, OCBC FX strategists Frances Cheung and Christopher Wong note.
Further rebound not ruled out
“Move higher tracked broad US Dollar (USD) rebound. Pair was last at 1.3090 levels. Daily momentum turned mild bullish while RSI rose. Rebound is underway. Resistance at 1.3130/60 levels (21 DMA, 23.6% fibo retracement of 2024 high to low).”
“Support at 1.30 (recent low). Further rebound not ruled out as markets adjust/ reduce shorts ahead of key data risks – US labour market. S$NEER was last estimated at ~1.87% above our model-implied mid.”
- The Mexican Peso trades slightly higher in its key pairs but remains in a firm downtrend overall.
- The passage of constitutional reforms as they are debated might provide volatility for MXN going forward.
- USD/MXN pauses within an uptrend inside a rising channel.
The Mexican Peso (MXN) trades marginally higher in its key pairs on Tuesday during the European session as a mood of calm pervades markets, which mildly benefits the risk-on Peso. Despite the temporary uplift, MXN’s overall trend remains down and looks likely to continue.
Mexican Peso traders eye possible volatility from constitutional reforms
Mexican Peso traders will be eyeing the passage of a controversial set of reforms to the constitution, involving the way judges are elected, which are scheduled to be debated in Mexico’s Congress on Tuesday and Wednesday, according to Reuters. Concerns around these reforms have weighed on financial markets in the past, and similar weakness is expected if they are eventually voted through and implemented.
Mexico’s Morena-led Government has more than the two-thirds majority in the lower house, which should enable them to vote the proposed reforms through. However, they are a vote short of a majority in the Senate, so there remains some uncertainty about whether they will pass into law immediately.
The reforms have been heavily criticized for undermining the rule of law and democracy although their defenders argue they will help fight the influence the criminal cartels have over the justice system. From a financial perspective, they run the risk of leading to a decline in foreign investment. This, in turn, would reduce demand for the Peso, leading to a further depreciation of the currency.
On the economic data front, the Mexican Jobless Rate for July and Gross Fixed Investment for June are scheduled for release on Tuesday.
Recent Mexican macro data has been mixed, with the S&P Global Mexico Manufacturing Purchasing Managers Index (PMI) falling to 48.5 in August from 49.6 in July, and marking its lowest level in two years. Business Confidence, however, rose by two basis points to 53.2 in August.
At the time of writing, one US Dollar (USD) buys 19.79 Mexican Pesos, EUR/MXN trades at 21.87, and GBP/MXN at 25.96.
Technical Analysis: USD/MXN consolidates within uptrend
USD/MXN pauses within an uptrend inside a broader rising channel. Given that “the trend is your friend”, the odds favor an upside break, eventually taking the pair to new highs.
USD/MXN Daily Chart
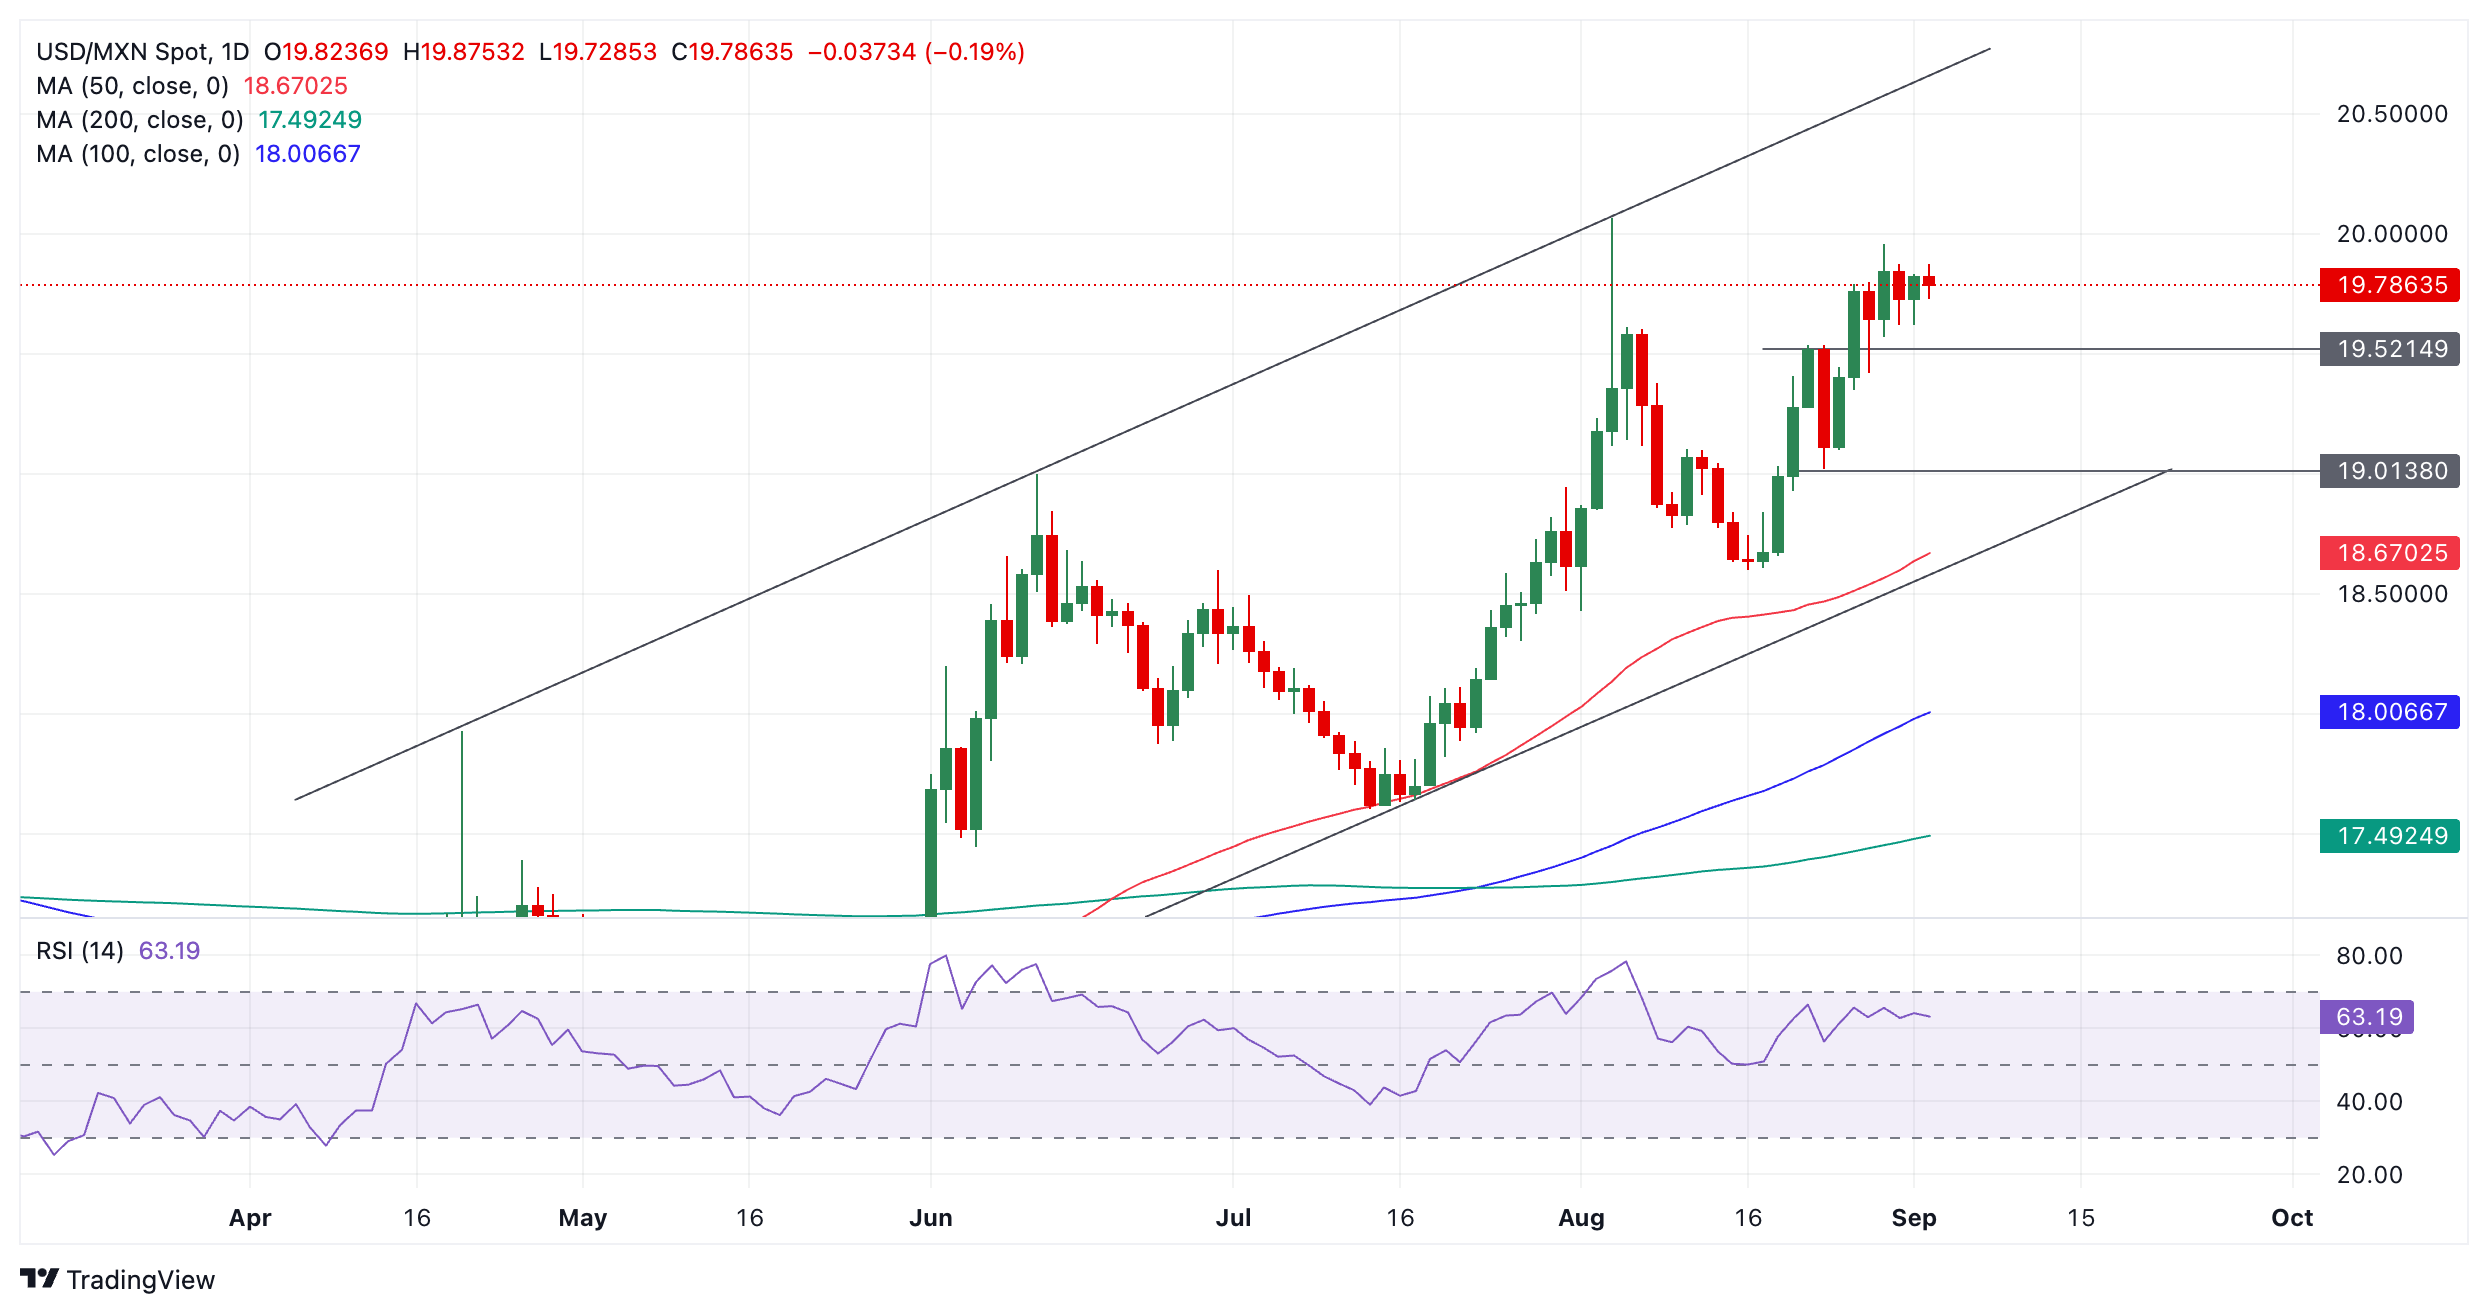
A close above 19.96 (August 29 high) would probably see a continuation of the bull trend, with the next target at the upper channel line in the 20.60s.
Economic Indicator
Jobless Rate
The Jobless Rate released by INEGI is the number of unemployed workers compared to all the active workers in the economy. If the number rises, it indicates a lack of expansion within the Mexican labor market and thus a weakening in the economy. Normally, a decrease in the figure is seen as positive (or bullish) for the Mexican Peso, while an increase is seen as negative (or bearish).
Read more.Next release: Tue Sep 03, 2024 12:00
Frequency: Monthly
Consensus: 2.9%
Previous: 2.8%
Source: National Institute of Statistics and Geography of Mexico
- Silver price falls sharply to near $28.20 as the US Dollar rises further.
- Traders remain split over the Fed’s potential rate cut size in the September meeting.
- Investors await the US Manufacturing PMI data for August.
Silver price (XAG/USD) extends its losing spree for the third trading session on Tuesday. The white metal declines to near $28.20 as the US Dollar (USD) rises further amid uncertainty ahead of a slew of United States (US) economic data this week.
The US Dollar Index (DXY), which tracks the Greenback’s value against six major currencies, rises toward fresh two-week high of 102.00.
Investors keenly await the US Nonfarm Payrolls (NFP) data for August, releasing on Friday, as it will influence market speculation for the likely size of interest rate cut by the Federal Reserve (Fed) in the September meeting.
The Fed is widely anticipated to start reducing interest rates this week but traders are divided on whether the central bank will kick-off the policy-easing cycle gradually or aggressively. Apart from the US NFP report, investors will also focus on the JOLTS Job Openings data for July and the ADP Employment Change data for August, which will be published on Wednesday and Thursday, respectively, that will provide fresh cues on current labor market status.
In today’s North American session, investors will focus on the US ISM Manufacturing PMI data for August, which will be published at 14:00 GMT. The US Manufacturing PMI is estimated to have improved to 47.5 from July’s reading of 46.8 but a figure below 50.0 is itself considered as contraction.
Silver technical analysis
Silver price weakens after a breakdown of the Head and Shoulder chart pattern on a four-hour timeframe, whose neckline is plotted near $28.80. Declining 20-period Exponential Moving Average (EMA) near $28.80 suggests that the near-term trend is bearish.
The 14-period Relative Strength Index (RSI) shifts into the bearish range of 20.00-40.00, suggesting a strong bearish momentum.
Silver four-hour chart
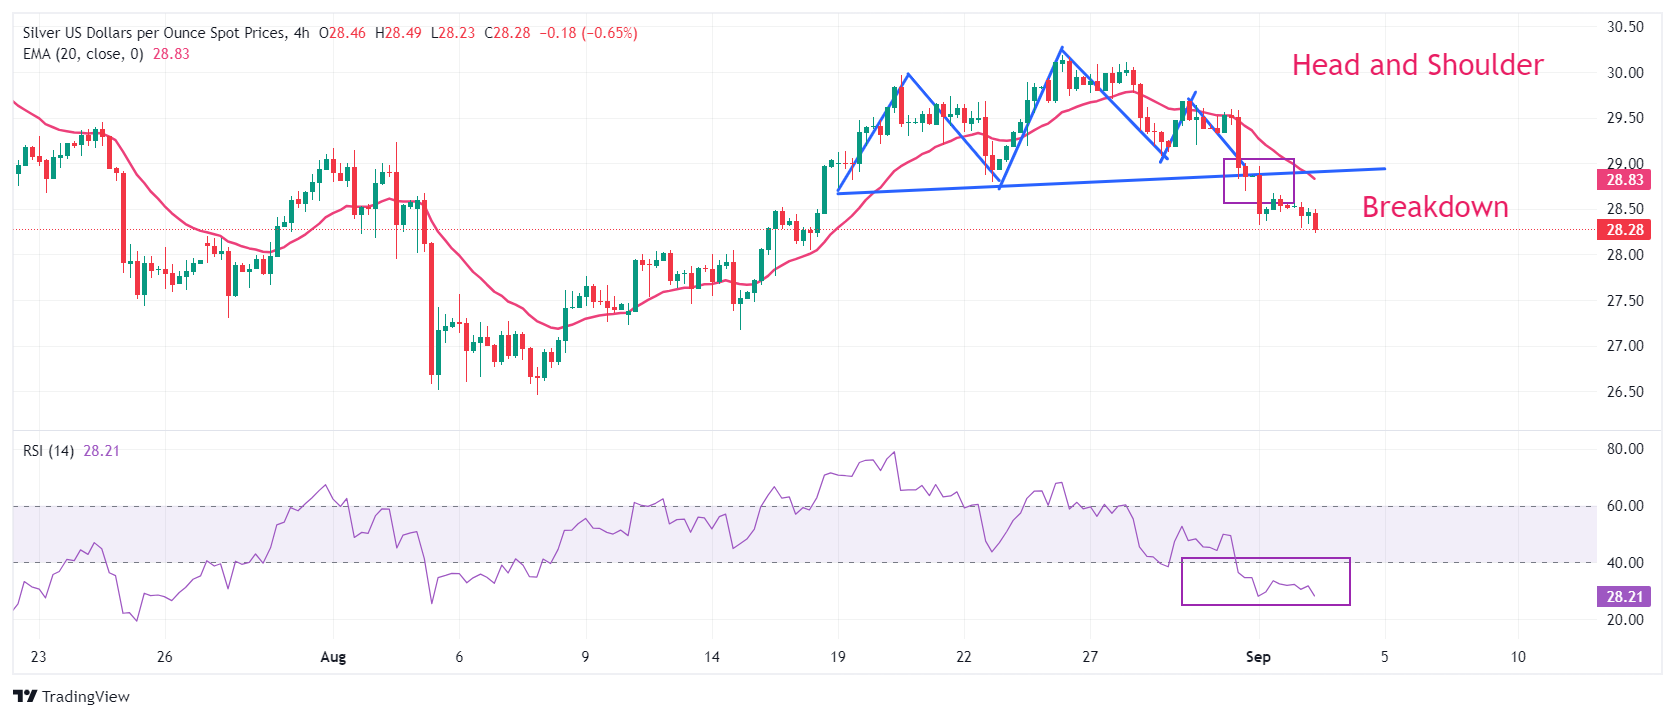
Silver FAQs
Silver is a precious metal highly traded among investors. It has been historically used as a store of value and a medium of exchange. Although less popular than Gold, traders may turn to Silver to diversify their investment portfolio, for its intrinsic value or as a potential hedge during high-inflation periods. Investors can buy physical Silver, in coins or in bars, or trade it through vehicles such as Exchange Traded Funds, which track its price on international markets.
Silver prices can move due to a wide range of factors. Geopolitical instability or fears of a deep recession can make Silver price escalate due to its safe-haven status, although to a lesser extent than Gold's. As a yieldless asset, Silver tends to rise with lower interest rates. Its moves also depend on how the US Dollar (USD) behaves as the asset is priced in dollars (XAG/USD). A strong Dollar tends to keep the price of Silver at bay, whereas a weaker Dollar is likely to propel prices up. Other factors such as investment demand, mining supply – Silver is much more abundant than Gold – and recycling rates can also affect prices.
Silver is widely used in industry, particularly in sectors such as electronics or solar energy, as it has one of the highest electric conductivity of all metals – more than Copper and Gold. A surge in demand can increase prices, while a decline tends to lower them. Dynamics in the US, Chinese and Indian economies can also contribute to price swings: for the US and particularly China, their big industrial sectors use Silver in various processes; in India, consumers’ demand for the precious metal for jewellery also plays a key role in setting prices.
Silver prices tend to follow Gold's moves. When Gold prices rise, Silver typically follows suit, as their status as safe-haven assets is similar. The Gold/Silver ratio, which shows the number of ounces of Silver needed to equal the value of one ounce of Gold, may help to determine the relative valuation between both metals. Some investors may consider a high ratio as an indicator that Silver is undervalued, or Gold is overvalued. On the contrary, a low ratio might suggest that Gold is undervalued relative to Silver.
The UK calendar is very quiet this week, and we expect the pound to move in line with global risk sentiment dynamics, ING’s FX strategist Francesco Pesole notes.
GBP is awaiting the catalyst for the next big move
“Today, Bank of England MPC member Sarah Breeden speaks at an event on supervisory cooperation, so may not touch upon monetary policy. She has been standing on the neutral side of the hawk-dove spectrum and voted in line with the MPC majority at all meetings.”
“EUR/GBP is probably awaiting the catalyst for the next big move: either a break below the 0.8380 lows for the year or a return to the 0.85 area. We have generally seen more arguments for EUR/GBP to ultimately move back higher over the past few months.”
“We admit that the BoE or UK data have not offered strong reasons for a material retightening in EUR:GBP rate spreads, meaning the risks are probably quite balanced for the pair in the near term.”
The Australian Dollar (AUD) was a touch softer this morning after net exports came in softer, current account deficit widened, OCBC FX strategists Frances Cheung and Christopher Wong note.
AUD set to break below 0.6730
“This added to suspicion that 2Q GDP print tomorrow (930am SGT release) may be skewed to the downside. Meanwhile further decline in iron ore futures to 20- month low further undermined AUD.”
“Pair was last at 0.6732 levels. Bullish momentum on daily chart is fading while RSI fell. Corrective pullback is underway. Support at 0.6730, 0.6660. Resistance at 0.6830, 0.6870. Focus this week on 2Q GDP (Wed). A softer print should see AUD come under pressure.
EUR/USD found some backing yesterday and given that part of its weakness at the end of August was likely due to month-end flows, support levels may prove sturdier at the start of September. Incidentally, a 2-year EUR:USD spread at -100bp is still some 20-25bp tighter than the end of July, and continues to offer a technical counterargument to bearish bets on EUR/USD, ING’s FX strategist Francesco Pesole notes.
EUR/USD to hold above 1.10 short term
“Some of those bearish bets are related to the stagnant economic situation in Germany, but it seems that investors were rapidly reassured of the political situation after all other German parties appeared determined to keep the far-right AfD away from power after their win in Thuringia.”
“At the same time, the ruling coalition appears increasingly weak, and we cannot exclude some damage to the Euro from EU politics down the road. Especially when adding a likely turbulent EU budget season this fall.”
“For now, those like us seeing EUR/USD holding above 1.10 will be happy with some support ahead of key US data later this week. In the eurozone, the data calendar is empty today, and the only scheduled ECB speaker is German hawk Joachim Nagel.”
The Euro (EUR) traded little changed overnight. Last seen at 1.1040 levels, OCBC FX strategists Frances Cheung and Christopher Wong note.
EUR/USD to trade below 1.1040
“Daily momentum is mild bearish while RSI fell. Support at 1.1040 (21 DMA), 1.10, 1.0930 (61.8% fibo retracement of 2024 high to low). Resistance at 1.12 (recent high) and 1.1280 (2023 high).”
“Slippage in CPIs out of Euroarea, Germany and Spain and softer mfg PMI print added to expectation that ECB may lower rate again at its upcoming meeting on 12 Sep. Markets have priced in nearly 25bp cut at this meeting and about 37bp cut for remainder of the year (another 1.5 cut).”
“Another series of underwhelming data print could move the needle for markets to price in a more dovish ECB and for the EURO to trade lower. This week, focus is on services PMI, PPI (Wed), retail sales (Thu) and GDP (Fri).”
Currency volatility should pick up today as US markets re-open after the long Labour Day weekend and data releases take over. The big event of the day is the ISM manufacturing index in the US. Remember this has been in contraction territory (i.e. below 50) every month since October 2022, excluding a short-lived rebound in March this year. The slack in the manufacturing sector has been priced in for a while, and we’ll probably need to see a rather soft number to trigger recession alarms and drive the dollar materially lower, ING’s FX strategist Francesco Pesole notes.
DXY to flatten in the 101.50/102.0 range
“The consensus is looking at a modest improvement in August, from 46.8 to 47.5. One sub-index that we are monitoring closely is the ISM Prices Paid, which also experienced a spike this spring but has been subdued over the past couple of months. Consensus expectations are for a decline from 52.9 to 52.0, which should feed into the Fed’s and the market’s conviction call on disinflation.”
“Our calculations on CFTC future speculative positioning data show that the dollar has moved close to neutral positioning, with aggregate net longs against reported G10 currencies now only amounting to 5% of open interest, as of 27 August. That is a substantial squeeze from 16% in early July and 24% in early May. When combining this notion with a Fed pricing that factors in one 50bp cut by year-end, the case for another major leg lower in the dollar needs to be matched by rather bearish expectations on upcoming US activity data.”
“Our US economist is on the lower end of the consensus for payrolls on Friday, but before then there may not be enough bad news to take the dollar much lower. A flattening of DXY in the 101.50/102.0 range is our baseline until Thursday.”
- Natural Gas keeps its head above $2.30 after last week’s rally.
- Markets see Europe cutting demand, while tensions in Gaza ramp up again.
- The US Dollar index holds steady just below key level ahead of ISM Manufacturing numbers.
Natural Gas is trading near $2.32 with some bearish and bullish elements in play, keeping Natural Gas prices rather stable. The bullish elements are coming from tensions in the Middle East, where Israeli people are starting to question the approach from Israel’s Prime Minister Benjamin Netanyahu and demand a swift ceasefire and peace deal to get hostages return safely. On the other side, bearish news comes out from Europe with Gas storages near full ahead of the next heating season and the German car industry struggling.
Meanwhile, the US Dollar Index (DXY), which tracks the Greenback's value against six major currencies, is holding on to its recovery taking place last week. Markets got wrong-footed after the Jackson Hole speech from US Federal Reserve Chairman Jerome Powell, going all in that a September rate cut might be bigger than 25 basis points. Recent US data shows that even a 25 basis points rate cut starts to get doubted, with the Nonfarm Payrolls report on Friday to be a key data point to confirm how big that September rate cut will be.
Natural Gas is trading at $2.32 per MMBtu at the time of writing.
Natural Gas news and market movers: Europe is closed for Gas
- Russian LNG supplier Novatek is offering LNG to ports in Europe or Asia.
- European Gas storage facilities are over 92% filled up. However, any disruption would still be enough to see gas prices jump higher, according to Bloomberg.
- Bloomberg Economics still points to risks from Ukraine’s incursion into Russia as a tail risk for Gas prices that might jump in case Russia retaliates firmly.
- The news out of Germany that Volkswagen will cut its production facilities might mean less demand to come from the German industry as manufacturing in Europe retreats further, Reuters reports.
Natural Gas Technical Analysis: Both ways
Natural Gas prices are a bit torn as any upside looks limited for now. Europe has far succeeded in reaching its goal of securing enough Gas to make it through the next heating season. Meanwhile, Russia is facing pressure in its financial system with China pulling its liquidity support due to US sanctions and Ukraine’s excursion into Russia. Expect any upside in the Gas prices to remain subdued with no real substantial rallies to take place if current events remain as they are.
Should more bullish headlines emerge and push the Gas price higher, look ahead for moving averages as upside resistances. First, the 100-day Simple Moving Average (SMA) at $2.42 would already be a significant move higher. Further up, the green ascending trend line at $2.56 could be tested.
On the downside, very close support from the 200-day SMA at $2.29 should avoid that Gas prices fall lower. In case that level snaps, $2.13 comes back into play for a test and possible dip below. Although still far away, a return to $2.00 or lower could mean a test at the low of August, with $1.93 in the cards.
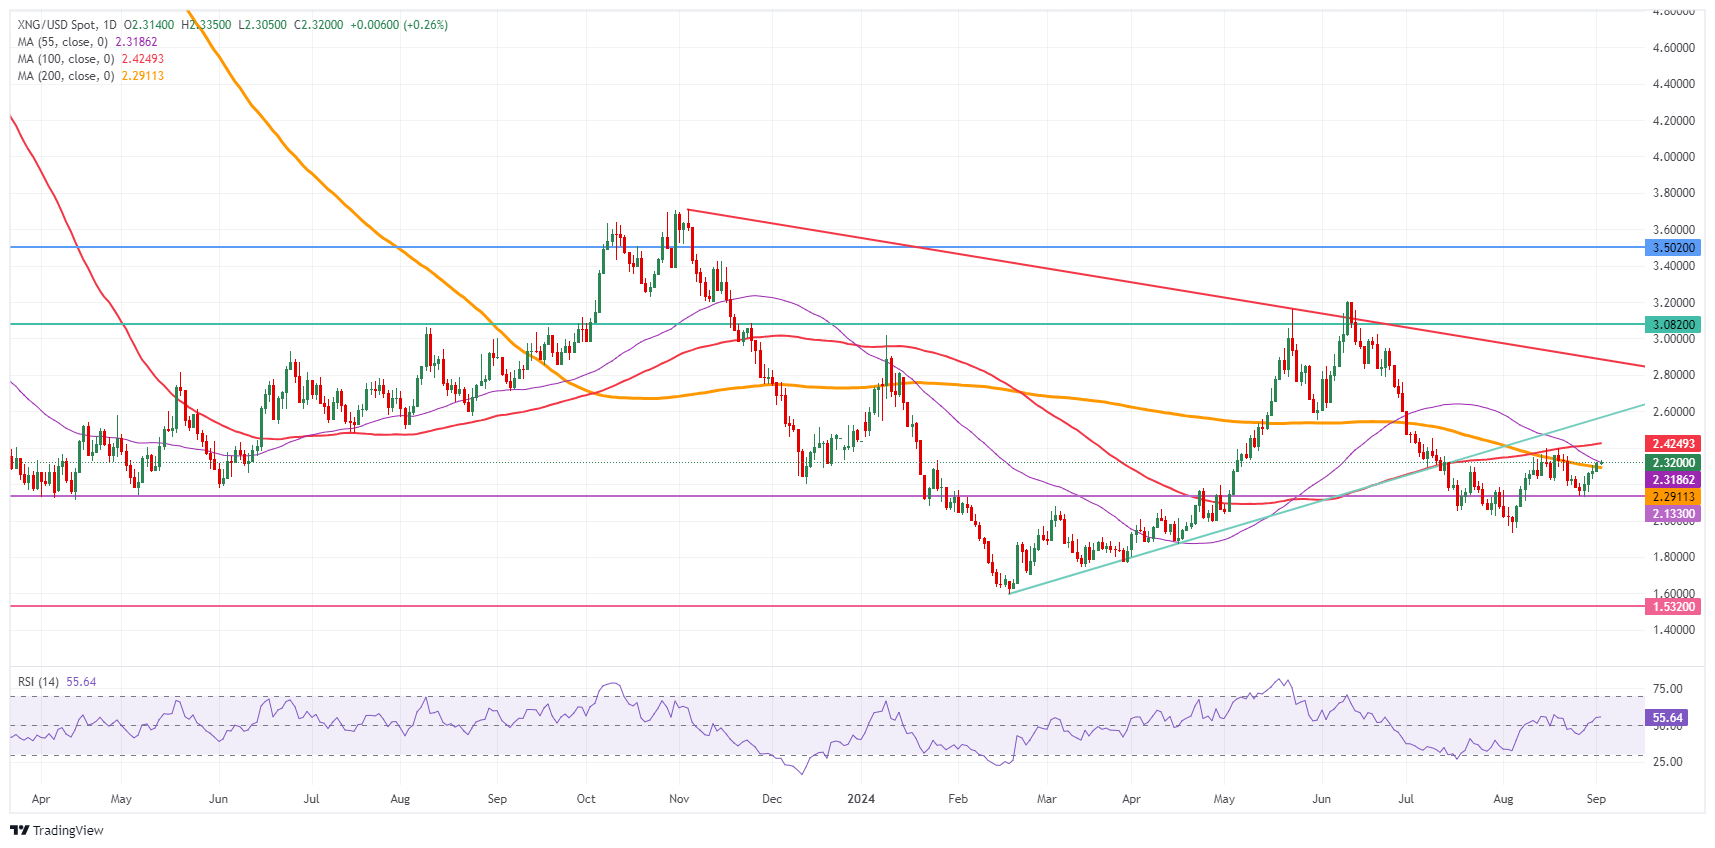
Natural Gas: Daily Chart
Natural Gas FAQs
Supply and demand dynamics are a key factor influencing Natural Gas prices, and are themselves influenced by global economic growth, industrial activity, population growth, production levels, and inventories. The weather impacts Natural Gas prices because more Gas is used during cold winters and hot summers for heating and cooling. Competition from other energy sources impacts prices as consumers may switch to cheaper sources. Geopolitical events are factors as exemplified by the war in Ukraine. Government policies relating to extraction, transportation, and environmental issues also impact prices.
The main economic release influencing Natural Gas prices is the weekly inventory bulletin from the Energy Information Administration (EIA), a US government agency that produces US gas market data. The EIA Gas bulletin usually comes out on Thursday at 14:30 GMT, a day after the EIA publishes its weekly Oil bulletin. Economic data from large consumers of Natural Gas can impact supply and demand, the largest of which include China, Germany and Japan. Natural Gas is primarily priced and traded in US Dollars, thus economic releases impacting the US Dollar are also factors.
The US Dollar is the world’s reserve currency and most commodities, including Natural Gas are priced and traded on international markets in US Dollars. As such, the value of the US Dollar is a factor in the price of Natural Gas, because if the Dollar strengthens it means less Dollars are required to buy the same volume of Gas (the price falls), and vice versa if USD strengthens.
USD/CHF recovered to 0.8520 after touching the 0.84 low on August 29, a level last seen at the start of the year, DBS Senior FX Strategist Philip Wee notes.
Switzerland’s growth outlook to influence SNB’s inflation assessment
“On August 30, Swiss National Bank President Thomas Jordan said Switzerland’s moderate growth outlook, along with gains in the CHF, would influence the central bank’s inflation assessment. Jordan also highlighted that the strength of the CHF poses a challenge to the Swiss industry, particularly given the weak demand from Europe.”
“In June, SNB forecasted inflation at 1% or the mid-point of its 1-3% target range through 1Q27. As a result, the market will be closely watching today’s CPI and GDP data for any downside surprises. The consensus is that CPI inflation declined to 1.2% YoY in August from 1.3% in July and that GDP growth improved to 1.5% YoY in 2Q24 from 0.6% in 1Q24.”
“The OIS market has priced in a 126% probability of a third 25 bps rate cut to 1.00% at the SNB meeting on September 26.”
The official manufacturing PMI edged down to a six-month low of 49.1 in August on weaker demand. IP growth may have slowed sharply to 4% y/y; export growth likely accelerated partly due to base effects. Policy measures likely supported equipment investment and consumer goods retail sales. PPI deflation may have accelerated on subdued demand; CPI inflation likely picked up on food prices, Standard Chartered macro analysts Hunter Chan and Shuang Ding note.
Growth momentum turns softer
“The official manufacturing PMI edged down further to 49.1 in August from 49.4 in July, marking the lowest reading since February. The production PMI fell below 50 for the first time since February as new orders continued to decline. Industrial production (IP) growth may have edged down to 4% y/y in August from 5.1% in July. That said, external demand likely remained relatively stable. The new export orders PMI improved 0.2pts to 48.7.”
“The services PMI improved 0.2pts to 50.2 on better transport, sports and entertainment activity in August, while capital market, real estate and residential services performance declined. Retail sales growth likely rebounded seasonally to 4% y/y from 2.7% in July. Fixed asset investment (FAI) YTD growth may have remained stable. While we think equipment investment growth was resilient in August, infrastructure investment likely remained soft. Moreover, real estate investment may have contracted further.”
“We expect CPI inflation to have inched up 0.1ppts to 0.6% y/y in August on higher pork and vegetable prices. PPI deflation likely intensified to 1.4% y/y as metal and construction material prices fell amid softer demand. We expect total social financing (TSF) growth to have stayed at 8.2% y/y on a seasonal recovery in new CNY loans and accelerated issuance of government bonds.”
Markets were largely quiet overnight as US markets were closed for labour day holiday, OCBC FX strategists Frances Cheung and Christopher Wong note.
Lots of data coming this way
“Market activity could pick up pace as data releases intensify with payrolls to end the week on Fri. Greater emphasis will be placed on labour market-related data, given that Fed’s focus has shifted towards supporting labour market. Today we have ISM mfg, new orders, employment.”
“Good and bad data may point to USD strength while data in line with estimate may see a more muted response to USD. DXY was last at 101.67. Daily momentum turned mild bullish but rise in RSI moderated. We still see some risks of further short squeeze.”
“Resistance at 102 (21 DMA), 102.20 (23.6% fibo retracement of 2023 high to 2024 low). Support at 100.50 levels. Week’s focus on JOLTs job openings (Wed), ADP employment, ISM services employment (Thu), and US payrolls report on Fri.”
- AUD/USD falls vertically below 0.6750 amid risk-off mood.
- The US Dollar gains ahead of the US ISM Manufacturing PMI for August.
- The Australian Dollar will be guided by RBA Bullock’s speech on Thursday.
The AUD/USD pair plunges below the crucial support of 0.6750 in Tuesday’s European session. The Aussie asset has been hit hard as the US Dollar (USD) extends its upside ahead of a slew of United States (US) economic data this week.
The US Dollar Index (DXY), which tracks the Greenback’s value against six major currencies, inches closer to a two-week high of 102.00. Meanwhile, the market sentiment remains risk-averse as speculation for the Federal Reserve (Fed) to start reducing interest rates this month aggressively has eased. S&P 500 futures have posted significant losses in European trading hours.
Traders see a little chance that the Fed will cut interest rates by 50 basis points (bps) this month as the revised estimate for the United States (US) Q2 Gross Domestic Product (GDP) growth showed that the economy at a faster pace of 3% than flash estimates of 2.8% on an annualized basis.
For fresh cues on the Fed interest rate cut path, investors await the US Nonfarm Payrolls (NFP) data for August, which will be published on Friday. In Tuesday’s session, investors will focus on the US ISM Manufacturing PMI for August, which will be published at 14:00 GMT. Activities in the manufacturing sector are expected to have contracted at a slower pace, with the PMI coming in at 47.5 from July’s reading of 46.8.
Meanwhile, the Australian Dollar (AUD) weakens as the current market mood bodes poorly for risky assets. On the domestic front, the major trigger for the Aussie will be the Q2 GDP data, which will be published on Wednesday. The Australian economy is estimated to have expanded at a faster pace of 0.3% than 0.1% growth registered in the January-March period.
This week, investors will also focus on Reserve Bank of Australia (RBA) Governor Michele Bullock’s speech on Thursday. Investors will look for fresh cues about whether the RBA will pivot to policy normalization this year.
Australian Dollar FAQs
One of the most significant factors for the Australian Dollar (AUD) is the level of interest rates set by the Reserve Bank of Australia (RBA). Because Australia is a resource-rich country another key driver is the price of its biggest export, Iron Ore. The health of the Chinese economy, its largest trading partner, is a factor, as well as inflation in Australia, its growth rate and Trade Balance. Market sentiment – whether investors are taking on more risky assets (risk-on) or seeking safe-havens (risk-off) – is also a factor, with risk-on positive for AUD.
The Reserve Bank of Australia (RBA) influences the Australian Dollar (AUD) by setting the level of interest rates that Australian banks can lend to each other. This influences the level of interest rates in the economy as a whole. The main goal of the RBA is to maintain a stable inflation rate of 2-3% by adjusting interest rates up or down. Relatively high interest rates compared to other major central banks support the AUD, and the opposite for relatively low. The RBA can also use quantitative easing and tightening to influence credit conditions, with the former AUD-negative and the latter AUD-positive.
China is Australia’s largest trading partner so the health of the Chinese economy is a major influence on the value of the Australian Dollar (AUD). When the Chinese economy is doing well it purchases more raw materials, goods and services from Australia, lifting demand for the AUD, and pushing up its value. The opposite is the case when the Chinese economy is not growing as fast as expected. Positive or negative surprises in Chinese growth data, therefore, often have a direct impact on the Australian Dollar and its pairs.
Iron Ore is Australia’s largest export, accounting for $118 billion a year according to data from 2021, with China as its primary destination. The price of Iron Ore, therefore, can be a driver of the Australian Dollar. Generally, if the price of Iron Ore rises, AUD also goes up, as aggregate demand for the currency increases. The opposite is the case if the price of Iron Ore falls. Higher Iron Ore prices also tend to result in a greater likelihood of a positive Trade Balance for Australia, which is also positive of the AUD.
The Trade Balance, which is the difference between what a country earns from its exports versus what it pays for its imports, is another factor that can influence the value of the Australian Dollar. If Australia produces highly sought after exports, then its currency will gain in value purely from the surplus demand created from foreign buyers seeking to purchase its exports versus what it spends to purchase imports. Therefore, a positive net Trade Balance strengthens the AUD, with the opposite effect if the Trade Balance is negative.
- The Pound Sterling falls to near 1.3100 against the US Dollar as the Greenback clings to gains ahead of the US ISM Manufacturing PMI for August.
- US NFP data for August would be the major trigger this week.
- Investors see the BoE keeping interest rates steady at 5% this month.
The Pound Sterling (GBP) exhibits a subdued performance slightly above the crucial support of 1.3100 against the US Dollar (USD) in Tuesday’s London session. The GBP/USD pair edges lower as the US Dollar grips gains near an almost two-week high, with investors’ attention turning to the United States (US) Nonfarm Payrolls (NFP) data for August, releasing this Friday.
The US Dollar Index (DXY), which tracks the Greenback’s value against six major currencies, consolidates near 101.70.
Investors keenly await the labor market data as it is expected to drive market speculation for the magnitude of the Federal Reserve’s (Fed) interest rate cut this month. Currently, traders are split about whether the Fed will cut interest rates gradually by 25 basis points (bps) or aggressively by 50 bps.
The importance of the labor market data has increased significantly as comments from Fed Chair Jerome Powell at the Jackson Hole (JH) Symposium indicated that the central bank is more focused on preventing job demand, given that officials are confident about inflationary pressures remaining on track to sustainably return to bank’s target of 2%.
Investors will also get cues about the current labor market status from the US JOLTS Job Openings data for July and the ADP Employment Change data for August, which will be published on Wednesday and Thursday, respectively.
In Tuesday’s session, the US Dollar will be influenced by the S&P Global (final estimate) and ISM Manufacturing Purchasing Managers Index (PMI) data for August, which will be published in the North American session. Economists expect that activities in the manufacturing sector contracted at a slower pace, with the official PMI from the ISM coming in at 47.5 from July’s reading of 46.8.
Daily digest market movers: Pound Sterling falls despite BoE seems to be leaving interest rates steady at 5%
- The Pound Sterling performs weakly against its major peers, except Asia-Pacific currencies, during the European trading hours. The British currency remains on the back foot even though the Bank of England (BoE) is expected to follow a shallow interest rate cut cycle this year compared to its peer central bankers.
- Traders see little chance that the BoE will cut interest rates in September but are confident about November, Reuters reported. Market speculation for September interest rate cuts is weak as inflationary pressures in the United Kingdom (UK) are expected to remain sticky due to strong economic prospects. Also, comments from BoE Governor Andrew Bailey at the JH Symposium indicated that the central bank will be careful not to cut interest rates too quickly or by too much.
- The final estimate of S&P Global/CIPS Manufacturing PMI showed on Monday that activities in the manufacturing sector in the UK expanded to a 26-month high at 52.5 in August, driven by the continuation of a strong recovery in output, new orders, and labor demand.
- “The UK manufacturing sector remained a positive contributor to broader economic growth in August. The headline PMI hit a 26-month high of 52.5, reflecting solid expansions in output and new orders and the strongest jobs growth for over two years. The upturn is broad-based across manufacturing, with the investment goods sector the stand-out performer”, Rob Dobson, Director at S&P Global Market Intelligence, said.
- For fresh interest rate clues, investors await BoE policymaker Sarah Breeden’s speech, which is scheduled at 12:45 GMT. Breeden was among policymakers who voted for cutting interest rates in August by 25 basis points (bps) to 5%, along with Andrew Bailey, Swati Dhingra, Dave Ramsden, and Clare Lombardelli.
Technical Analysis: Pound Sterling sees support slightly below 1.3100
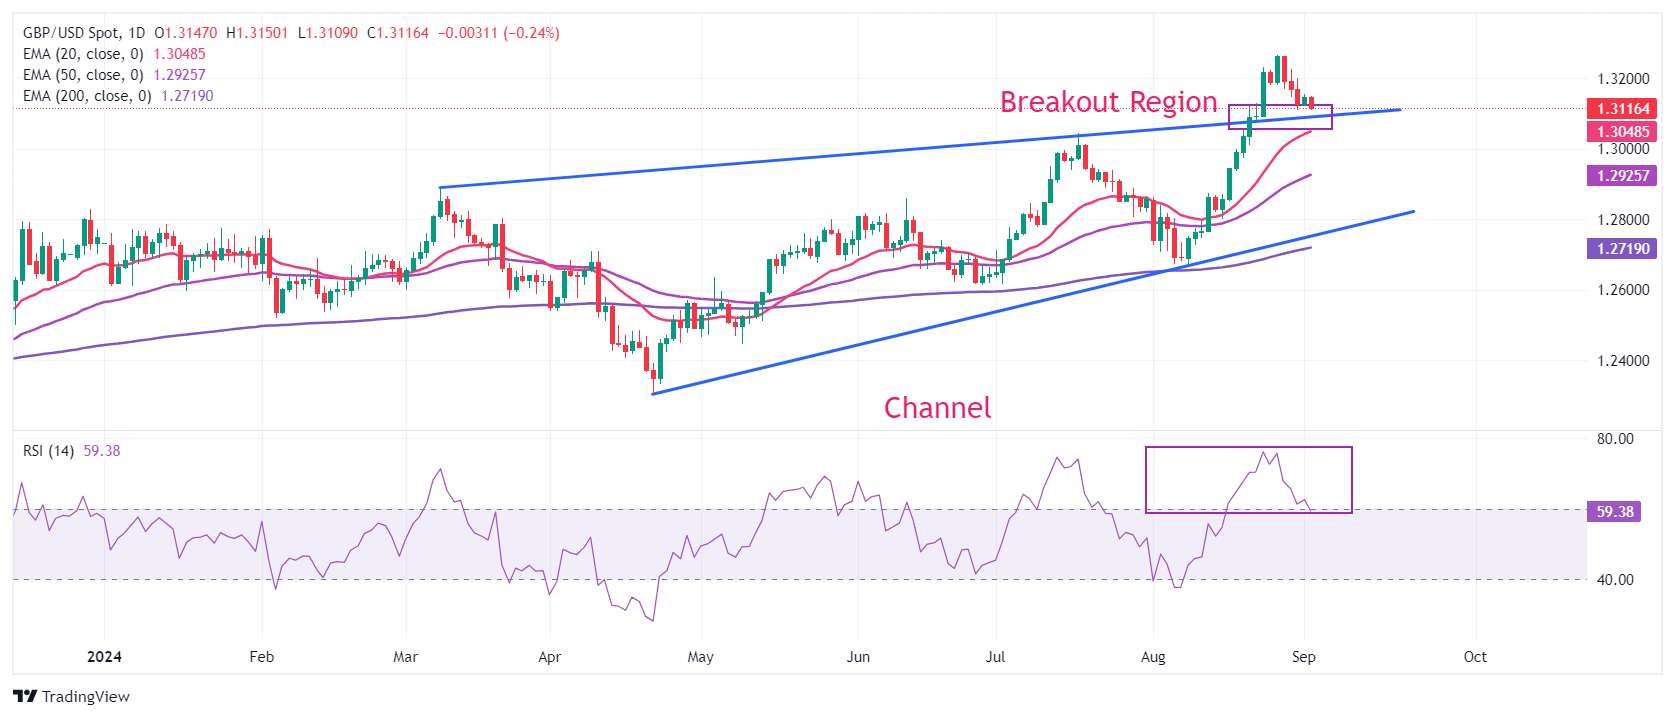
The Pound Sterling declines to nearly 1.3100 against the US Dollar. The GBP/USD pair faces pressure after declining below the round-level support of 1.3200 last week. The Cable may likely find buying interest near the breakout region of a Channel chart formation on a daily timeframe.
The 14-day Relative Strength Index (RSI) declines to near 60.00 after exiting overbought conditions, signaling a lack of bullish momentum at the moment.
However, upward-sloping short-to-long-term Exponential Moving Averages (EMAs) suggest a strong bullish trend.
If bullish momentum resumes, the Cable is expected to rise towards the psychological resistance of 1.3500 and the February 4, 2022, high of 1.3640 after breaking above a fresh two-and-a-half-year high of 1.3266. On the downside, the psychological level of 1.3000 will be the crucial support for the Pound Sterling bulls.
Pound Sterling FAQs
The Pound Sterling (GBP) is the oldest currency in the world (886 AD) and the official currency of the United Kingdom. It is the fourth most traded unit for foreign exchange (FX) in the world, accounting for 12% of all transactions, averaging $630 billion a day, according to 2022 data. Its key trading pairs are GBP/USD, aka ‘Cable’, which accounts for 11% of FX, GBP/JPY, or the ‘Dragon’ as it is known by traders (3%), and EUR/GBP (2%). The Pound Sterling is issued by the Bank of England (BoE).
The single most important factor influencing the value of the Pound Sterling is monetary policy decided by the Bank of England. The BoE bases its decisions on whether it has achieved its primary goal of “price stability” – a steady inflation rate of around 2%. Its primary tool for achieving this is the adjustment of interest rates. When inflation is too high, the BoE will try to rein it in by raising interest rates, making it more expensive for people and businesses to access credit. This is generally positive for GBP, as higher interest rates make the UK a more attractive place for global investors to park their money. When inflation falls too low it is a sign economic growth is slowing. In this scenario, the BoE will consider lowering interest rates to cheapen credit so businesses will borrow more to invest in growth-generating projects.
Data releases gauge the health of the economy and can impact the value of the Pound Sterling. Indicators such as GDP, Manufacturing and Services PMIs, and employment can all influence the direction of the GBP. A strong economy is good for Sterling. Not only does it attract more foreign investment but it may encourage the BoE to put up interest rates, which will directly strengthen GBP. Otherwise, if economic data is weak, the Pound Sterling is likely to fall.
Another significant data release for the Pound Sterling is the Trade Balance. This indicator measures the difference between what a country earns from its exports and what it spends on imports over a given period. If a country produces highly sought-after exports, its currency will benefit purely from the extra demand created from foreign buyers seeking to purchase these goods. Therefore, a positive net Trade Balance strengthens a currency and vice versa for a negative balance.
EUR/CHF has recently risen above 0.9350 and 0.94, Société Generale FX analysts note.
Daily MACD is attempting across above its trigger line
EUR/CHF has recently carved out a higher trough near 0.9350 than the one achieved in August at 0.9210. This denotes downward momentum is receding.
Daily MACD is within negative territory but is attempting across above its trigger line. A brief rebound towards 0.9490, the 61.8% retracement of recent pullback can’t be ruled out.
The 200-DMA near 0.9580/0.9600 will be a crucial resistance zone near term. In the event the pair breaches 0.9350, there would be risk of a deeper pullback.
- NZD/USD may be reversing back down after a false break to the upside of a multi-month range.
- The pair is at a critical point – a close back inside the range could mark a surprise bearish turn.
NZD/USD has reversed course after breaking out of the top of its consolidation range. It is possible the break may have been “false” and the pair will now start falling back down towards the range lows, however, it is too early to say for sure.
Despite the current weakness, the trend remains bullish on the daily chart, and given “the trend is your friend” the odds still favor a recovery and eventual extension to higher highs.
The break above the August 20 high on August 29 and September 3 confirmed a breakout from the multi-month range. This would normally indicate substantial probable gains on the horizon, however, price failed to extend and instead rolled over and started breaking lower.
NZD/USD Daily Chart
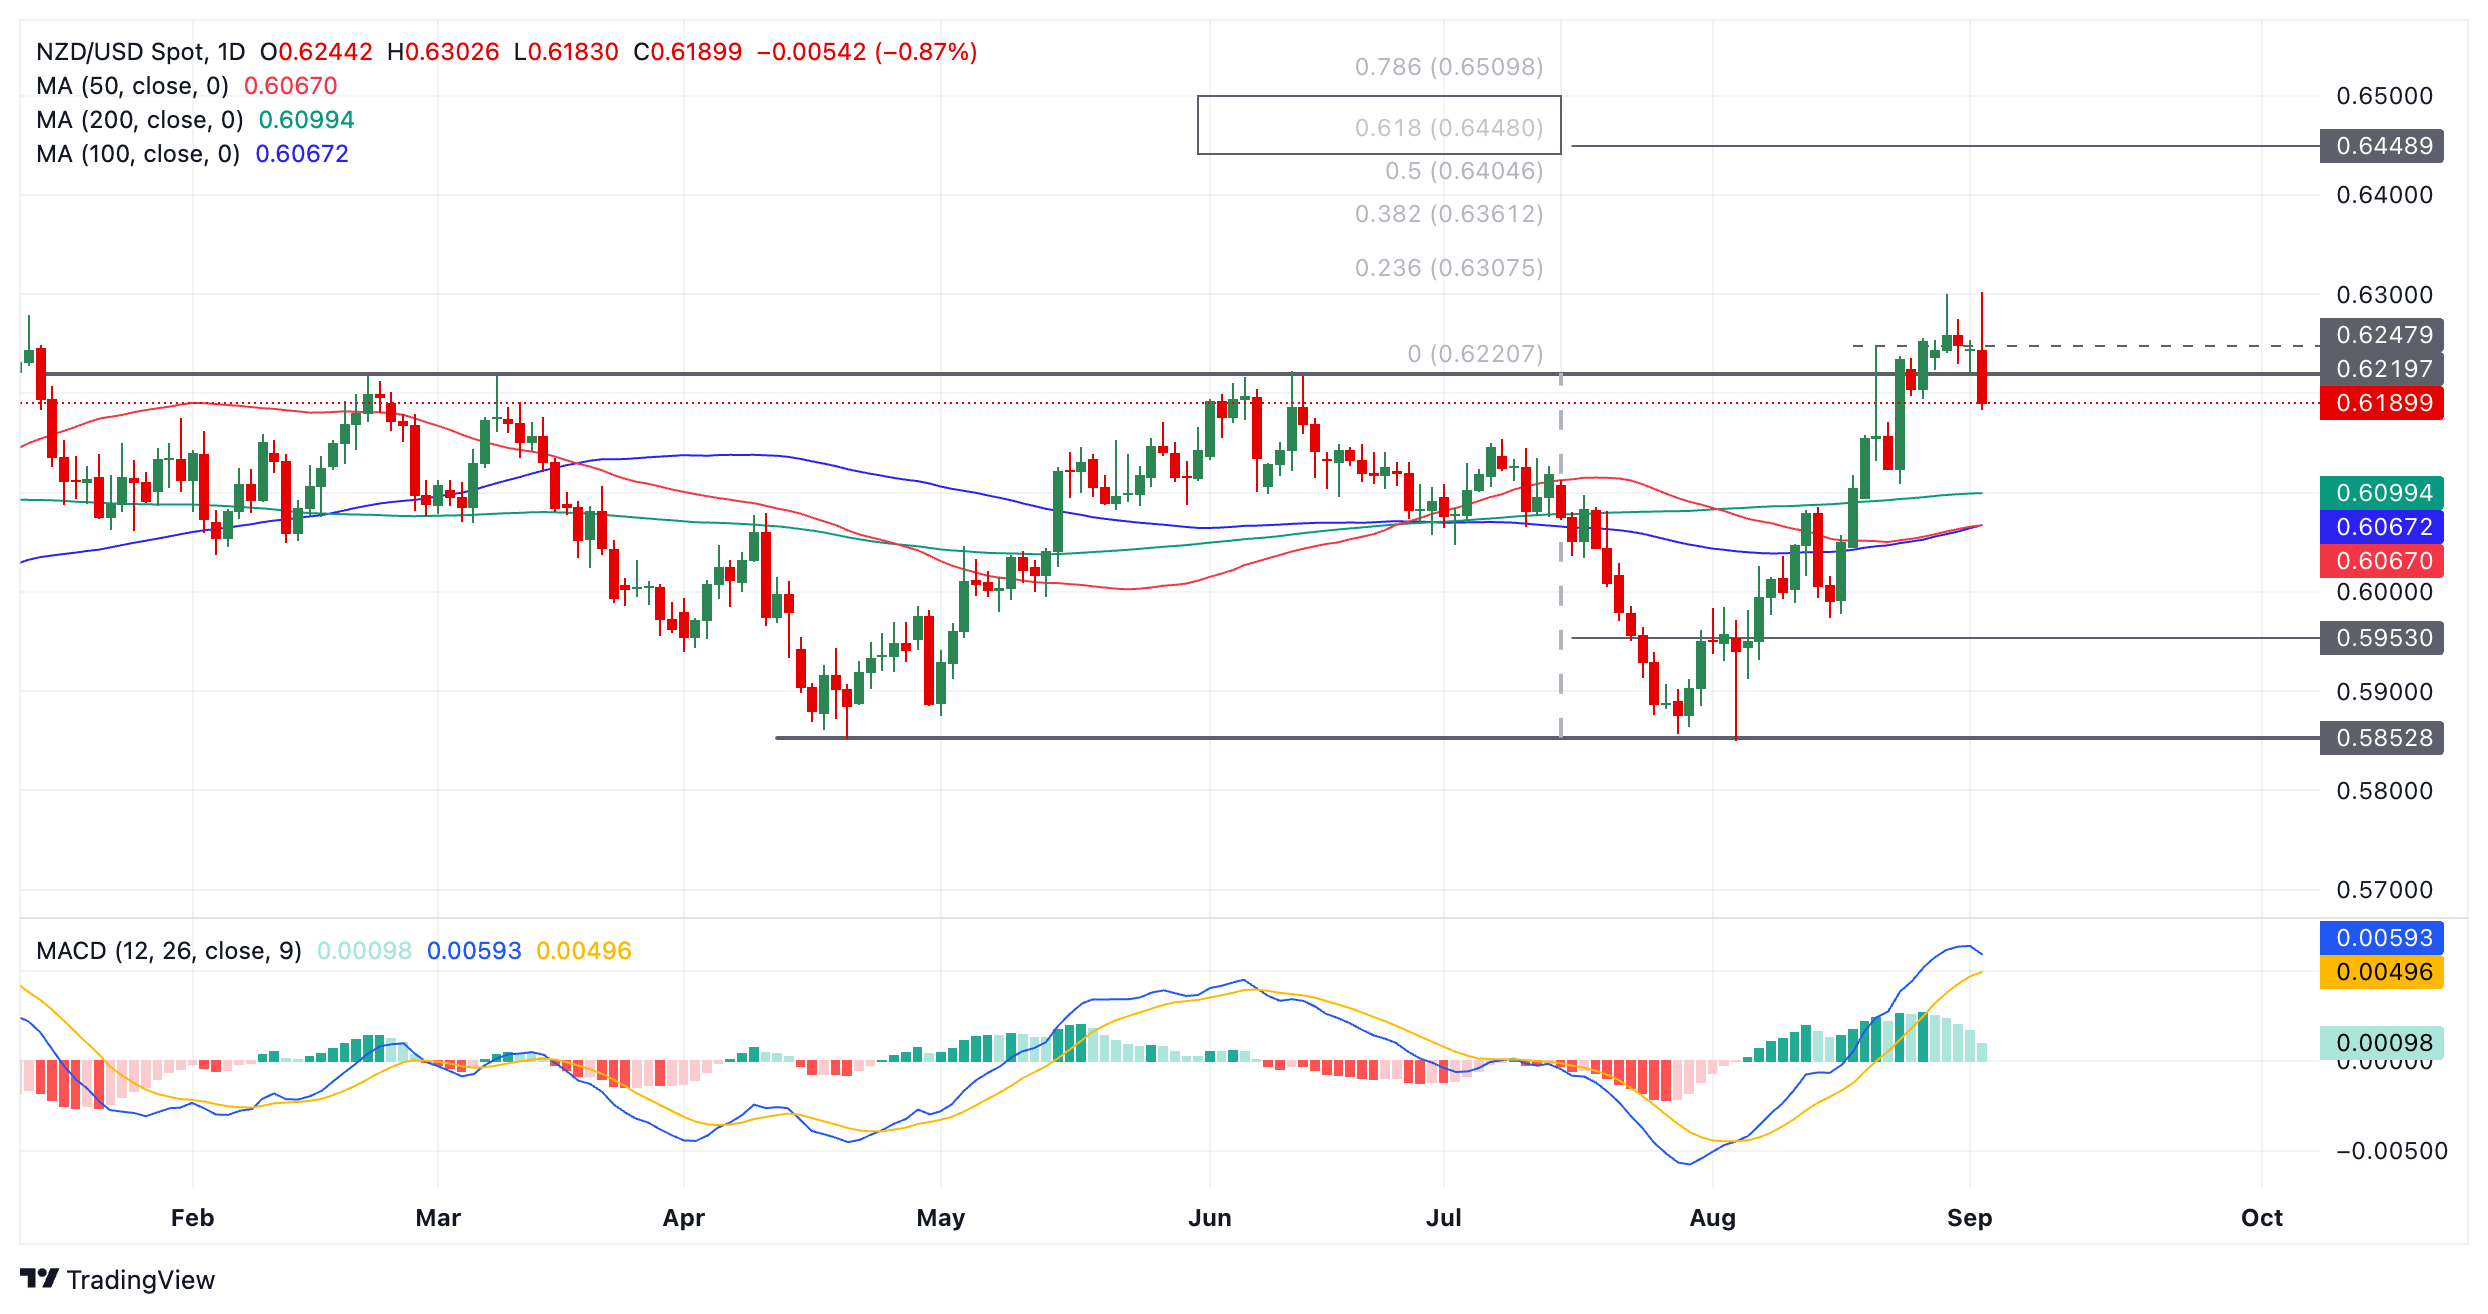
Assuming the correction runs out of energy the price should find a floor and start going higher again. It is eventually likely to achieve its next upside target at 0.6409, the December 2023 high. This is a conservative target for the pair. The breakout from the range actually activated another higher target that is at 0.6448, the 0.618 ratio of the height of the range extrapolated higher.
Given the weakness currently witnessed and the possible reversal of the trend on the 4-hour Chart (not shown), however, there is a risk the breakout was false and the pair will now start declining back down within its familiar range.
A daily close below the top of the range – that is to say below 0.6220 – would provide more confirmation of a bearish twist. The Moving Average Convergence Divergence (MACD) would also give a bearish signal if it closes below its signal line. A close below 0.6194 would provide more confidence still.
Silver prices (XAG/USD) fell on Tuesday, according to FXStreet data. Silver trades at $28.38 per troy ounce, down 0.48% from the $28.52 it cost on Monday.
Silver prices have increased by 19.27% since the beginning of the year.
| Unit measure | Silver Price Today in USD |
|---|---|
| Troy Ounce | 28.38 |
| 1 Gram | 0.91 |
The Gold/Silver ratio, which shows the number of ounces of Silver needed to equal the value of one ounce of Gold, stood at 88.21 on Tuesday, up from 87.67 on Monday.
Silver FAQs
Silver is a precious metal highly traded among investors. It has been historically used as a store of value and a medium of exchange. Although less popular than Gold, traders may turn to Silver to diversify their investment portfolio, for its intrinsic value or as a potential hedge during high-inflation periods. Investors can buy physical Silver, in coins or in bars, or trade it through vehicles such as Exchange Traded Funds, which track its price on international markets.
Silver prices can move due to a wide range of factors. Geopolitical instability or fears of a deep recession can make Silver price escalate due to its safe-haven status, although to a lesser extent than Gold's. As a yieldless asset, Silver tends to rise with lower interest rates. Its moves also depend on how the US Dollar (USD) behaves as the asset is priced in dollars (XAG/USD). A strong Dollar tends to keep the price of Silver at bay, whereas a weaker Dollar is likely to propel prices up. Other factors such as investment demand, mining supply – Silver is much more abundant than Gold – and recycling rates can also affect prices.
Silver is widely used in industry, particularly in sectors such as electronics or solar energy, as it has one of the highest electric conductivity of all metals – more than Copper and Gold. A surge in demand can increase prices, while a decline tends to lower them. Dynamics in the US, Chinese and Indian economies can also contribute to price swings: for the US and particularly China, their big industrial sectors use Silver in various processes; in India, consumers’ demand for the precious metal for jewellery also plays a key role in setting prices.
Silver prices tend to follow Gold's moves. When Gold prices rise, Silver typically follows suit, as their status as safe-haven assets is similar. The Gold/Silver ratio, which shows the number of ounces of Silver needed to equal the value of one ounce of Gold, may help to determine the relative valuation between both metals. Some investors may consider a high ratio as an indicator that Silver is undervalued, or Gold is overvalued. On the contrary, a low ratio might suggest that Gold is undervalued relative to Silver.
(An automation tool was used in creating this post.)
EUR/USD appreciated by 0.2% to 1.1072, brushing aside the victory of Germany’s far-right Alternative for Germany (AfD) in the eastern state of Thuringia, but now it’s back below 1.1048 at 1.1035, DBS Senior FX Strategist Philip Wee notes.
ECB to join Fed in lowering rates.
“The Euro had depreciated in the last three days of the previous week, dropping to 1.1048 from 1.1184, amid expectations of a second interest rate cut at the European Central Bank meeting on September 12.”
“Following the Eurozone CPI inflation decline to 2.2% YoY in August, down from 2.6% in July, the OIS market has priced in a 94% chance of a 25 bps cut in the deposit facility rate to 3.50%.”
“Last week, ECB Chief Economist Philip Lane cautioned that the mission to return to the 2% target was ‘not yet secure’, signalling concerns with the market pricing in a neutral rate of 2.00-2.50% by mid-2025.”
Standard Chartered lowers their 2024 growth forecast to 0.0% from 0.6% on weaker H1 growth and statistical GDP revisions. Japan’s economy is likely to recover gradually, supported by domestic consumption. Standard Chartered raises their CPI forecasts on still-sticky inflation due to wage growth and reduced utility subsidies, Standard Chartered’s macro analyst Chong Hoon Park notes.
H2 to be better than H1, but not strong enough
“We lower our 2024 GDP growth forecast to 0.0% from 0.6% on a weaker-than-expected H1 performance and likely diminished growth momentum in H2. We expect the Bank of Japan (BoJ) to maintain a hawkish policy stance due to concerns over persistent inflation and its impact on domestic consumption and investment. Consequently, we raise our CPI inflation forecast for 2024 to 2.5% from 2.4%, as inflation remains stubbornly high, driven by wage increases and the phasing out of government energy subsidies. We also revise higher our 2026 CPI inflation forecast to 2.0% from 1.8%.”
“That said, Japan's economy is gradually recovering, supported by fiscal policies and an improvement in employment and income. As a result, we revise our 2025 growth forecast to 1.3% from 1.1%. We also raise our 2026 growth forecast to 1.0% from 1.2% due to base effects.”
“Following statistical revisions to GDP data by the Cabinet Office, the BoJ revised down its growth forecast for FY24 (year ending March 2025) by 0.2ppt to 0.6% and emphasised that the revision is primarily due to changes in GDP statistics rather than a shift in the overall economic outlook.”
- AUD/JPY depreciates as risk aversion increases due to rising fears over the Chinese economy.
- Traders await RBA Governor Michele Bullock’s speech to gather more insights into the central bank's policy stance.
- Japan will allocate ¥989 billion to fund energy subsidies in response to rising energy costs.
AUD/JPY halts its four-day winning streak, trading around 98.40 during the European session on Tuesday. This downside of the AUD/JPY cross is attributed to rising risk aversion as traders adopt caution due to concerns mounting over China’s economic woes.
Traders assess July manufacturing PMI data from China, a key trading partner of Australia. Official figures indicated the sharpest contraction in factory activity in six months, while private survey readings suggested that the manufacturing sector had expanded for the seventh time this year.
Traders are now focusing on Australia's Q2 Gross Domestic Product (GDP) and July Trade Balance data, as well as an upcoming speech by Reserve Bank of Australia (RBA) Governor Michele Bullock later in the week, to gather more insights into the central bank's hawkish stance on monetary policy.
On Tuesday, Japan announced the allocation of ¥989 billion to fund energy subsidies in response to rising energy costs and the resulting cost-of-living pressures. This government intervention could potentially contribute to inflation.
The Bank of Japan's (BoJ) hawkish monetary policy stance has been further reinforced by a recent increase in Tokyo's inflation. Consumer Price Index (CPI) increased to 2.6% year-on-year in August, up from 2.2% in July. Core CPI also rose to 1.6% YoY in August, compared to the previous 1.5%.
Interest rates FAQs
Interest rates are charged by financial institutions on loans to borrowers and are paid as interest to savers and depositors. They are influenced by base lending rates, which are set by central banks in response to changes in the economy. Central banks normally have a mandate to ensure price stability, which in most cases means targeting a core inflation rate of around 2%. If inflation falls below target the central bank may cut base lending rates, with a view to stimulating lending and boosting the economy. If inflation rises substantially above 2% it normally results in the central bank raising base lending rates in an attempt to lower inflation.
Higher interest rates generally help strengthen a country’s currency as they make it a more attractive place for global investors to park their money.
Higher interest rates overall weigh on the price of Gold because they increase the opportunity cost of holding Gold instead of investing in an interest-bearing asset or placing cash in the bank. If interest rates are high that usually pushes up the price of the US Dollar (USD), and since Gold is priced in Dollars, this has the effect of lowering the price of Gold.
The Fed funds rate is the overnight rate at which US banks lend to each other. It is the oft-quoted headline rate set by the Federal Reserve at its FOMC meetings. It is set as a range, for example 4.75%-5.00%, though the upper limit (in that case 5.00%) is the quoted figure. Market expectations for future Fed funds rate are tracked by the CME FedWatch tool, which shapes how many financial markets behave in anticipation of future Federal Reserve monetary policy decisions.
The Dollar Index (DXY) consolidated in a 101.55-101.80 range after a three-day rally from 100.55 to 101.80, DBS Senior FX Strategist Philip Wee notes.
Markets are likely set to fluctuate more
“US stock and bond markets were closed on Monday for the Labor Day holiday. Still, the S&P and Nasdaq Composite futures are pointing to a positive open today after being in negative territory for most of Monday. Today, consensus sees the US ISM Manufacturing PMI improving to 47.5 in August from 46.8 in July.”
“However, markets see Friday’s jobs report as the primary support for the anticipated 25 bps rate cut at the FOMC meeting on September 18. With markets also weighing this potential against the other rate cuts expected from other central banks, markets will likely fluctuate more after the past two months of USD selling.”
- EUR/GBP gains ground despite a dovish sentiment surrounding the ECB regarding its decision in September.
- ECB's François Villeroy de Galhau favors that the central bank should consider cutting rates at its next meeting.
- BRC Like-for-Like Retail Sales rose by 0.8% YoY in August, against the previous 0.3% rise.
EUR/GBP extends its gains for the second successive day, trading around 0.8430 during Tuesday’s European session. However, the upside potential for the EUR/GBP cross may be limited, as the Euro is under pressure amid strong speculation that the European Central Bank (ECB) will cut interest rates in September.
This would mark the second interest rate cut by the ECB since it began shifting toward policy normalization in June. Policymakers remain confident that inflation will gradually return to the bank's 2% target by 2025.
ECB Governing Council member François Villeroy de Galhau stated on Friday, according to Bloomberg, that there are "good reasons" for the central bank to consider cutting its key interest rates in September. Villeroy de Galhau suggested that action should be taken at the upcoming meeting on September 12, noting that it would be both fair and prudent to decide on a new rate cut.
In the United Kingdom (UK), BRC Like-for-Like Retail Sales increased by 0.8% year-on-year in August, up from a 0.3% rise in July, marking the fastest growth in five months. On Monday, the S&P Global UK Manufacturing PMI held steady at 52.5 for August, consistent with preliminary estimates.
The EUR/GBP cross may struggle as traders anticipate no rate cut by the Bank of England (BoE) in the September meeting, while the possibility of a 25 basis points (bps) interest rate cut in the November meeting stands at 87.2%.
Traders await BoE Deputy Governor Sarah Breeden's role as moderator for a panel on supervisory cooperation at a joint conference hosted by the European Central Bank and the European Banking Authority on Tuesday.
ECB FAQs
The European Central Bank (ECB) in Frankfurt, Germany, is the reserve bank for the Eurozone. The ECB sets interest rates and manages monetary policy for the region. The ECB primary mandate is to maintain price stability, which means keeping inflation at around 2%. Its primary tool for achieving this is by raising or lowering interest rates. Relatively high interest rates will usually result in a stronger Euro and vice versa. The ECB Governing Council makes monetary policy decisions at meetings held eight times a year. Decisions are made by heads of the Eurozone national banks and six permanent members, including the President of the ECB, Christine Lagarde.
In extreme situations, the European Central Bank can enact a policy tool called Quantitative Easing. QE is the process by which the ECB prints Euros and uses them to buy assets – usually government or corporate bonds – from banks and other financial institutions. QE usually results in a weaker Euro. QE is a last resort when simply lowering interest rates is unlikely to achieve the objective of price stability. The ECB used it during the Great Financial Crisis in 2009-11, in 2015 when inflation remained stubbornly low, as well as during the covid pandemic.
Quantitative tightening (QT) is the reverse of QE. It is undertaken after QE when an economic recovery is underway and inflation starts rising. Whilst in QE the European Central Bank (ECB) purchases government and corporate bonds from financial institutions to provide them with liquidity, in QT the ECB stops buying more bonds, and stops reinvesting the principal maturing on the bonds it already holds. It is usually positive (or bullish) for the Euro.
Following Canada’s decision to dramatically tax Canadian consumers of electric vehicles made in China, China has launched anti-dumping investigations into Canadian exports, UBS macro strategist Paul Donovan notes.
US ISM poll of manufacturing sentiment is due
“‘Dumping’ is the deliberate sale of exports at below market price. It is not a common occurrence, but it is a convenient way of pursuing economic nationalism (per US and EU accusations of dumping against China). The environment of economic nationalism is most obvious in traded goods, but it is also taking place elsewhere.”
“Restrictions on capital flows have been a characteristic of economic nationalism in the past. Regulation can also be used to further national interests (and markets like the EU, with a sizable middle-class consumer base, have an advantage in this area). Economists have to distinguish the destructive trends of economic nationalism from the more positive forces of localization efficiency.”
“The US ISM poll of manufacturing sentiment is due. While the questions are supposedly objective, political bias can easily be introduced into the answers. The poll has tended to surprise the consensus negatively this year. The UK BRC shop sales index showed modestly positive growth in the value of sales. Several parts of the durable goods sector are in deflation, which naturally lowers the overall value of goods sold.”
- GBP/JPY falls as traders adopt caution ahead of US ISM Manufacturing PMI release on Tuesday.
- The JPY may face challenges as weak Japanese manufacturing data fuels expectations of the BoJ postponing further rate hikes.
- BRC Like-for-Like Retail Sales rose by 0.8% YoY in August, against the previous 0.3% rise.
GBP/JPY breaks its three-day winning streak, trading around 191.80 during the European hours on Tuesday. However, the JPY encountered challenges as weak Japanese manufacturing data fueled speculation that the Bank of Japan (BoJ) might postpone further rate hikes.
On Tuesday, Japan announced to allocate ¥989 billion to fund energy subsidies in response to rising energy costs and the resulting cost-of-living pressures. This government intervention could potentially contribute to inflation.
The Bank of Japan's (BoJ) hawkish monetary policy stance has been further reinforced by a recent increase in Tokyo's inflation. Meanwhile, Japanese companies reported a sharp rise in capital spending for the second quarter.
In the United Kingdom (UK), BRC Like-for-Like Retail Sales increased by 0.8% year-on-year in August, up from a 0.3% rise in July, marking the fastest growth in five months. On Monday, the S&P Global UK Manufacturing PMI held steady at 52.5 for August, consistent with preliminary estimates.
The Pound Sterling received support as traders anticipate no rate cut by the Bank of England (BoE) in the September meeting, while the possibility of a 25 basis points (bps) interest rate cut in the November meeting stands at 87.2%.
Traders await BoE Deputy Governor Sarah Breeden's role as moderator for a panel on supervisory cooperation at a joint conference hosted by the European Central Bank and the European Banking Authority on Tuesday.
Inflation FAQs
Inflation measures the rise in the price of a representative basket of goods and services. Headline inflation is usually expressed as a percentage change on a month-on-month (MoM) and year-on-year (YoY) basis. Core inflation excludes more volatile elements such as food and fuel which can fluctuate because of geopolitical and seasonal factors. Core inflation is the figure economists focus on and is the level targeted by central banks, which are mandated to keep inflation at a manageable level, usually around 2%.
The Consumer Price Index (CPI) measures the change in prices of a basket of goods and services over a period of time. It is usually expressed as a percentage change on a month-on-month (MoM) and year-on-year (YoY) basis. Core CPI is the figure targeted by central banks as it excludes volatile food and fuel inputs. When Core CPI rises above 2% it usually results in higher interest rates and vice versa when it falls below 2%. Since higher interest rates are positive for a currency, higher inflation usually results in a stronger currency. The opposite is true when inflation falls.
Although it may seem counter-intuitive, high inflation in a country pushes up the value of its currency and vice versa for lower inflation. This is because the central bank will normally raise interest rates to combat the higher inflation, which attract more global capital inflows from investors looking for a lucrative place to park their money.
Formerly, Gold was the asset investors turned to in times of high inflation because it preserved its value, and whilst investors will often still buy Gold for its safe-haven properties in times of extreme market turmoil, this is not the case most of the time. This is because when inflation is high, central banks will put up interest rates to combat it. Higher interest rates are negative for Gold because they increase the opportunity-cost of holding Gold vis-a-vis an interest-bearing asset or placing the money in a cash deposit account. On the flipside, lower inflation tends to be positive for Gold as it brings interest rates down, making the bright metal a more viable investment alternative.
- Gold trades just below $2,500 as risk recedes, markets are calm, and the US Dollar recovers marginally.
- Traders await US labor market data this week before determining their next moves.
- The $2,500 level is key from a technical perspective, and it is threatening to give way under bearish pressure.
Gold (XAU/USD) edges lower into the $2,490s on Tuesday as a measure of market calm descends, which does little to drive up demand for safe-haven Gold.
The US Dollar (USD) – to which Gold is negatively correlated – slows in its recovery rally, trading only marginally higher on Tuesday as traders keep their powder dry ahead of the release of potentially market-moving US labor market data later this week.
Investors appear to be calmly awaiting the final “test results” for the patient – in this case the US economy – before drawing any conclusions about the likely course of action ahead, in terms of the Federal Reserve’s (Fed) decision on how much to cut interest rates – a key driver of Gold.
Demonstrations in Tel Aviv, demanding a ceasefire in Gaza after seven Israeli hostages were found dead, and the calling of a general strike by Israeli workers have, if anything temporarily, dialed down the threat level in at least one key geopolitical hotspot, adding to the uneasy calm permeating markets.
Gold traders look ahead to US employment data
Gold price is most likely to see volatility from the release of US labor market data this week. At his pivotal speech in Jackson Hole, Fed Chairman Jerome Powell turned the spotlight away from inflation and onto the fragile-looking labor market, suggesting that downside risks to employment were now greater than upside risks to inflation.
If labor market data out this week in the form of the ISM Manufacturing Employment Index on Tuesday, JOLTS Job Openings on Wednesday, ADP Employment Change, Jobless Claims and ISM Services Employment Index on Thursday, and Nonfarm Payrolls (NFP) on Friday, come out weaker than expected and back up his concerns, it will probably lead to a tumble in the US Dollar (USD) but a rise in the price of Gold.
Markets are debating whether the Fed will need to make a 50 basis point (bps) cut to interest rates in September or just a standard 25 bps cut. The latter is fully expected whilst market-based probabilities for the former sit currently at around 30%, according to the CME FedWatch Tool.
If labor market data is decidedly under par, the chances of a bigger cut will increase, which in turn will give Gold a leg up on the charts. Lower interest rates are positive for the precious metal because they make it comparably more attractive to investors as a non-interest-paying asset.
Technical Analysis: Tests base of mini-range
Gold (XAU/USD) is testing the base of the mini-range it has been trading in since late August, between $2,500 and $2,531. It is currently eroding the range floor, positing marginally lower lows as it descends. There is a risk it could break lower and enter a new zone of activity between the sloping top of the old range highs at about $2,470 and $2,500.
XAU/USD 4-hour Chart
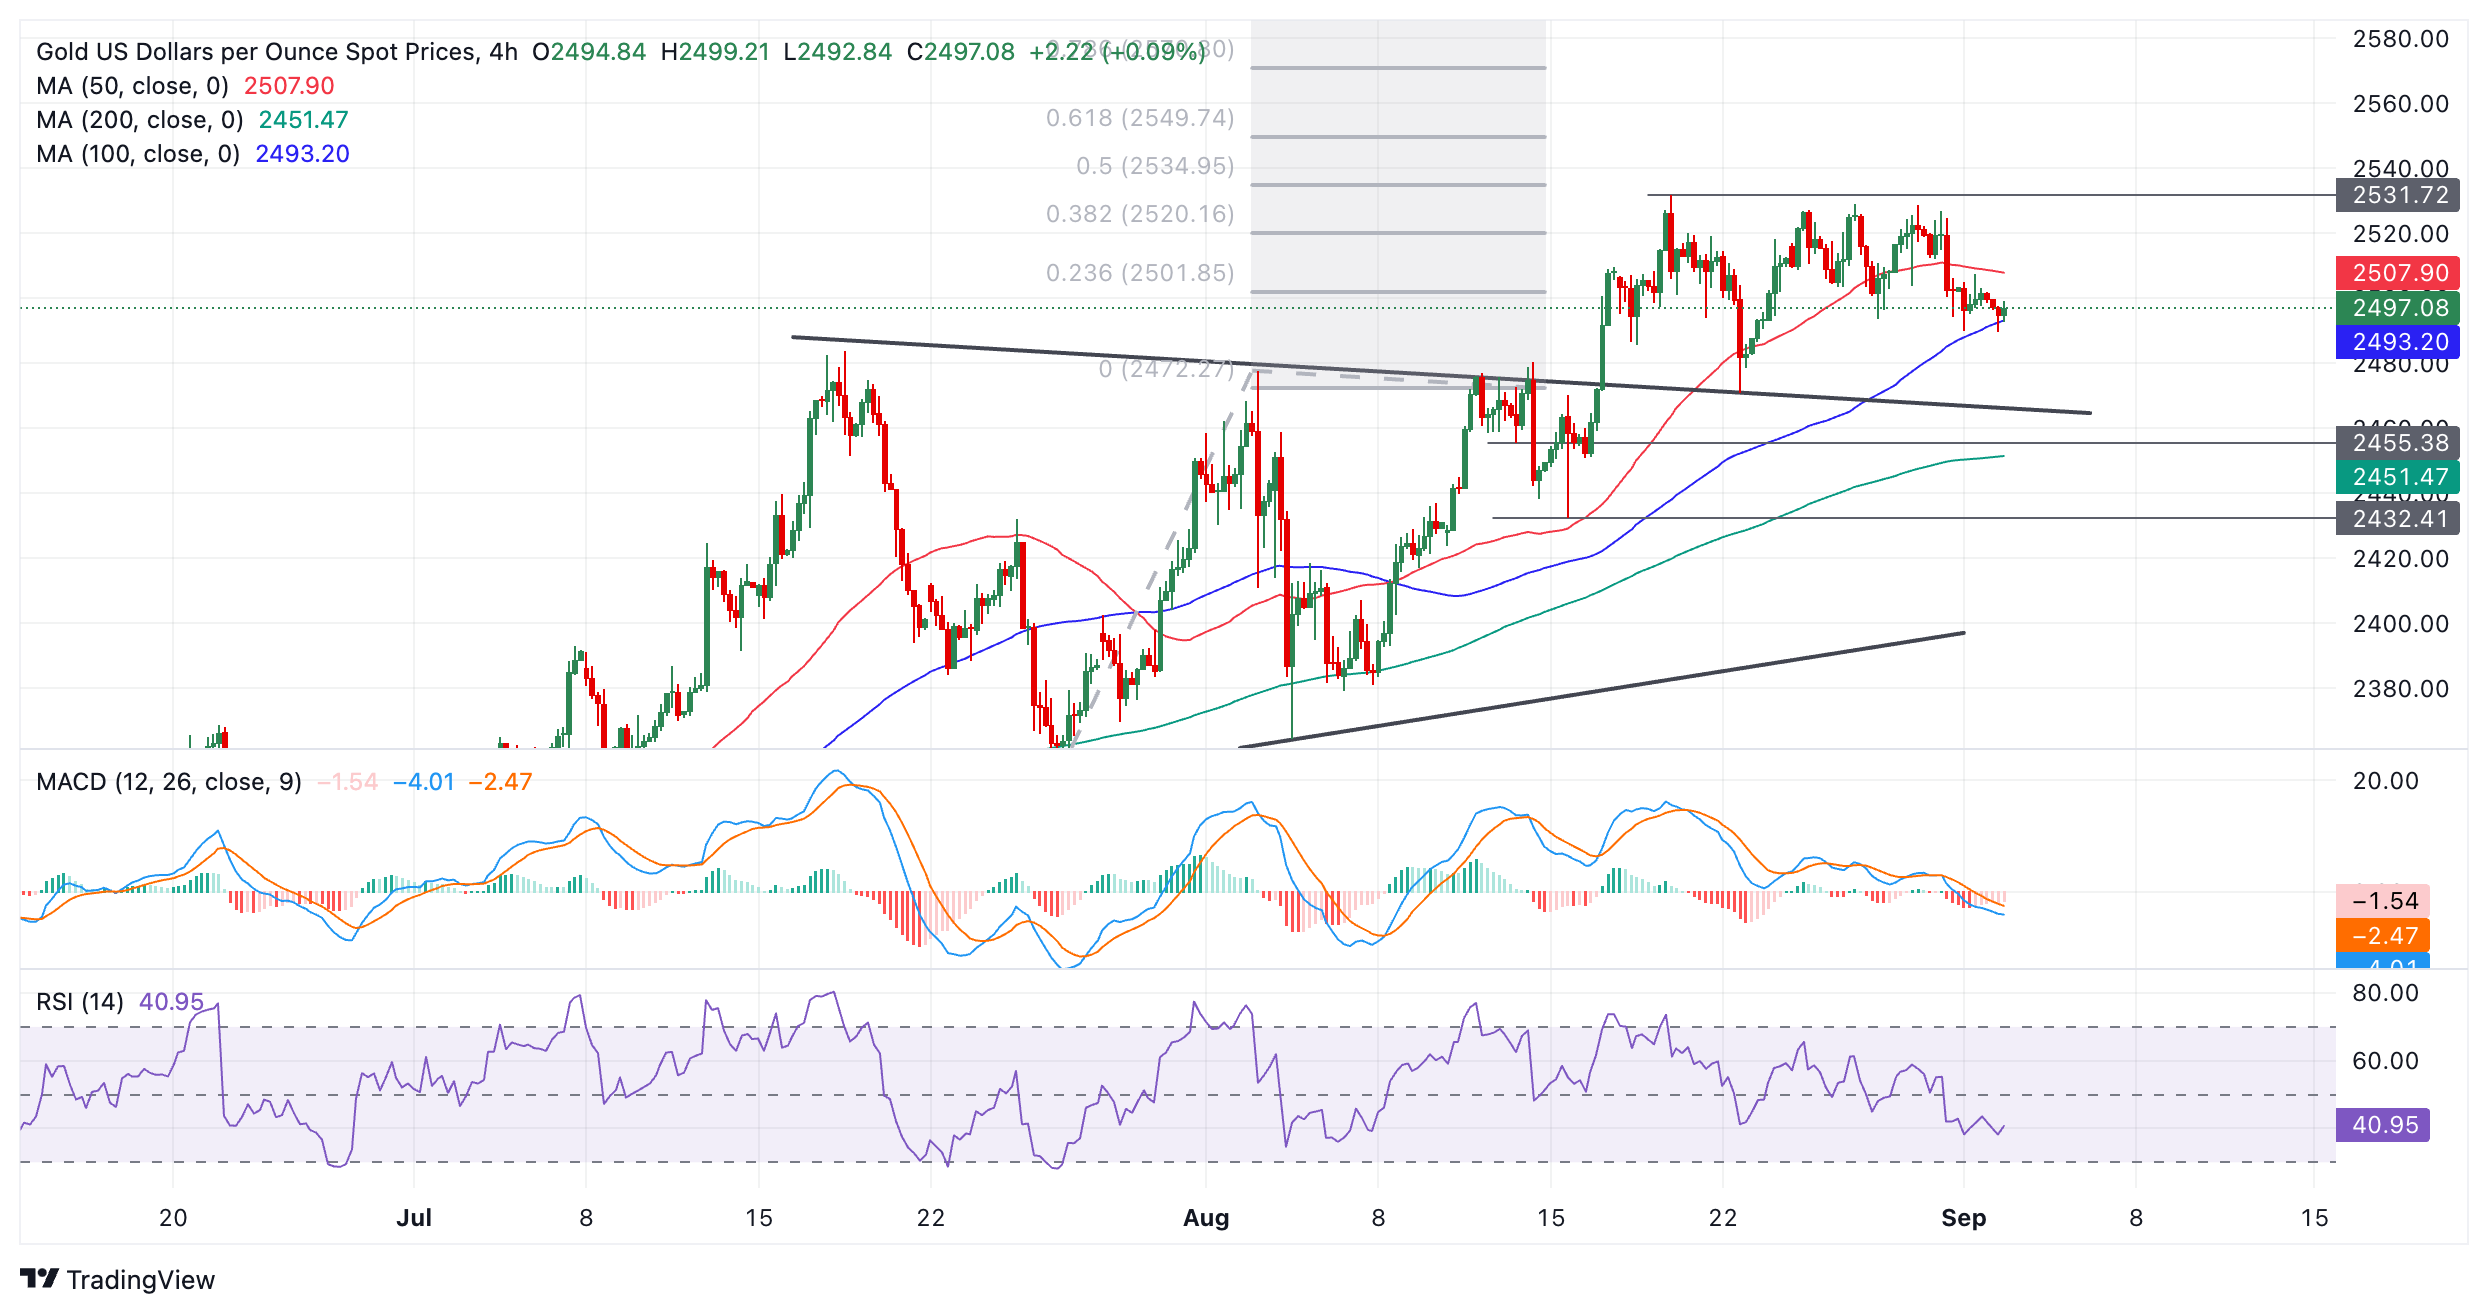
That said, the ultimate as yet un-met upside target for Gold sits at $2,550 and remains active. This was generated after the original breakout from the prior range that started in July, which also looks like a triangle pattern because of its sloping edges.
This upside target was calculated by taking the 0.618 Fibonacci ratio of the range or triangle’s height and extrapolating it higher. This target is the minimum expectation for the follow-through from a breakout based on principles of technical analysis.
Gold’s medium and long-term trends remain bullish, which, given “the trend is your friend,” means the odds favor an eventual breakout higher materializing.
Yet it would require a break above the August 20 all-time high of $2,531 to provide more confirmation of a continuation higher toward the $2,550 target.
Alternatively, a break back inside the previous range would negate the projected upside target. Such a move would be confirmed on a daily close below $2,470 (August 22 low). It would change the picture for Gold and suggest that the commodity might start a short-term downtrend.
Economic Indicator
ISM Manufacturing Employment Index
The Institute for Supply Management (ISM) Manufacturing Index shows business conditions in the US manufacturing sector, taking into account expectations for future production, new orders, inventories, employment and deliveries. It is a significant indicator of the overall economic condition in US. The ISM Manufacturing Employment Index represents business sentiment regarding labor market conditions and is considered a strong Non-Farm Payrolls leading indicator. A high reading is seen as positive for the USD, while a low reading is seen as negative.
Read more.Next release: Tue Sep 03, 2024 14:00
Frequency: Monthly
Consensus: -
Previous: 43.4
Source: Institute for Supply Management
- EUR/USD drops to near 1.1050 as the US Dollar performs strongly ahead of the ISM US Manufacturing PMI release for August.
- The Fed and the ECB are expected to cut interest rates this month.
- This week, investors will focus on the US NFP data for August.
EUR/USD falls back after failing to extend recovery above the immediate resistance of 1.1080 in Tuesday’s European session. The major currency pair drops as the US Dollar (USD) clings to gains to near an almost two-week high as the US Dollar Index (DXY), which tracks the Greenback’s value against six major currencies, trades close to 101.80.
The US Dollar exhibits strength as investors focus on the United States (US) Nonfarm Payrolls (NFP) data for August, which will be published on Friday. Investors will keenly focus on the labor market data to get cues about the likely interest rate cut size by the Federal Reserve (Fed) in the September monetary policy. Market participants remain confident that the US central bank will pivot to policy normalization this month.
According to the CME FedWatch tool, the likelihood of a 50-basis points (bps) interest rate reduction in September is 31%, while the rest favors a 25-bps decline to 5.00%-5.25%. The probability of a large rate cut size has declined from 36% a week earlier, particularly after the revised Q2 Gross Domestic Product (GDP) estimate indicated that the US economy grew at a faster rate of 3% from the preliminary assumption of 2.8%.
In Tuesday’s session, investors will focus on the US S&P Global and ISM Manufacturing Purchasing Managers’ Index (PMI) data for August, which will be published at 13:45 and 14:00 GMT, respectively. The S&P Global PMI, which is a final estimate, is expected at 48.0, similar to the flash estimate.
Meanwhile, the ISM report is expected to show that activities in the manufacturing sector contracted at a slower pace, with the PMI coming in at 47.5 from the prior release of 46.8.
Daily digest market movers: EUR/USD falls as ECB looks set to cut interest rates again
- EUR/USD drops to near 1.1050 in European trading hours. The major currency pair faces severe pressure as the Euro is on the back foot on firm speculation that the European Central Bank (ECB) will cut interest rates this month. This would be the second interest rate cut by the ECB as it pivoted to policy normalization in June, with policymakers remaining confident that price pressures will return to the bank’s target of 2% in 2025.
- Market speculation for ECB interest rate cuts in September has strengthened as Eurozone price pressures have decelerated significantly and signs of a potential recession in Germany have swelled. Eurozone’s headline inflation declined to 2.2% in August due to a sharp decline in energy prices.
- The German economy contracted in the second quarter and is expected to go through a rough phase due to weak demand from domestic and overseas markets.
- Meanwhile, ECB policymakers are also comfortable with market expectations of September rate cuts. Bank of France Governor Francois Villeroy de Galhau said in French magazine Le Point on Friday that “it would be fair and wise to decide in favor of a new rate cut." Villeroy added: "Unfortunately, our growth remains too weak,” and that “the balance of risks still needs to be monitored in Europe,” Reuters reports.
Technical Analysis: EUR/USD seeks support near 20-day EMA
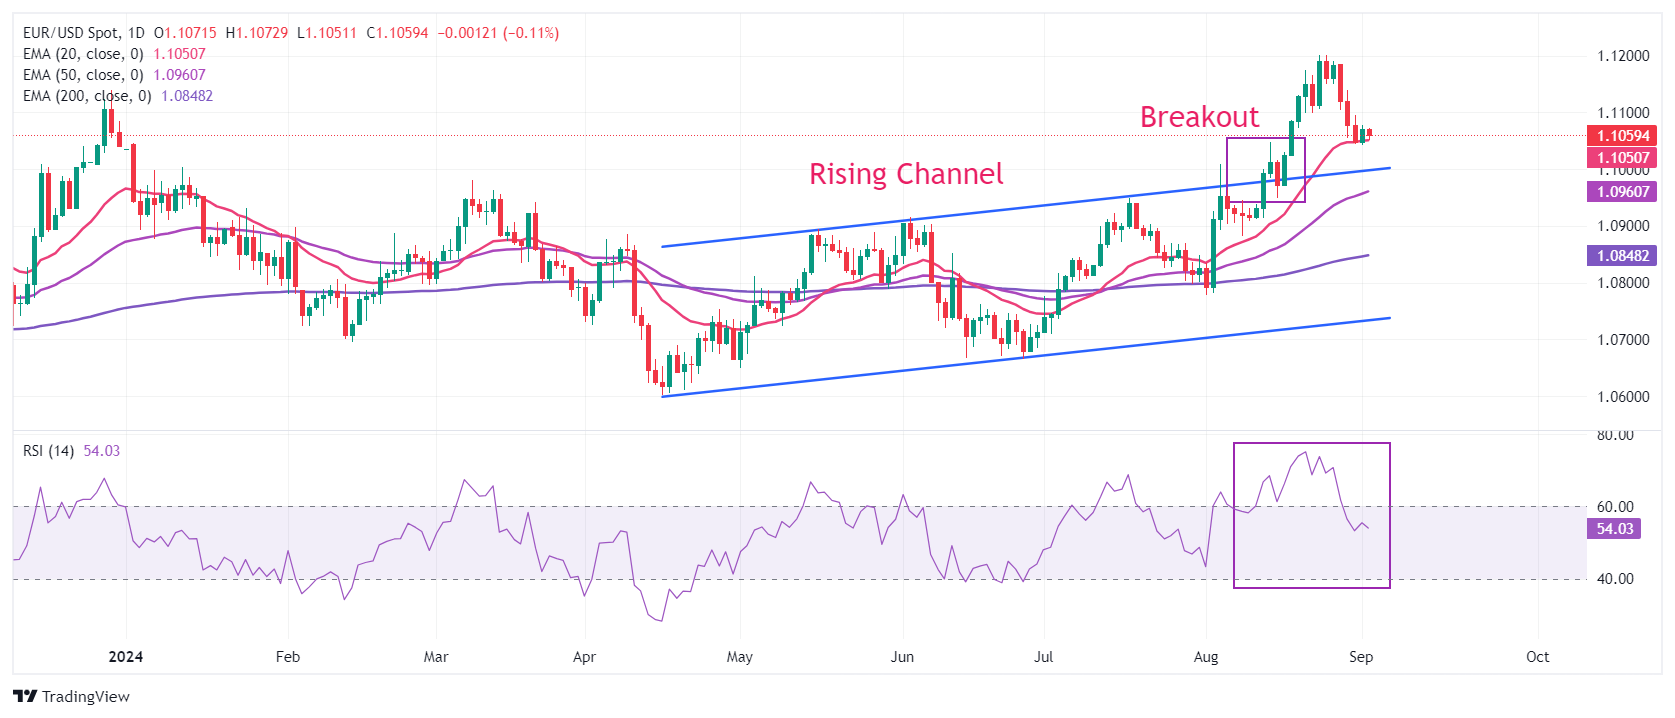
EUR/USD trades inside Monday’s trading range after steading below the crucial resistance of 1.1100. The near-term outlook of the major currency pair is still firm as all short-to-long-term Exponential Moving Averages (EMAs) are sloping higher.
Earlier, the major currency pair strengthened after breaking above the Rising Channel formation on a daily timeframe.
The 14-day Relative Strength Index (RSI) has declined below 60.00 after turning overbought near 75.00.
On the upside, a recent high of 1.1200 and the July 2023 high at 1.1275 will be the next stop for the Euro bulls. Meanwhile, the downside is expected to remain cushioned near the psychological support of 1.1000.
Euro FAQs
The Euro is the currency for the 20 European Union countries that belong to the Eurozone. It is the second most heavily traded currency in the world behind the US Dollar. In 2022, it accounted for 31% of all foreign exchange transactions, with an average daily turnover of over $2.2 trillion a day. EUR/USD is the most heavily traded currency pair in the world, accounting for an estimated 30% off all transactions, followed by EUR/JPY (4%), EUR/GBP (3%) and EUR/AUD (2%).
The European Central Bank (ECB) in Frankfurt, Germany, is the reserve bank for the Eurozone. The ECB sets interest rates and manages monetary policy. The ECB’s primary mandate is to maintain price stability, which means either controlling inflation or stimulating growth. Its primary tool is the raising or lowering of interest rates. Relatively high interest rates – or the expectation of higher rates – will usually benefit the Euro and vice versa. The ECB Governing Council makes monetary policy decisions at meetings held eight times a year. Decisions are made by heads of the Eurozone national banks and six permanent members, including the President of the ECB, Christine Lagarde.
Eurozone inflation data, measured by the Harmonized Index of Consumer Prices (HICP), is an important econometric for the Euro. If inflation rises more than expected, especially if above the ECB’s 2% target, it obliges the ECB to raise interest rates to bring it back under control. Relatively high interest rates compared to its counterparts will usually benefit the Euro, as it makes the region more attractive as a place for global investors to park their money.
Data releases gauge the health of the economy and can impact on the Euro. Indicators such as GDP, Manufacturing and Services PMIs, employment, and consumer sentiment surveys can all influence the direction of the single currency. A strong economy is good for the Euro. Not only does it attract more foreign investment but it may encourage the ECB to put up interest rates, which will directly strengthen the Euro. Otherwise, if economic data is weak, the Euro is likely to fall. Economic data for the four largest economies in the euro area (Germany, France, Italy and Spain) are especially significant, as they account for 75% of the Eurozone’s economy.
Another significant data release for the Euro is the Trade Balance. This indicator measures the difference between what a country earns from its exports and what it spends on imports over a given period. If a country produces highly sought after exports then its currency will gain in value purely from the extra demand created from foreign buyers seeking to purchase these goods. Therefore, a positive net Trade Balance strengthens a currency and vice versa for a negative balance.
Here is what you need to know on Tuesday, September 3:
Financial markets remain quiet on the second trading day of the week. Later in the day, August ISM Manufacturing PMI data from the US will be watched closely by investors. With the long weekend in the US and Canada coming to an end on Tuesday, trading conditions are expected to normalize during the American trading hours.
The US Dollar (USD) Index registered marginal losses on Monday as volumes remained thin. Early Tuesday, the index holds steady above 101.50 and the benchmark 10-year US Treasury bond yield fluctuates at around 3.9%. Meanwhile, US stock index futures trade in negative territory. The ISM Manufacturing PMI is forecast to edge higher to 47.5 in August from 46.8 in July.
US Dollar PRICE Last 7 days
The table below shows the percentage change of US Dollar (USD) against listed major currencies last 7 days. US Dollar was the strongest against the Japanese Yen.
| USD | EUR | GBP | JPY | CAD | AUD | NZD | CHF | |
|---|---|---|---|---|---|---|---|---|
| USD | 0.86% | 0.39% | 1.13% | 0.15% | 0.31% | 0.06% | 0.61% | |
| EUR | -0.86% | -0.46% | 0.26% | -0.72% | -0.54% | -0.83% | -0.24% | |
| GBP | -0.39% | 0.46% | 0.75% | -0.24% | -0.09% | -0.34% | 0.22% | |
| JPY | -1.13% | -0.26% | -0.75% | -0.96% | -0.80% | -1.07% | -0.50% | |
| CAD | -0.15% | 0.72% | 0.24% | 0.96% | 0.16% | -0.09% | 0.48% | |
| AUD | -0.31% | 0.54% | 0.09% | 0.80% | -0.16% | -0.28% | 0.31% | |
| NZD | -0.06% | 0.83% | 0.34% | 1.07% | 0.09% | 0.28% | 0.57% | |
| CHF | -0.61% | 0.24% | -0.22% | 0.50% | -0.48% | -0.31% | -0.57% |
The heat map shows percentage changes of major currencies against each other. The base currency is picked from the left column, while the quote currency is picked from the top row. For example, if you pick the US Dollar from the left column and move along the horizontal line to the Japanese Yen, the percentage change displayed in the box will represent USD (base)/JPY (quote).
In the early European session, the data from Switzerland showed that the annual Consumer Price Index rose 1.1% on a yearly basis in August. This reading followed the 1.3% increase recorded in July and came in below the market expectation of 1.2%. Other data from Switzerland showed that the Gross Domestic Product (GDP) expanded at an annual rate of 1.8% in the second quarter, up from 0.6% in the first quarter. USD/CHF largely ignored these figures and was last seen moving sideways above 0.8500.
After closing the first day of the week in positive territory, EUR/USD struggles to preserve its recovery momentum and edges lower toward 1.1050 in the early European session on Tuesday.
GBP/USD failed to make a decisive move in either direction and ended the day virtually unchanged on Monday. The pair stays on the back foot in the European morning and declines toward 1.3100.
Gold touched its lowest level in a week at $2,490 on Monday but managed to erase a portion of its daily losses. XAU/USD holds steady on Tuesday but remains below $2,500.
USD/JPY closed the fourth consecutive trading day in positive territory on Monday and reached its highest level in nearly two weeks above 147.00. The pair stays under bearish pressure early Tuesday and falls toward 146.00.
US Dollar FAQs
The US Dollar (USD) is the official currency of the United States of America, and the ‘de facto’ currency of a significant number of other countries where it is found in circulation alongside local notes. It is the most heavily traded currency in the world, accounting for over 88% of all global foreign exchange turnover, or an average of $6.6 trillion in transactions per day, according to data from 2022. Following the second world war, the USD took over from the British Pound as the world’s reserve currency. For most of its history, the US Dollar was backed by Gold, until the Bretton Woods Agreement in 1971 when the Gold Standard went away.
The most important single factor impacting on the value of the US Dollar is monetary policy, which is shaped by the Federal Reserve (Fed). The Fed has two mandates: to achieve price stability (control inflation) and foster full employment. Its primary tool to achieve these two goals is by adjusting interest rates. When prices are rising too quickly and inflation is above the Fed’s 2% target, the Fed will raise rates, which helps the USD value. When inflation falls below 2% or the Unemployment Rate is too high, the Fed may lower interest rates, which weighs on the Greenback.
In extreme situations, the Federal Reserve can also print more Dollars and enact quantitative easing (QE). QE is the process by which the Fed substantially increases the flow of credit in a stuck financial system. It is a non-standard policy measure used when credit has dried up because banks will not lend to each other (out of the fear of counterparty default). It is a last resort when simply lowering interest rates is unlikely to achieve the necessary result. It was the Fed’s weapon of choice to combat the credit crunch that occurred during the Great Financial Crisis in 2008. It involves the Fed printing more Dollars and using them to buy US government bonds predominantly from financial institutions. QE usually leads to a weaker US Dollar.
Quantitative tightening (QT) is the reverse process whereby the Federal Reserve stops buying bonds from financial institutions and does not reinvest the principal from the bonds it holds maturing in new purchases. It is usually positive for the US Dollar.
- USD/CHF gathers strength near 0.8525 in Tuesday’s early European session.
- The Swiss CPI rose 1.1% YoY in August; the Swiss economy grew 0.7% YoY in Q2.
- Higher US Treasury bond yields underpin the Greenback, but firmer Fed rate cut bets might cap its upside.
The USD/CHF pair extends its upside amid the firmer US Dollar (USD) around 0.8525 during the early European trading hours on Tuesday. The Swiss inflation was softer than expected in August, but the economy grew stronger than estimated. Investors brace for the US ISM Manufacturing PMI data, which is due later on Tuesday.
Data released by the Swiss Federal Statistical Office on Tuesday showed that the country’s Consumer Price Index (CPI) rose 1.1% YoY in August, compared to the previous reading of 1.3%. This figure was below the market consensus of 1.2%. On a monthly basis, the CPI inflation remains unchanged in August from a decline of 0.2% in July, softer than the expectation of a 0.1% increase.
Furthermore, Switzerland's economy grew at a faster rate than expected in the second quarter (Q2). The Swiss Gross Domestic Product (GDP) expanded by 0.7% QoQ, compared to 0.5% expansion in the previous reading, stronger than the estimation of 0.5%. However, the upbeat Swiss GDP growth data fails to boost the Swiss Franc (CHF) in an immediate reaction to the mixed readings.
On the USD front, higher US Treasury bond yields provide some support to the Greenback. However, the upside of the pair might be limited as traders expect the Federal Reserve (Fed) to cut interest rates in September. The US August Nonfarm Payrolls (NFP) report on Friday could offer more cues about the pace and size of the Fed rate cuts. Financial markets have priced in around 69% chance of a 25 basis points (bps) rate cut by the Fed in September, while the odds of a 50 bps reduction are standing at 31%, according to the CME FedWatch tool.
Canadian Dollar FAQs
The key factors driving the Canadian Dollar (CAD) are the level of interest rates set by the Bank of Canada (BoC), the price of Oil, Canada’s largest export, the health of its economy, inflation and the Trade Balance, which is the difference between the value of Canada’s exports versus its imports. Other factors include market sentiment – whether investors are taking on more risky assets (risk-on) or seeking safe-havens (risk-off) – with risk-on being CAD-positive. As its largest trading partner, the health of the US economy is also a key factor influencing the Canadian Dollar.
The Bank of Canada (BoC) has a significant influence on the Canadian Dollar by setting the level of interest rates that banks can lend to one another. This influences the level of interest rates for everyone. The main goal of the BoC is to maintain inflation at 1-3% by adjusting interest rates up or down. Relatively higher interest rates tend to be positive for the CAD. The Bank of Canada can also use quantitative easing and tightening to influence credit conditions, with the former CAD-negative and the latter CAD-positive.
The price of Oil is a key factor impacting the value of the Canadian Dollar. Petroleum is Canada’s biggest export, so Oil price tends to have an immediate impact on the CAD value. Generally, if Oil price rises CAD also goes up, as aggregate demand for the currency increases. The opposite is the case if the price of Oil falls. Higher Oil prices also tend to result in a greater likelihood of a positive Trade Balance, which is also supportive of the CAD.
While inflation had always traditionally been thought of as a negative factor for a currency since it lowers the value of money, the opposite has actually been the case in modern times with the relaxation of cross-border capital controls. Higher inflation tends to lead central banks to put up interest rates which attracts more capital inflows from global investors seeking a lucrative place to keep their money. This increases demand for the local currency, which in Canada’s case is the Canadian Dollar.
Macroeconomic data releases gauge the health of the economy and can have an impact on the Canadian Dollar. Indicators such as GDP, Manufacturing and Services PMIs, employment, and consumer sentiment surveys can all influence the direction of the CAD. A strong economy is good for the Canadian Dollar. Not only does it attract more foreign investment but it may encourage the Bank of Canada to put up interest rates, leading to a stronger currency. If economic data is weak, however, the CAD is likely to fall.
- USD/CAD gains ground as the Fed is expected to deliver a less aggressive rate cut in September.
- Traders await the US ISM Manufacturing PMI on Tuesday ahead of upcoming US employment data.
- The downside of the commodity-linked CAD would be limited due to higher Oil prices.
USD/CAD extends its gains for the second consecutive day, trading around 1.3520 during the early European hours on Tuesday. This upside of the USD/CAD pair is attributed to the improved US Dollar (USD) amid decreasing odds of an aggressive interest rate cut by the US Federal Reserve rate in September.
Additionally, US Treasury yields continue to rise and provide support for the US Dollar, but its gains may be limited by growing expectations of a quarter-basis point rate cut by the Fed in September. According to the CME FedWatch Tool, markets are nearly 70% confident of at least a 25 basis point (bps) rate cut by the Fed at its September meeting.
However, the decline in the commodity-linked CAD is expected to be limited by rising crude Oil prices. West Texas Intermediate (WTI) Oil has climbed to near $73.60 per barrel at the time of writing, supported by concerns over potential supply disruptions in Libya. Oil exports from key ports were suspended on Monday, and production has been scaled back nationwide, according to six engineers quoted by Reuters.
The Bank of Canada's interest rate decision on Wednesday will be closely monitored. It is widely anticipated that the BoC will reduce interest rates for the third consecutive time during its September meeting. Investors expect the Canadian central bank to lower its benchmark rate by a quarter percentage point to 4.25%, with additional cuts likely throughout the remainder of the year and into 2025.
Canadian Dollar FAQs
The key factors driving the Canadian Dollar (CAD) are the level of interest rates set by the Bank of Canada (BoC), the price of Oil, Canada’s largest export, the health of its economy, inflation and the Trade Balance, which is the difference between the value of Canada’s exports versus its imports. Other factors include market sentiment – whether investors are taking on more risky assets (risk-on) or seeking safe-havens (risk-off) – with risk-on being CAD-positive. As its largest trading partner, the health of the US economy is also a key factor influencing the Canadian Dollar.
The Bank of Canada (BoC) has a significant influence on the Canadian Dollar by setting the level of interest rates that banks can lend to one another. This influences the level of interest rates for everyone. The main goal of the BoC is to maintain inflation at 1-3% by adjusting interest rates up or down. Relatively higher interest rates tend to be positive for the CAD. The Bank of Canada can also use quantitative easing and tightening to influence credit conditions, with the former CAD-negative and the latter CAD-positive.
The price of Oil is a key factor impacting the value of the Canadian Dollar. Petroleum is Canada’s biggest export, so Oil price tends to have an immediate impact on the CAD value. Generally, if Oil price rises CAD also goes up, as aggregate demand for the currency increases. The opposite is the case if the price of Oil falls. Higher Oil prices also tend to result in a greater likelihood of a positive Trade Balance, which is also supportive of the CAD.
While inflation had always traditionally been thought of as a negative factor for a currency since it lowers the value of money, the opposite has actually been the case in modern times with the relaxation of cross-border capital controls. Higher inflation tends to lead central banks to put up interest rates which attracts more capital inflows from global investors seeking a lucrative place to keep their money. This increases demand for the local currency, which in Canada’s case is the Canadian Dollar.
Macroeconomic data releases gauge the health of the economy and can have an impact on the Canadian Dollar. Indicators such as GDP, Manufacturing and Services PMIs, employment, and consumer sentiment surveys can all influence the direction of the CAD. A strong economy is good for the Canadian Dollar. Not only does it attract more foreign investment but it may encourage the Bank of Canada to put up interest rates, leading to a stronger currency. If economic data is weak, however, the CAD is likely to fall.
FX option expiries for Sept 3 NY cut at 10:00 Eastern Time, via DTCC, can be found below.
EUR/USD: EUR amounts
- 1.0950 1.5b
- 1.1050 1.1b
- 1.1070 823m
- 1.1120 1.5b
- 1.1175 735m
- 1.1200 612m
USD/JPY: USD amounts
- 144.00 512m
- 145.00 1.5b
- 148.50 1.1b
USD/CHF: USD amounts
- 0.8400 475m
- 0.8560 903m
- 0.8925 500m
AUD/USD: AUD amounts
- 0.6490 1.2b
- 0.6500 493m
- 0.6675 1.1b
USD/CAD: USD amounts
- 1.3300 449m
- 1.3400 884m
- 1.3500 1.5b
- 1.3620 551m
- 1.3750 798m
NZD/USD: NZD amounts
- 0.5930 930m
- 0.5970 1.5b
- GBP/USD weakens around 1.3125 in Tuesday’s early European session.
- Traders prefer to wait on the sidelines ahead of US ISM PMI data.
- Investors expect no rate cut by the BoE in the September meeting but see another 25 bps rate cut in November.
The GBP/USD pair trades on a weaker note near 1.3125 during the early European session on Tuesday. The sell-off of the major pair is dragged lower by the firmer US Dollar (USD) ahead of the key US economic data. The Bank of England (BoE) Deputy Governor Sarah Breeden is set to speak later on Tuesday, followed by the release of the US ISM Manufacturing Purchasing Managers Index (PMI).
Investors gain more confidence that the US Federal Reserve (Fed) will start easing the monetary policy at its upcoming meeting in September, pricing in the odds of nearly 69% of the 25 basis points (bps) rate cut, according to the CME FedWatch tool. Fed Chair Jerome Powell not only said at the annual Jackson Hole symposium last month that “time has come for policy to adjust.”
The firmer Fed rate cut might weigh on the Greenback in the near term. Rabobank analysts currently expect four Fed rate cuts between September and January and then hold for the rest of 2025. Friday's US Nonfarm Payrolls (NFP) report will be more significant than usual and might offer some hints about the size and pace of the Fed rate cut. The US economy is expected to see 163K job additions in August, while the Unemployment Rate is expected to tick lower to 4.2%.
On the other hand, the markets anticipate no rate cut by the BoE in the September meeting, while the possibility of a 25 bps rate cut in the November meeting stands at 87.2%. In the absence of top-tier economic data releases from the UK this week, the USD price dynamic will be the main driver for the GBP/USD.
Pound Sterling FAQs
The Pound Sterling (GBP) is the oldest currency in the world (886 AD) and the official currency of the United Kingdom. It is the fourth most traded unit for foreign exchange (FX) in the world, accounting for 12% of all transactions, averaging $630 billion a day, according to 2022 data. Its key trading pairs are GBP/USD, aka ‘Cable’, which accounts for 11% of FX, GBP/JPY, or the ‘Dragon’ as it is known by traders (3%), and EUR/GBP (2%). The Pound Sterling is issued by the Bank of England (BoE).
The single most important factor influencing the value of the Pound Sterling is monetary policy decided by the Bank of England. The BoE bases its decisions on whether it has achieved its primary goal of “price stability” – a steady inflation rate of around 2%. Its primary tool for achieving this is the adjustment of interest rates. When inflation is too high, the BoE will try to rein it in by raising interest rates, making it more expensive for people and businesses to access credit. This is generally positive for GBP, as higher interest rates make the UK a more attractive place for global investors to park their money. When inflation falls too low it is a sign economic growth is slowing. In this scenario, the BoE will consider lowering interest rates to cheapen credit so businesses will borrow more to invest in growth-generating projects.
Data releases gauge the health of the economy and can impact the value of the Pound Sterling. Indicators such as GDP, Manufacturing and Services PMIs, and employment can all influence the direction of the GBP. A strong economy is good for Sterling. Not only does it attract more foreign investment but it may encourage the BoE to put up interest rates, which will directly strengthen GBP. Otherwise, if economic data is weak, the Pound Sterling is likely to fall.
Another significant data release for the Pound Sterling is the Trade Balance. This indicator measures the difference between what a country earns from its exports and what it spends on imports over a given period. If a country produces highly sought-after exports, its currency will benefit purely from the extra demand created from foreign buyers seeking to purchase these goods. Therefore, a positive net Trade Balance strengthens a currency and vice versa for a negative balance.
- Silver price faces challenges as daily chart analysis suggests a bearish bias.
- The MACD line has crossed below the signal line, indicating potential downward pressure on the Silver price.
- Silver price may navigate the area around the lower boundary of the descending channel at the level of $27.70 level.
Silver price (XAG/USD) extends its losses for the third consecutive day, trading around $28.50 per troy ounce during Tuesday’s Asian hours. The analysis of the daily chart shows that the pair is positioned within a descending channel, suggesting a bearish bias. Additionally, the 14-day Relative Strength Index (RSI) is positioned below the 50 level, confirming a bearish trend.
The momentum indicator Moving Average Convergence Divergence (MACD) line has crossed below the signal line, it is generally considered a bearish signal. This crossover suggests that the momentum is shifting from bullish to bearish, indicating potential downward pressure on the Silver's price.
In terms of support, the Silver price may navigate the region around the lower boundary of the descending channel at the level of $27.70 level. A break below this level could strengthen the bearish bias and drive the asset’s price toward throwback support $26.50 level.
On the upside, the Silver price tests an immediate resistance at the upper boundary of the descending channel around the nine-day Exponential Moving Average (EMA) at the $28.97 level. A breakthrough above the latter could lead the XAG/USD pair to explore the region around the three-month high at the $31.76 level.
XAG/USD: Daily Chart
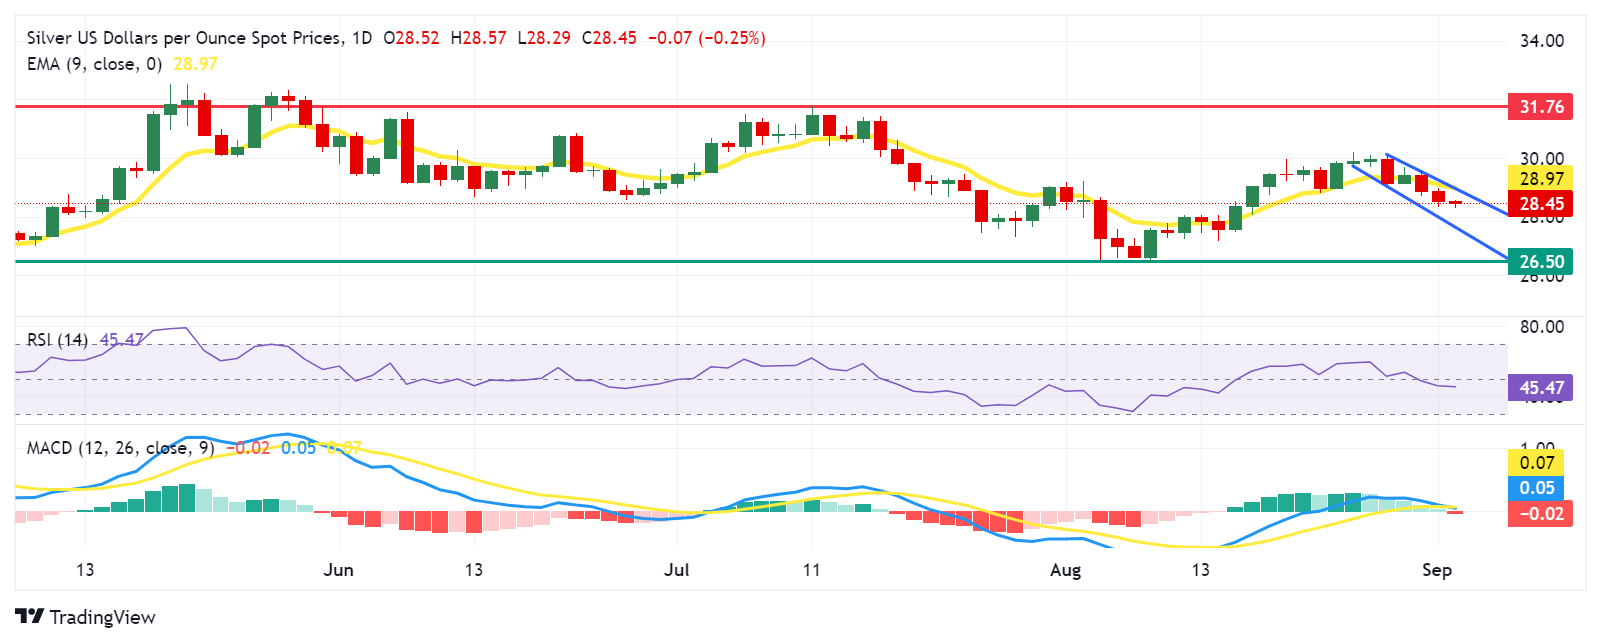
Silver FAQs
Silver is a precious metal highly traded among investors. It has been historically used as a store of value and a medium of exchange. Although less popular than Gold, traders may turn to Silver to diversify their investment portfolio, for its intrinsic value or as a potential hedge during high-inflation periods. Investors can buy physical Silver, in coins or in bars, or trade it through vehicles such as Exchange Traded Funds, which track its price on international markets.
Silver prices can move due to a wide range of factors. Geopolitical instability or fears of a deep recession can make Silver price escalate due to its safe-haven status, although to a lesser extent than Gold's. As a yieldless asset, Silver tends to rise with lower interest rates. Its moves also depend on how the US Dollar (USD) behaves as the asset is priced in dollars (XAG/USD). A strong Dollar tends to keep the price of Silver at bay, whereas a weaker Dollar is likely to propel prices up. Other factors such as investment demand, mining supply – Silver is much more abundant than Gold – and recycling rates can also affect prices.
Silver is widely used in industry, particularly in sectors such as electronics or solar energy, as it has one of the highest electric conductivity of all metals – more than Copper and Gold. A surge in demand can increase prices, while a decline tends to lower them. Dynamics in the US, Chinese and Indian economies can also contribute to price swings: for the US and particularly China, their big industrial sectors use Silver in various processes; in India, consumers’ demand for the precious metal for jewellery also plays a key role in setting prices.
Silver prices tend to follow Gold's moves. When Gold prices rise, Silver typically follows suit, as their status as safe-haven assets is similar. The Gold/Silver ratio, which shows the number of ounces of Silver needed to equal the value of one ounce of Gold, may help to determine the relative valuation between both metals. Some investors may consider a high ratio as an indicator that Silver is undervalued, or Gold is overvalued. On the contrary, a low ratio might suggest that Gold is undervalued relative to Silver.
Gold prices fell in India on Tuesday, according to data compiled by FXStreet.
The price for Gold stood at 6,739.57 Indian Rupees (INR) per gram, down compared with the INR 6,747.59 it cost on Monday.
The price for Gold decreased to INR 78,609.07 per tola from INR 78,702.57 per tola a day earlier.
| Unit measure | Gold Price in INR |
|---|---|
| 1 Gram | 6,739.57 |
| 10 Grams | 67,395.74 |
| Tola | 78,609.07 |
| Troy Ounce | 209,624.30 |
FXStreet calculates Gold prices in India by adapting international prices (USD/INR) to the local currency and measurement units. Prices are updated daily based on the market rates taken at the time of publication. Prices are just for reference and local rates could diverge slightly.
Gold FAQs
Gold has played a key role in human’s history as it has been widely used as a store of value and medium of exchange. Currently, apart from its shine and usage for jewelry, the precious metal is widely seen as a safe-haven asset, meaning that it is considered a good investment during turbulent times. Gold is also widely seen as a hedge against inflation and against depreciating currencies as it doesn’t rely on any specific issuer or government.
Central banks are the biggest Gold holders. In their aim to support their currencies in turbulent times, central banks tend to diversify their reserves and buy Gold to improve the perceived strength of the economy and the currency. High Gold reserves can be a source of trust for a country’s solvency. Central banks added 1,136 tonnes of Gold worth around $70 billion to their reserves in 2022, according to data from the World Gold Council. This is the highest yearly purchase since records began. Central banks from emerging economies such as China, India and Turkey are quickly increasing their Gold reserves.
Gold has an inverse correlation with the US Dollar and US Treasuries, which are both major reserve and safe-haven assets. When the Dollar depreciates, Gold tends to rise, enabling investors and central banks to diversify their assets in turbulent times. Gold is also inversely correlated with risk assets. A rally in the stock market tends to weaken Gold price, while sell-offs in riskier markets tend to favor the precious metal.
The price can move due to a wide range of factors. Geopolitical instability or fears of a deep recession can quickly make Gold price escalate due to its safe-haven status. As a yield-less asset, Gold tends to rise with lower interest rates, while higher cost of money usually weighs down on the yellow metal. Still, most moves depend on how the US Dollar (USD) behaves as the asset is priced in dollars (XAU/USD). A strong Dollar tends to keep the price of Gold controlled, whereas a weaker Dollar is likely to push Gold prices up.
(An automation tool was used in creating this post.)
- NZD/USD extends losses as traders expect that the Fed will not deliver a 50 basis points rate cut in September.
- Traders await the US ISM Manufacturing PMI on Tuesday ahead of upcoming US employment data.
- New Zealand’s Terms of Trade Index rose by 2.1% QoQ in Q2, swinging from a previous 5.1% decline.
NZD/USD continues to lose ground for the third successive session, trading around 0.6200 during the Asian hours on Tuesday. The US Dollar (USD) receives support from diminishing odds of an aggressive interest rate cut by the US Federal Reserve rate in September.
Traders await the ISM Manufacturing PMI data due later in the day. The focus will shift to upcoming US employment data, particularly the August Nonfarm Payrolls (NFP), for further insights into the potential timing and scale of Fed rate cuts.
US Treasury yields continue to rise and provide support for the US Dollar, but its gains may be limited by growing expectations of a 25 basis point rate cut by the Fed in September. According to the CME FedWatch Tool, markets are nearly 70% confident of at least a 25 basis point (bps) rate cut by the Fed at its September meeting.
In New Zealand, the Terms of Trade Index increased by 2.1% quarter-on-quarter in Q2, rebounding from a 5.1% decline in the previous quarter and surpassing market expectations of a 2.0% rise. Export prices saw a significant increase of 5.2% in the second quarter, recovering from a 0.3% decrease in the March quarter. Import prices also rebounded, rising by 3.1% after a sharp 5.1% drop in the prior period.
New Zealand's NZX 50 Index consolidates, hovering around 12,500, due to a lack of global drivers with Wall Street closed for Monday’s break. Traders assess July manufacturing PMI data from China, a key trading partner. Official figures indicated the sharpest contraction in factory activity in six months, while private survey readings suggested that the manufacturing sector had expanded for the seventh time this year.
New Zealand Dollar FAQs
The New Zealand Dollar (NZD), also known as the Kiwi, is a well-known traded currency among investors. Its value is broadly determined by the health of the New Zealand economy and the country’s central bank policy. Still, there are some unique particularities that also can make NZD move. The performance of the Chinese economy tends to move the Kiwi because China is New Zealand’s biggest trading partner. Bad news for the Chinese economy likely means less New Zealand exports to the country, hitting the economy and thus its currency. Another factor moving NZD is dairy prices as the dairy industry is New Zealand’s main export. High dairy prices boost export income, contributing positively to the economy and thus to the NZD.
The Reserve Bank of New Zealand (RBNZ) aims to achieve and maintain an inflation rate between 1% and 3% over the medium term, with a focus to keep it near the 2% mid-point. To this end, the bank sets an appropriate level of interest rates. When inflation is too high, the RBNZ will increase interest rates to cool the economy, but the move will also make bond yields higher, increasing investors’ appeal to invest in the country and thus boosting NZD. On the contrary, lower interest rates tend to weaken NZD. The so-called rate differential, or how rates in New Zealand are or are expected to be compared to the ones set by the US Federal Reserve, can also play a key role in moving the NZD/USD pair.
Macroeconomic data releases in New Zealand are key to assess the state of the economy and can impact the New Zealand Dollar’s (NZD) valuation. A strong economy, based on high economic growth, low unemployment and high confidence is good for NZD. High economic growth attracts foreign investment and may encourage the Reserve Bank of New Zealand to increase interest rates, if this economic strength comes together with elevated inflation. Conversely, if economic data is weak, NZD is likely to depreciate.
The New Zealand Dollar (NZD) tends to strengthen during risk-on periods, or when investors perceive that broader market risks are low and are optimistic about growth. This tends to lead to a more favorable outlook for commodities and so-called ‘commodity currencies’ such as the Kiwi. Conversely, NZD tends to weaken at times of market turbulence or economic uncertainty as investors tend to sell higher-risk assets and flee to the more-stable safe havens.
- Indian Rupee edges lower in Tuesday’s Asian session.
- Indian foreign inflows and lower crude oil prices might support the INR.
- Investors will focus on the Indian August HSBC Services PMI, US ISM Manufacturing PMI, which are due later on Tuesday.
The Indian Rupee (INR) weakens on Tuesday, pressured by the recovery of the Greenback. The positive Indian equity market, the inflow of foreign funds and a decline in crude oil prices could limit the INR’s losses. However, the increased US Dollar (USD) demand by the importer, and safe-haven flows ahead of the key US labor market data, might weigh on the local currency.
The Indian August HSBC Services PMI will be released on Tuesday ahead of the US ISM Manufacturing PMI. All eyes will be on the US labor market reports on Friday, including the Nonfarm Payrolls (NFP), Unemployment Rate and Average Hourly Earnings for August. The Federal Reserve (Fed) Chair Jerome Powell's comments at Jackson Hole last month have made this Friday's NFP report more significant than usual. A weaker-than-expected outcome could trigger the market to price in a larger rate cut, exerting selling pressure on the USD.
Daily Digest Market Movers: Indian Rupee remains on the defensive amid global factors
- The HSBC India Manufacturing Purchasing Managers Index (PMI) eased to a three-month low at 57.5 in August. This figure came in weaker than the expectations and the previous reading of 57.9.
- “New orders and output also mirrored the headline trend, with some panellists citing fierce competition as a reason for slowdown," noted Pranjul Bhandari, chief India economist at HSBC.”
- HSBC India Services PMI is estimated to improve to 60.4 in August from 60.3 in July.
- The US ISM Manufacturing PMI for August is projected to rise to 47.5 in August versus 46.8 prior, while the Services PMI is forecasted to ease to 51.1 in August from 51.4 in July.
- The market currently expects the Fed to cut interest rates by 25 basis points (bps) in September, pricing in odds of nearly 69%, according to the CME FedWatch tool.
Technical Analysis: USD/INR in consolidative mode, longer-term bullish potential intact
The Indian Rupee trades on a softer note on the day. The USD/INR pair keeps the bullish vibe on the daily timeframe, characterized by the price holding above the key 100-day Exponential Moving Average (EMA) and the 14-day Relative Strength Index (RSI) standing above the midline.
The potential upside barrier for USD/INR is seen at the 84.00 psychological figure. Any follow-through buying above this level could expose 84.50.
In the bearish case, the first downside target is located at 83.84, the low of August 30. Further south, the next cushion level emerges at the 100-day EMA at 83.62.
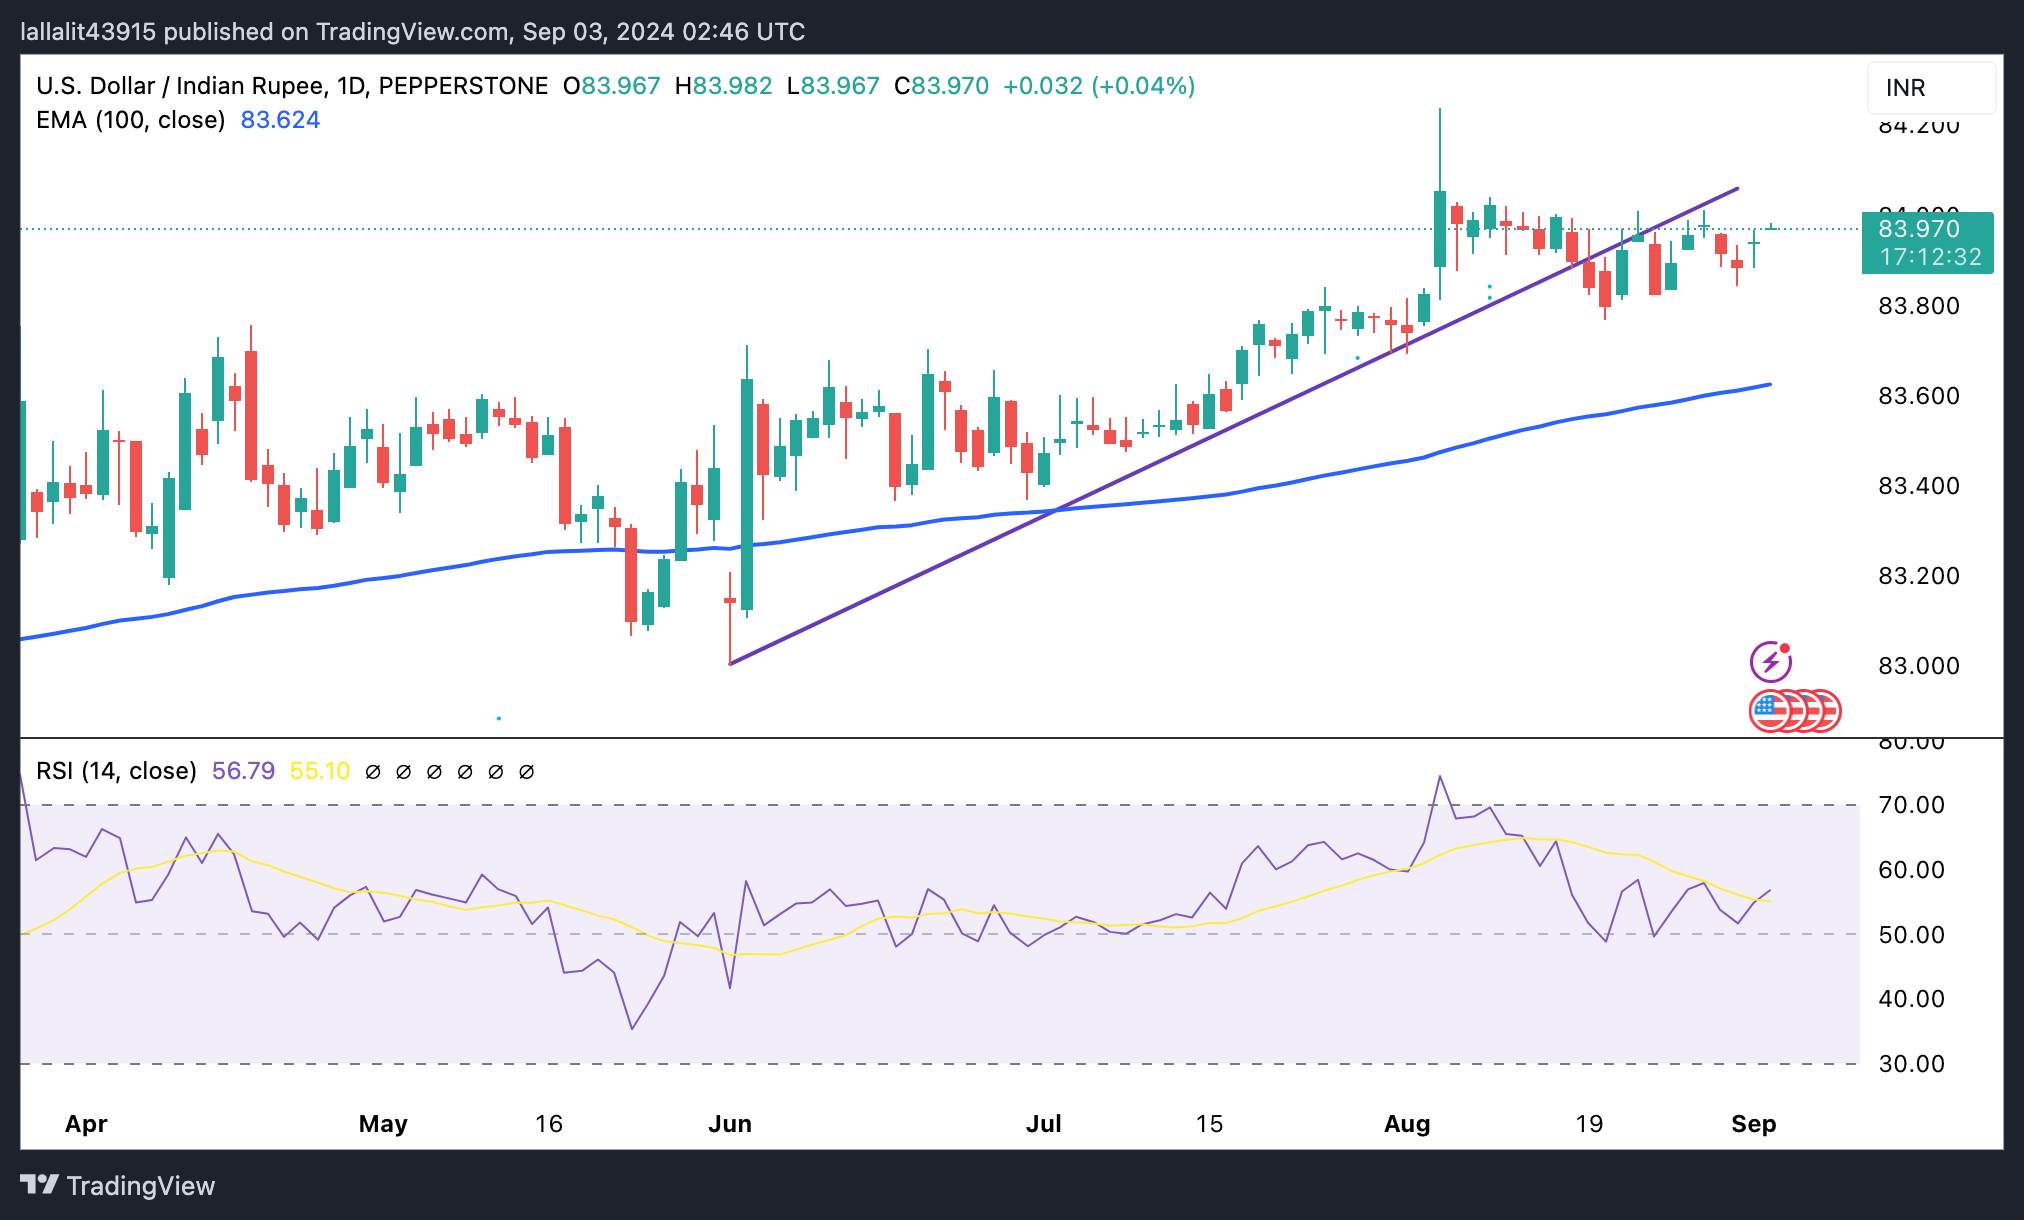
Indian Rupee FAQs
The Indian Rupee (INR) is one of the most sensitive currencies to external factors. The price of Crude Oil (the country is highly dependent on imported Oil), the value of the US Dollar – most trade is conducted in USD – and the level of foreign investment, are all influential. Direct intervention by the Reserve Bank of India (RBI) in FX markets to keep the exchange rate stable, as well as the level of interest rates set by the RBI, are further major influencing factors on the Rupee.
The Reserve Bank of India (RBI) actively intervenes in forex markets to maintain a stable exchange rate, to help facilitate trade. In addition, the RBI tries to maintain the inflation rate at its 4% target by adjusting interest rates. Higher interest rates usually strengthen the Rupee. This is due to the role of the ‘carry trade’ in which investors borrow in countries with lower interest rates so as to place their money in countries’ offering relatively higher interest rates and profit from the difference.
Macroeconomic factors that influence the value of the Rupee include inflation, interest rates, the economic growth rate (GDP), the balance of trade, and inflows from foreign investment. A higher growth rate can lead to more overseas investment, pushing up demand for the Rupee. A less negative balance of trade will eventually lead to a stronger Rupee. Higher interest rates, especially real rates (interest rates less inflation) are also positive for the Rupee. A risk-on environment can lead to greater inflows of Foreign Direct and Indirect Investment (FDI and FII), which also benefit the Rupee.
Higher inflation, particularly, if it is comparatively higher than India’s peers, is generally negative for the currency as it reflects devaluation through oversupply. Inflation also increases the cost of exports, leading to more Rupees being sold to purchase foreign imports, which is Rupee-negative. At the same time, higher inflation usually leads to the Reserve Bank of India (RBI) raising interest rates and this can be positive for the Rupee, due to increased demand from international investors. The opposite effect is true of lower inflation.
- The Japanese Yen edges higher as the government will allocate ¥989 billion to fund energy subsidies.
- The JPY faced challenges as weak Japanese manufacturing data fueled speculation that the BoJ might postpone further rate hikes.
- The US Dollar receives support from improving Treasury yields.
The Japanese Yen (JPY) ended its four-day losing streak, edging higher against the US Dollar (USD) on Tuesday. However, the JPY encountered headwinds as weak Japanese manufacturing data fueled speculation that the Bank of Japan (BoJ) might postpone further rate hikes.
Japan will allocate ¥989 billion to fund energy subsidies in response to rising energy costs and the resulting cost-of-living pressures. This government intervention could potentially contribute to inflation. The Bank of Japan's (BoJ) hawkish monetary policy stance has been further reinforced by a recent increase in Tokyo's inflation. Meanwhile, Japanese companies reported a sharp rise in capital spending for the second quarter.
The downside of the USD/JPY pair could be restrained as the US Dollar strengthens amid improving Treasury yields. Traders will focus on upcoming US employment data, particularly the August Nonfarm Payrolls (NFP), for further insights into the potential timing and scale of Fed rate cuts.
Daily Digest Market Movers: Japanese Yen edges higher due to hawkish BoJ
- The US Bureau of Economic Analysis reported on Friday that the headline Personal Consumption Expenditures (PCE) Price Index increased by 2.5% year-over-year in July, matching the previous reading of 2.5% but falling short of the estimated 2.6%. Meanwhile, the core PCE, which excludes volatile food and energy prices, rose by 2.6% year-over-year in July, consistent with the prior figure of 2.6% but slightly below the consensus forecast of 2.7%.
- Tokyo's Consumer Price Index (CPI) increased to 2.6% year-on-year in August, up from 2.2% in July. Core CPI also rose to 1.6% YoY in August, compared to the previous 1.5%. Additionally, Japan’s Unemployment Rate unexpectedly climbed to 2.7% in July, up from both the market estimate and June's 2.5%, marking the highest jobless rate since August 2023.
- Federal Reserve Bank of Atlanta President Raphael Bostic, a prominent hawk on the FOMC, indicated last week that it might be "time to move" on rate cuts due to further cooling inflation and a higher-than-expected unemployment rate. FXStreet’s FedTracker, which gauges the tone of Fed officials’ speeches on a dovish-to-hawkish scale from 0 to 10 using a custom AI model, rated Bostic’s words as neutral with a score of 5.6.
- The US Gross Domestic Product (GDP) grew at an annualized rate of 3.0% in the second quarter, exceeding both the expected and previous growth rate of 2.8%. Additionally, Initial Jobless Claims showed that the number of people filing for unemployment benefits fell to 231,000 for the week ending August 23, down from the previous 233,000 and slightly below the expected 232,000.
- Japan’s Finance Minister Shunichi Suzuki stated last week that foreign exchange rates are influenced by a variety of factors, including monetary policies, interest rate differentials, geopolitical risks, and market sentiment. Suzuki added that it is difficult to predict how these factors will impact FX rates.
Technical Analysis: USD/JPY tests the 21-day EMA resistance near 147.00
USD/JPY trades around 146.70 on Tuesday. Daily chart analysis shows the nine-day Exponential Moving Average (EMA) is lower than the 21-day EMA, indicating a bearish trend in the market. Additionally, the 14-day Relative Strength Index (RSI) remains below 50, indicating that the bearish trend is still in effect.
In terms of support, the USD/JPY pair might first test the nine-day Exponential Moving Average (EMA) at around 145.91. If the pair falls below this level, it could move toward the seven-month low of 141.69, recorded on August 5, and subsequently find the next support level around 140.25.
On the upside, the USD/JPY pair may test the immediate barrier at the 21-day EMA at 146.97. A break above this level could support the pair to approach the psychological level of 150.00 level, followed by the 154.50 level, which has shifted from support to resistance.
USD/JPY: Daily Chart
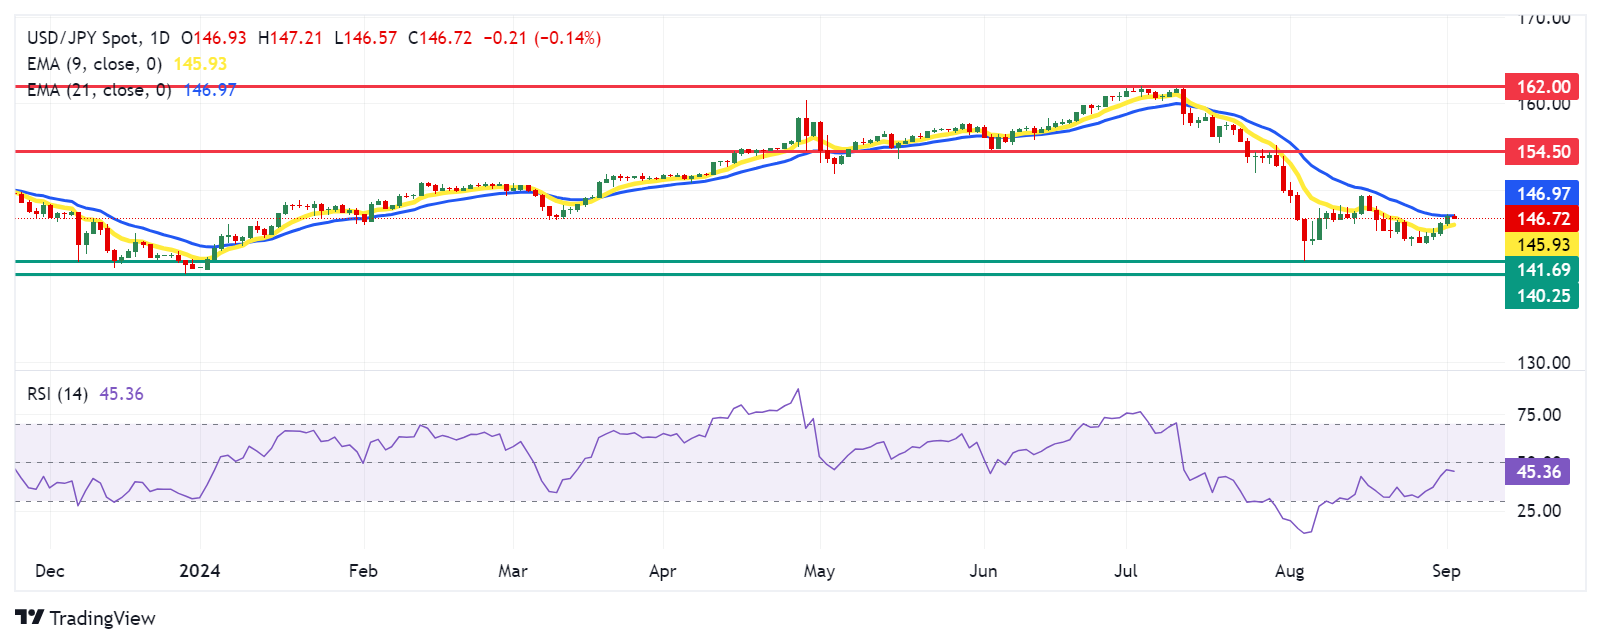
Japanese Yen PRICE Today
The table below shows the percentage change of Japanese Yen (JPY) against listed major currencies today. Japanese Yen was the strongest against the Australian Dollar.
| USD | EUR | GBP | JPY | CAD | AUD | NZD | CHF | |
|---|---|---|---|---|---|---|---|---|
| USD | 0.05% | 0.07% | -0.22% | 0.12% | 0.34% | 0.37% | 0.13% | |
| EUR | -0.05% | 0.00% | -0.24% | 0.06% | 0.27% | 0.22% | 0.06% | |
| GBP | -0.07% | -0.01% | -0.25% | 0.06% | 0.26% | 0.22% | 0.07% | |
| JPY | 0.22% | 0.24% | 0.25% | 0.32% | 0.52% | 0.38% | 0.31% | |
| CAD | -0.12% | -0.06% | -0.06% | -0.32% | 0.19% | 0.06% | 0.00% | |
| AUD | -0.34% | -0.27% | -0.26% | -0.52% | -0.19% | -0.16% | -0.20% | |
| NZD | -0.37% | -0.22% | -0.22% | -0.38% | -0.06% | 0.16% | -0.04% | |
| CHF | -0.13% | -0.06% | -0.07% | -0.31% | -0.01% | 0.20% | 0.04% |
The heat map shows percentage changes of major currencies against each other. The base currency is picked from the left column, while the quote currency is picked from the top row. For example, if you pick the Japanese Yen from the left column and move along the horizontal line to the US Dollar, the percentage change displayed in the box will represent JPY (base)/USD (quote).
Japanese Yen FAQs
The Japanese Yen (JPY) is one of the world’s most traded currencies. Its value is broadly determined by the performance of the Japanese economy, but more specifically by the Bank of Japan’s policy, the differential between Japanese and US bond yields, or risk sentiment among traders, among other factors.
One of the Bank of Japan’s mandates is currency control, so its moves are key for the Yen. The BoJ has directly intervened in currency markets sometimes, generally to lower the value of the Yen, although it refrains from doing it often due to political concerns of its main trading partners. The current BoJ ultra-loose monetary policy, based on massive stimulus to the economy, has caused the Yen to depreciate against its main currency peers. This process has exacerbated more recently due to an increasing policy divergence between the Bank of Japan and other main central banks, which have opted to increase interest rates sharply to fight decades-high levels of inflation.
The BoJ’s stance of sticking to ultra-loose monetary policy has led to a widening policy divergence with other central banks, particularly with the US Federal Reserve. This supports a widening of the differential between the 10-year US and Japanese bonds, which favors the US Dollar against the Japanese Yen.
The Japanese Yen is often seen as a safe-haven investment. This means that in times of market stress, investors are more likely to put their money in the Japanese currency due to its supposed reliability and stability. Turbulent times are likely to strengthen the Yen’s value against other currencies seen as more risky to invest in.
| Raw materials | Closed | Change, % |
|---|---|---|
| Silver | 28.521 | -0.96 |
| Gold | 249.958 | -0.13 |
| Palladium | 979.25 | 1.57 |
- Gold price trades in negative territory for the third consecutive day in Tuesday’s early Asian session.
- The rising US Fed rate cut bets and geopolitical risks might help limit Gold’s losses.
- Investors await the US August ISM PMI for fresh impetus.
The Gold price (XAU/USD) loses ground amid the stronger US Dollar (USD) and higher US Treasury bond yields on Tuesday. Nonetheless, the anticipation that the US Federal Reserve (Fed) will cut interest rates in September might underpin the precious metal price as lower interest rates reduce the opportunity cost of holding non-yielding gold. Additionally, the ongoing geopolitical tensions in the Middle East might boost safe-haven assets like Gold.
Looking ahead, the Institute for Supply Management’s (ISM) Manufacturing Purchasing Managers Index (PMI) will be published on Tuesday. The highlight for this week will be the US Nonfarm Payrolls (NFP) for August, which might determine the pace of the interest rate cut by the Fed and could influence the Gold price in the near term.
Daily Digest Market Movers: Gold price faces selling pressure amid the rebound of USD
- Protests broke out across Israel in fresh fury on Monday over the government’s failure to secure a ceasefire-for-hostages deal with Hamas, per CNN. The move is fuelled by the killing in Gaza of six hostages, whose bodies were retrieved by Israeli soldiers this weekend.
- China's Caixin Manufacturing PMI climbed to 50.4 in August from 49.8 in July, above the market consensus of 50.0.
- The US ISM Manufacturing PMI for August is expected to improve to 47.5 in August from 46.8 in July, while the Services PMI is estimated to drop to 51.1 in August versus 51.4 prior.
- The US economy is expected to see 163K job additions in August. The Unemployment Rate is expected to tick lower to 4.2%.
- The markets are now pricing in a nearly 69% possibility of 25 basis points (bps) rate cut by the Fed in September, while the chance of a 50 bps reduction are standing at 31%, according to the CME FedWatch tool.
Technical Analysis: Gold price maintains positive momentum in the longer term
The Gold price drifts lower on the day. According to the daily chart, the constructive outlook of the precious metal prevails as the price is well above the key 100-day Exponential Moving Average (EMA). The upward momentum is reinforced by the 14-day Relative Strength Index (RSI), which stands above the midline around 55.70, suggesting the climb is more likely to resume than to reverse.
The key resistance level for XAU/USD emerges in the $2,530-$2,540 zone, portraying the five-month-old ascending channel’s upper boundary and the all-time high. A decisive break above the mentioned level could see a rally to the $2,600 psychological level.
On the flip side, the low of August 22 at $2,470 acts as an initial support level for the yellow metal. A break below this level could drag the price further south to $2,432, the low of August 15. The next contention level to watch is $2,372, the 100-day EMA.
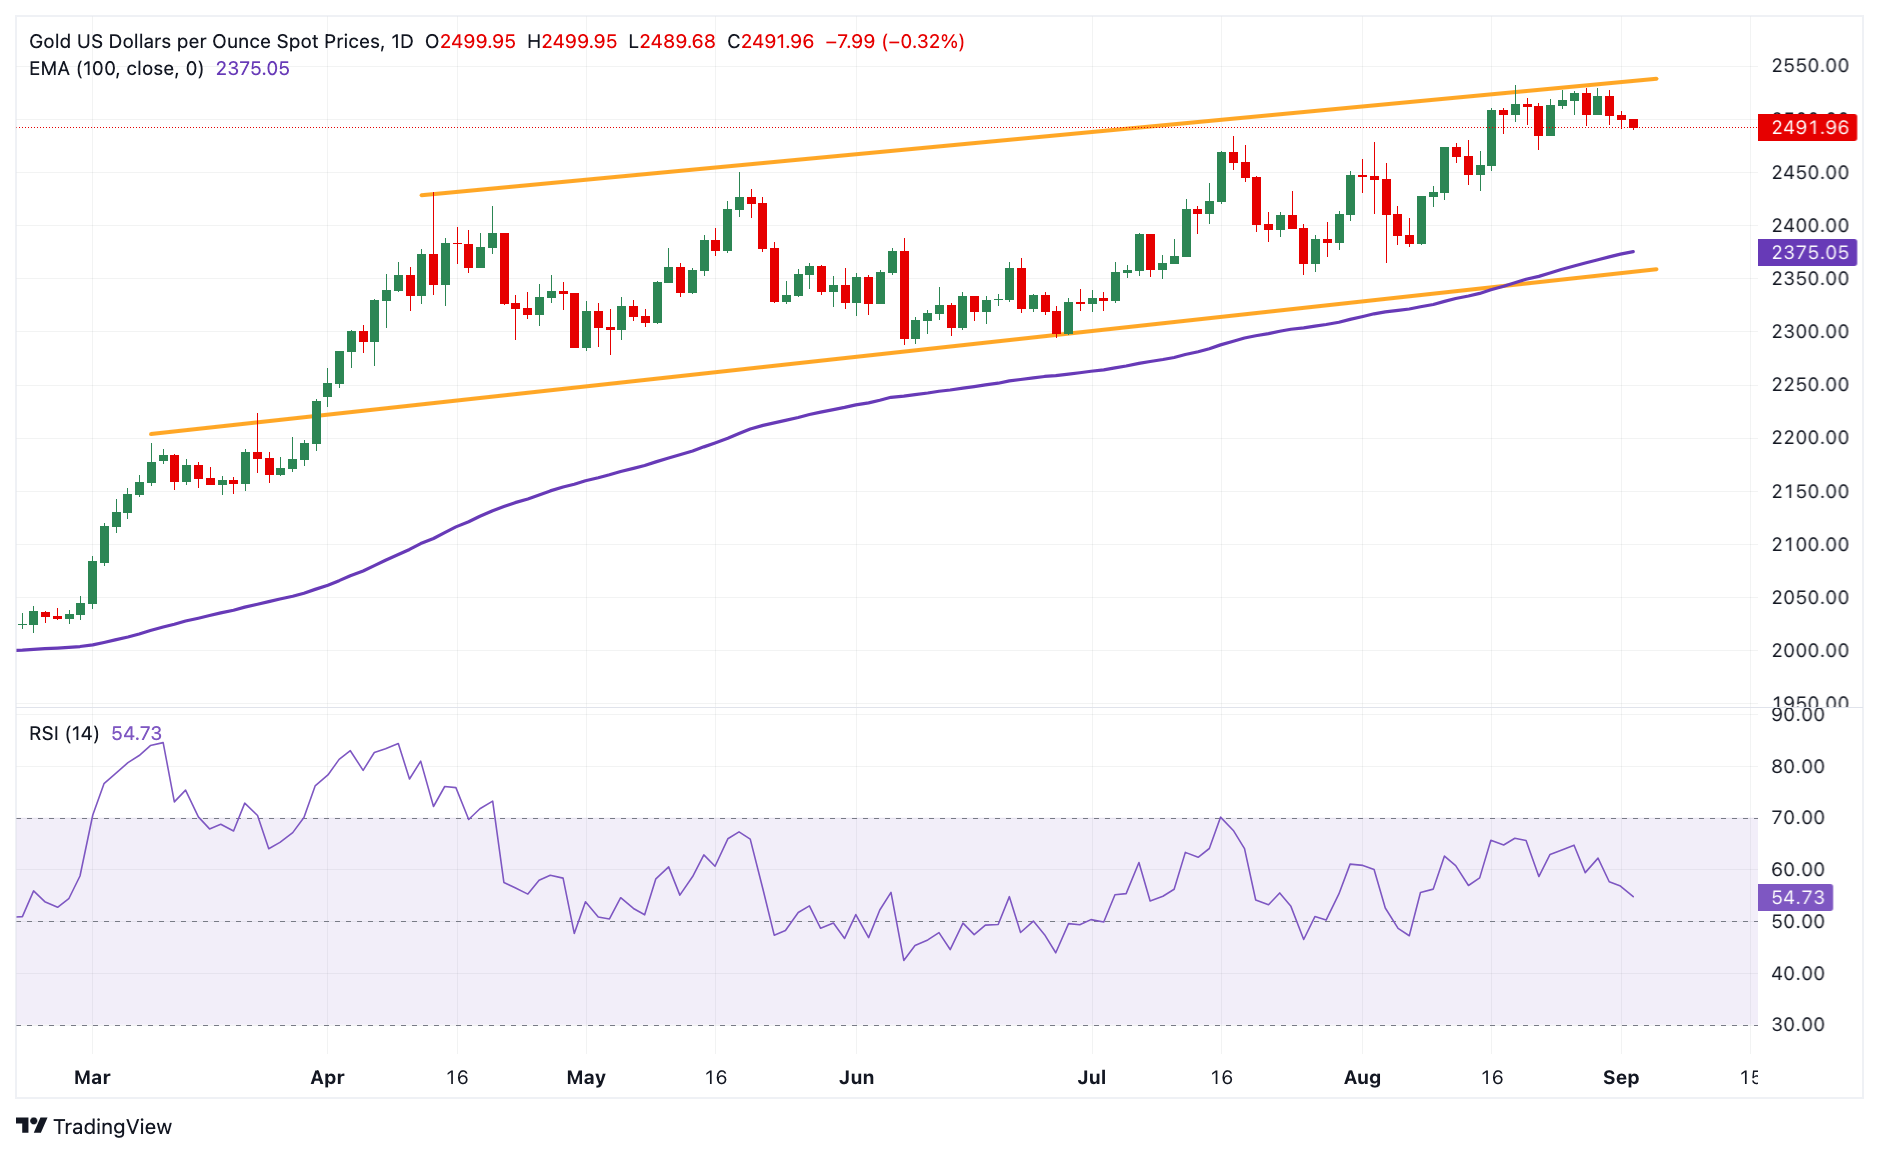
Gold FAQs
Gold has played a key role in human’s history as it has been widely used as a store of value and medium of exchange. Currently, apart from its shine and usage for jewelry, the precious metal is widely seen as a safe-haven asset, meaning that it is considered a good investment during turbulent times. Gold is also widely seen as a hedge against inflation and against depreciating currencies as it doesn’t rely on any specific issuer or government.
Central banks are the biggest Gold holders. In their aim to support their currencies in turbulent times, central banks tend to diversify their reserves and buy Gold to improve the perceived strength of the economy and the currency. High Gold reserves can be a source of trust for a country’s solvency. Central banks added 1,136 tonnes of Gold worth around $70 billion to their reserves in 2022, according to data from the World Gold Council. This is the highest yearly purchase since records began. Central banks from emerging economies such as China, India and Turkey are quickly increasing their Gold reserves.
Gold has an inverse correlation with the US Dollar and US Treasuries, which are both major reserve and safe-haven assets. When the Dollar depreciates, Gold tends to rise, enabling investors and central banks to diversify their assets in turbulent times. Gold is also inversely correlated with risk assets. A rally in the stock market tends to weaken Gold price, while sell-offs in riskier markets tend to favor the precious metal.
The price can move due to a wide range of factors. Geopolitical instability or fears of a deep recession can quickly make Gold price escalate due to its safe-haven status. As a yield-less asset, Gold tends to rise with lower interest rates, while higher cost of money usually weighs down on the yellow metal. Still, most moves depend on how the US Dollar (USD) behaves as the asset is priced in dollars (XAU/USD). A strong Dollar tends to keep the price of Gold controlled, whereas a weaker Dollar is likely to push Gold prices up.
- The Australian Dollar declines as the US Dollar advances due to improved Treasury yields.
- The downside of the AUD could be limited due to improved risk sentiment amid dovish sentiment surrounding the Fed.
- The US Dollar may face challenges due to rising odds of a 25 basis point rate cut by the Fed.
The Australian Dollar (AUD) edges lower against the US Dollar (USD) as traders await the ISM Manufacturing PMI data due on Tuesday. However, the AUD/USD pair may find some support from improved risk sentiment, driven by increasing dovish expectations regarding the US Federal Reserve’s (Fed) policy outlook.
Traders are now focusing on Australia's Q2 Gross Domestic Product (GDP) and July Trade Balance data, as well as an upcoming speech by Reserve Bank of Australia (RBA) Governor Michele Bullock later in the week, to gather more insights into the central bank's hawkish stance on monetary policy.
The US Dollar strengthens as Treasury yields continue to rise, but gains may be limited by growing expectations of a 25 basis point rate cut by the Fed in September. Traders will turn their attention to upcoming US employment data, particularly the August Nonfarm Payrolls (NFP), for further insights into the potential timing and scale of Fed rate cuts.
Daily Digest Market Movers: Australian Dollar declines despite the hawkish RBA
- Australia’s Building Permits surged by 10.4% month-over-month in July, sharply rebounding from a 6.5% decline in June, marking the strongest growth since May 2023. On an annual basis, the growth rate reached 14.3%, a significant recovery from the previous 3.7% decline.
- China’s Caixin Manufacturing PMI rose to 50.4 in August, up from 49.8 in July, which is particularly noteworthy given China’s close trade relationship with Australia.
- The US Bureau of Economic Analysis reported on Friday that the headline Personal Consumption Expenditures (PCE) Price Index increased by 2.5% year-over-year in July, matching the previous reading of 2.5% but falling short of the estimated 2.6%. Meanwhile, the core PCE, which excludes volatile food and energy prices, rose by 2.6% year-over-year in July, consistent with the prior figure of 2.6% but slightly below the consensus forecast of 2.7%.
- The US Gross Domestic Product (GDP) grew at an annualized rate of 3.0% in the second quarter, exceeding both the expected and previous growth rate of 2.8%. Additionally, Initial Jobless Claims showed that the number of people filing for unemployment benefits fell to 231,000 for the week ending August 23, down from the previous 233,000 and slightly below the expected 232,000.
- Australia's Private Capital Expenditure unexpectedly declined by 2.2% in the second quarter, reversing from an upwardly revised 1.9% expansion in the previous period and falling short of market expectations for a 1.0% increase. This marks the first contraction in new capital expenditure since the third quarter of 2023.
- Australia's Monthly Consumer Price Index (CPI) increased by 3.5% year-on-year in July, down from June's 3.8% but slightly above the market consensus of 3.4%. Despite the slight decrease, this marks the lowest CPI figure since March.
- Federal Reserve Atlanta President Raphael Bostic, a prominent hawk on the FOMC, indicated last week that it might be "time to move" on rate cuts due to further cooling inflation and a higher-than-expected unemployment rate. FXStreet’s FedTracker, which gauges the tone of Fed officials’ speeches on a dovish-to-hawkish scale from 0 to 10 using a custom AI model, rated Bostic’s words as neutral with a score of 5.6.
Technical Analysis: Australian Dollar remains above 0.6750
The Australian Dollar trades around 0.6780 on Tuesday. Analyzing the daily chart, the AUD/USD pair is positioned above the nine-day Exponential Moving Average (EMA), suggesting a short-term bullish trend. Additionally, the 14-day Relative Strength Index (RSI) remains above the 50 level, reinforcing the overall bullish trend.
In terms of resistance, the AUD/USD pair may challenge the immediate barrier at the seven-month high of 0.6798. A break above this level could strengthen the ongoing bullish momentum, potentially pushing the pair toward the psychological level of 0.6900.
On the downside, the AUD/USD pair may test immediate support around the nine-day EMA at 0.6767, followed by the 14-day EMA at 0.6743. A break below these EMAs could weaken the bullish bias and increase downward pressure, potentially driving the pair toward the throwback level at 0.6575, with further decline possibly targeting the lower support at 0.6470.
AUD/USD: Daily Chart
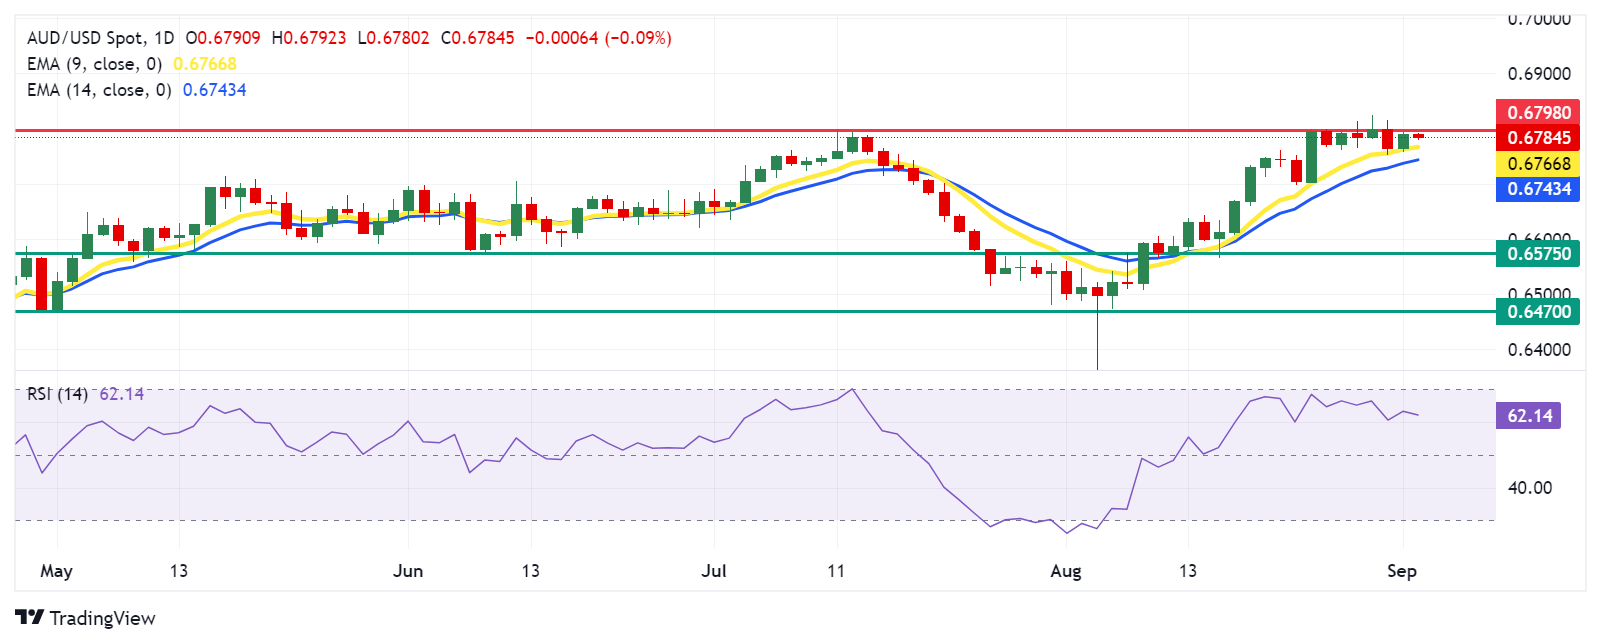
Australian Dollar PRICE Today
The table below shows the percentage change of Australian Dollar (AUD) against listed major currencies today. Australian Dollar was the weakest against the US Dollar.
| USD | EUR | GBP | JPY | CAD | AUD | NZD | CHF | |
|---|---|---|---|---|---|---|---|---|
| USD | 0.08% | 0.05% | 0.10% | 0.04% | 0.10% | 0.30% | 0.11% | |
| EUR | -0.08% | -0.03% | 0.03% | -0.05% | 0.01% | 0.12% | 0.03% | |
| GBP | -0.05% | 0.03% | 0.06% | -0.01% | 0.06% | 0.15% | 0.07% | |
| JPY | -0.10% | -0.03% | -0.06% | -0.09% | -0.03% | -0.01% | -0.02% | |
| CAD | -0.04% | 0.05% | 0.01% | 0.09% | 0.04% | 0.07% | 0.08% | |
| AUD | -0.10% | -0.01% | -0.06% | 0.03% | -0.04% | -0.01% | 0.01% | |
| NZD | -0.30% | -0.12% | -0.15% | 0.01% | -0.07% | 0.00% | 0.02% | |
| CHF | -0.11% | -0.03% | -0.07% | 0.02% | -0.08% | -0.01% | -0.02% |
The heat map shows percentage changes of major currencies against each other. The base currency is picked from the left column, while the quote currency is picked from the top row. For example, if you pick the Australian Dollar from the left column and move along the horizontal line to the US Dollar, the percentage change displayed in the box will represent AUD (base)/USD (quote).
Australian Dollar FAQs
One of the most significant factors for the Australian Dollar (AUD) is the level of interest rates set by the Reserve Bank of Australia (RBA). Because Australia is a resource-rich country another key driver is the price of its biggest export, Iron Ore. The health of the Chinese economy, its largest trading partner, is a factor, as well as inflation in Australia, its growth rate and Trade Balance. Market sentiment – whether investors are taking on more risky assets (risk-on) or seeking safe-havens (risk-off) – is also a factor, with risk-on positive for AUD.
The Reserve Bank of Australia (RBA) influences the Australian Dollar (AUD) by setting the level of interest rates that Australian banks can lend to each other. This influences the level of interest rates in the economy as a whole. The main goal of the RBA is to maintain a stable inflation rate of 2-3% by adjusting interest rates up or down. Relatively high interest rates compared to other major central banks support the AUD, and the opposite for relatively low. The RBA can also use quantitative easing and tightening to influence credit conditions, with the former AUD-negative and the latter AUD-positive.
China is Australia’s largest trading partner so the health of the Chinese economy is a major influence on the value of the Australian Dollar (AUD). When the Chinese economy is doing well it purchases more raw materials, goods and services from Australia, lifting demand for the AUD, and pushing up its value. The opposite is the case when the Chinese economy is not growing as fast as expected. Positive or negative surprises in Chinese growth data, therefore, often have a direct impact on the Australian Dollar and its pairs.
Iron Ore is Australia’s largest export, accounting for $118 billion a year according to data from 2021, with China as its primary destination. The price of Iron Ore, therefore, can be a driver of the Australian Dollar. Generally, if the price of Iron Ore rises, AUD also goes up, as aggregate demand for the currency increases. The opposite is the case if the price of Iron Ore falls. Higher Iron Ore prices also tend to result in a greater likelihood of a positive Trade Balance for Australia, which is also positive of the AUD.
The Trade Balance, which is the difference between what a country earns from its exports versus what it pays for its imports, is another factor that can influence the value of the Australian Dollar. If Australia produces highly sought after exports, then its currency will gain in value purely from the surplus demand created from foreign buyers seeking to purchase its exports versus what it spends to purchase imports. Therefore, a positive net Trade Balance strengthens the AUD, with the opposite effect if the Trade Balance is negative.
The People’s Bank of China (PBOC) set the USD/CNY central rate for the trading session ahead on Tuesday at 7.1112, as against the previous day's fix of 7.1027 and 7.1120 Reuters estimates.
| Index | Change, points | Closed | Change, % |
|---|---|---|---|
| NIKKEI 225 | 53.12 | 38700.87 | 0.14 |
| Hang Seng | -297.1 | 17691.97 | -1.65 |
| KOSPI | 6.69 | 2681 | 0.25 |
| ASX 200 | 18 | 8109.9 | 0.22 |
| DAX | 23.93 | 18930.85 | 0.13 |
| CAC 40 | 15.47 | 7646.42 | 0.2 |
| Pare | Closed | Change, % |
|---|---|---|
| AUDUSD | 0.67908 | 0.41 |
| EURJPY | 162.606 | 0.66 |
| EURUSD | 1.10706 | 0.24 |
| GBPJPY | 193.088 | 0.58 |
| GBPUSD | 1.31445 | 0.15 |
| NZDUSD | 0.62315 | -0.23 |
| USDCAD | 1.34918 | 0 |
| USDCHF | 0.85148 | 0.12 |
| USDJPY | 146.891 | 0.43 |
- WTI attracts some sellers near $73.30 in Tuesday’s early Asian session.
- China's manufacturing activity slowed in August, weighing on the WTI price.
- Halted Libyan exports and higher Fed rate cut expectations might cap the WTI’s downside.
West Texas Intermediate (WTI), the US crude oil benchmark, is trading around $73.30 on Tuesday. Slowing manufacturing activity in China in August exerts some selling pressure on the WTI price. However, supply concerns surrounding Libya's oil output might cap its downside.
The sluggish economy and slowing oil demand in China raise the fear of the economic health of the world’s largest importer of oil, which weighs on the WTI price. Data released by the National Bureau of Statistics showed that China’s manufacturing sector experienced a downturn in August, marking its six-month low. China’s official Manufacturing Purchasing Managers' Index (PMI) dropped to 49.1 in August, compared to 49.54 in the previous reading. The reading missed the market consensus of 49.5 in the reported month.
Libya's oil production was halted on Monday across the country amid the ongoing conflicts between various factions since the removal of Muammar Gaddafi in 2011. The fear of oil supply disruption might provide some support for WTI prices.
Bjarne Schieldrop, chief commodity analyst at SEB, noted, “The current disturbances in Libya's oil production could provide room for added supply from OPEC+. But these fluctuations have become quite normal over the last few years, meaning any outages will probably be short-lived; with the news flow indicating signals for a restart of production have already been given.”
Oil traders will take more cues from the release of US ISM Manufacturing PMI for August, which is due on Tuesday. Later this week, the US Nonfarm Payrolls (NFP) will take center stage. This event could provide some insight into the size and pace of the US Federal Reserve's (Fed) interest rate cut this year. Lower interest rates generally support the WTI price as it reduces the cost of borrowing, which can boost economic activity and oil demand.
WTI Oil FAQs
WTI Oil is a type of Crude Oil sold on international markets. The WTI stands for West Texas Intermediate, one of three major types including Brent and Dubai Crude. WTI is also referred to as “light” and “sweet” because of its relatively low gravity and sulfur content respectively. It is considered a high quality Oil that is easily refined. It is sourced in the United States and distributed via the Cushing hub, which is considered “The Pipeline Crossroads of the World”. It is a benchmark for the Oil market and WTI price is frequently quoted in the media.
Like all assets, supply and demand are the key drivers of WTI Oil price. As such, global growth can be a driver of increased demand and vice versa for weak global growth. Political instability, wars, and sanctions can disrupt supply and impact prices. The decisions of OPEC, a group of major Oil-producing countries, is another key driver of price. The value of the US Dollar influences the price of WTI Crude Oil, since Oil is predominantly traded in US Dollars, thus a weaker US Dollar can make Oil more affordable and vice versa.
The weekly Oil inventory reports published by the American Petroleum Institute (API) and the Energy Information Agency (EIA) impact the price of WTI Oil. Changes in inventories reflect fluctuating supply and demand. If the data shows a drop in inventories it can indicate increased demand, pushing up Oil price. Higher inventories can reflect increased supply, pushing down prices. API’s report is published every Tuesday and EIA’s the day after. Their results are usually similar, falling within 1% of each other 75% of the time. The EIA data is considered more reliable, since it is a government agency.
OPEC (Organization of the Petroleum Exporting Countries) is a group of 13 Oil-producing nations who collectively decide production quotas for member countries at twice-yearly meetings. Their decisions often impact WTI Oil prices. When OPEC decides to lower quotas, it can tighten supply, pushing up Oil prices. When OPEC increases production, it has the opposite effect. OPEC+ refers to an expanded group that includes ten extra non-OPEC members, the most notable of which is Russia.


© 2000-2026. All rights reserved.
This site is managed by Teletrade D.J. LLC 2351 LLC 2022 (Euro House, Richmond Hill Road, Kingstown, VC0100, St. Vincent and the Grenadines).
The information on this website is for informational purposes only and does not constitute any investment advice.
The company does not serve or provide services to customers who are residents of the US, Canada, Iran, The Democratic People's Republic of Korea, Yemen and FATF blacklisted countries.
Making transactions on financial markets with marginal financial instruments opens up wide possibilities and allows investors who are willing to take risks to earn high profits, carrying a potentially high risk of losses at the same time. Therefore you should responsibly approach the issue of choosing the appropriate investment strategy, taking the available resources into account, before starting trading.
Use of the information: full or partial use of materials from this website must always be referenced to TeleTrade as the source of information. Use of the materials on the Internet must be accompanied by a hyperlink to teletrade.org. Automatic import of materials and information from this website is prohibited.
Please contact our PR department if you have any questions or need assistance at pr@teletrade.global.
transfers