- Analytics
- News and Tools
- Market News
CFD Markets News and Forecasts — 02-07-2024
- USD/JPY remains strong around 161.40 in Wednesday’s early Asian session.
- Fed’s Powell said US inflation is cooling again, but more evidence would be needed before the Fed would cut rates.
- The monetary policy divergence between Japan and the US exerts some selling pressure on the Japanese Yen.
The USD/JPY pair trades on a stronger note near 161.40 after reaching a new high for this move near 161.75 during the early Asian trading hours on Wednesday. Market players remain focused on the possible foreign exchange (FX) intervention from the Bank of Japan (BoJ), which might cap the pair’s upside. The final print of Japan’s Jibun Bank Services PMI is due on Wednesday. On the US docket, the US June ADP Employment Change, ISM Services PMI, and the FOMC Minutes will be released.
The weaker US Manufacturing PMI data on Monday and softer PCE inflation reports last week have spurred the expectation of a Federal Reserve (Fed) rate cut this year and weighed on the US Dollar (USD). Fed Chair Jerome Powell said Tuesday that he saw progress in inflation over the past year, adding that the central bank is getting back on the disinflationary path. However, Powell noted that “we want to be more confident that inflation is moving sustainably down toward 2% before we start the process of reducing or loosening policy.”
Financial markets have adjusted to expect two rate cuts this year, in September and before the end of the year. Nonetheless, Fed officials penciled in just one rate cut in its June meeting. Traders are now pricing in a nearly 63% chance for a 25 basis points (bps) rate cut from the Fed in September, up from 58% on Monday, according to the CME FedWatch tool.
The Japanese Yen (JPY) weakens further, fueled by the divergence in monetary policies between the Bank of Japan (BoJ) and the US Fed. Japanese authorities are concerned about the impact of "rapid and one-sided" FX moves on the Japanese economy and they might intervene in the FX market to prevent the JPY from depreciating. This, in turn, might underpin the JPY in the near term and create a headwind for the USD/JPY pair.
“USD/JPY continued to trade near recent highs. This is also near the highest level since 1986. There are expectations that Japanese authorities could soon intervene. While the level of JPY is one factor to consider, officials also focus on the pace of depreciation as the intent of intervention is to curb excessive volatility,” said OCBC analysts.
Japanese Yen FAQs
The Japanese Yen (JPY) is one of the world’s most traded currencies. Its value is broadly determined by the performance of the Japanese economy, but more specifically by the Bank of Japan’s policy, the differential between Japanese and US bond yields, or risk sentiment among traders, among other factors.
One of the Bank of Japan’s mandates is currency control, so its moves are key for the Yen. The BoJ has directly intervened in currency markets sometimes, generally to lower the value of the Yen, although it refrains from doing it often due to political concerns of its main trading partners. The current BoJ ultra-loose monetary policy, based on massive stimulus to the economy, has caused the Yen to depreciate against its main currency peers. This process has exacerbated more recently due to an increasing policy divergence between the Bank of Japan and other main central banks, which have opted to increase interest rates sharply to fight decades-high levels of inflation.
The BoJ’s stance of sticking to ultra-loose monetary policy has led to a widening policy divergence with other central banks, particularly with the US Federal Reserve. This supports a widening of the differential between the 10-year US and Japanese bonds, which favors the US Dollar against the Japanese Yen.
The Japanese Yen is often seen as a safe-haven investment. This means that in times of market stress, investors are more likely to put their money in the Japanese currency due to its supposed reliability and stability. Turbulent times are likely to strengthen the Yen’s value against other currencies seen as more risky to invest in.
- EUR/USD remains trapped in constrained intraday cycle near 1.0750.
- Tuesday’s EU CPI inflation print warned of an uptick in EU inflation.
- Wednesday brings a packed docket with EU PMIs, PPIs, and US ADP jobs.
EUR/USD spent Tuesday in a churning pattern, cycling just below 1.075 as the pair grapples with finding momentum. Key labor data from the US looms ahead on Friday, and EU economic figures remain scattered throughout the back half of the trading week.
Pan-EU HCOB Core Harmonized Index of Consumer Prices (HICP) inflation held steady at 2.9% MoM in June, holding steady at the previous figure and snubbing the forecast decline to 2.8%. Overall YoY HICP inflation eased to 2.5% as forecast, ticking down from the previous 2.6%, but European inflation figures remain notably above the European Central Bank’s (ECB) 2% target band.
Forex Today: US data and FOMC should dictate the price action
Fedspeak from Federal Reserve (Fed) officials helped to bolster investor mood during Tuesday’s US market session, with key policymakers giving a firmer nod to recent improvements in US inflation data. US JOLTS Job Openings also rose slightly in May, climbing to 8.14 million from the forecast steady print at 7.91 million. Signs of extending slack within the US labor market are beginning to appear, giving rate-cut-hungry financial markets reason to hope that the Fed might get pushed towards a rate trim sooner rather than later.
Wednesday’s upcoming European market session will see final Producer Price Index (PPI) and HCOB Purchasing Managers Index (PMI) figures, while the US trading window features ISM Services PMI figure and the latest ADP Employment Change numbers, a rough preview of Friday’s upcoming US Nonfarm Payrolls (NFP) jobs data dump.
The pan-EU Composite PMI for June is expected to hold steady at 50.8, while May’s annualized European PPI is expected to improve, albeit slightly, to -4.1% YoY from the previous -5.7%.
US ADP Employment Change in June is forecast to rise slightly to 160K from the previous 152K. Meanwhile, June’s ISM Services PMI is expected to cool further to 52.5 MoM from the previous 53.8.
ECB President Christine Lagarde is expected to make an appearance near the end of the European market session, and he Federal Open Market Committee’s (FOMC) latest Meeting Minutes will be released later in the day.
Economic Indicator
ADP Employment Change
The ADP Employment Change is a gauge of employment in the private sector released by the largest payroll processor in the US, Automatic Data Processing Inc. It measures the change in the number of people privately employed in the US. Generally speaking, a rise in the indicator has positive implications for consumer spending and is stimulative of economic growth. So a high reading is traditionally seen as bullish for the US Dollar (USD), while a low reading is seen as bearish.
Read more.Next release: Wed Jul 03, 2024 12:15
Frequency: Monthly
Consensus: 160K
Previous: 152K
Source: ADP Research Institute
Traders often consider employment figures from ADP, America’s largest payrolls provider, report as the harbinger of the Bureau of Labor Statistics release on Nonfarm Payrolls (usually published two days later), because of the correlation between the two. The overlaying of both series is quite high, but on individual months, the discrepancy can be substantial. Another reason FX traders follow this report is the same as with the NFP – a persistent vigorous growth in employment figures increases inflationary pressures, and with it, the likelihood that the Fed will raise interest rates. Actual figures beating consensus tend to be USD bullish.
EUR/USD technical outlook
EUR/USD is extending a near-term consolidation pattern, drifting into the midrange as intraday price continues to get buoyed by a supply zone priced in below 1.0680. The Fiber is cycling median bids near the 200-hour Exponential Moving Average (EMA) near 1.0725.
Daily candlesticks are poised for an upside breakout of recent consolidation, however technical resistance is priced in at the 50-day EMA near 1.0770 and a reversal of market flows will drag EUR/USD back down into the bottom end of a rough descending channel just above the 1.0600 handle.
EUR/USD hourly chart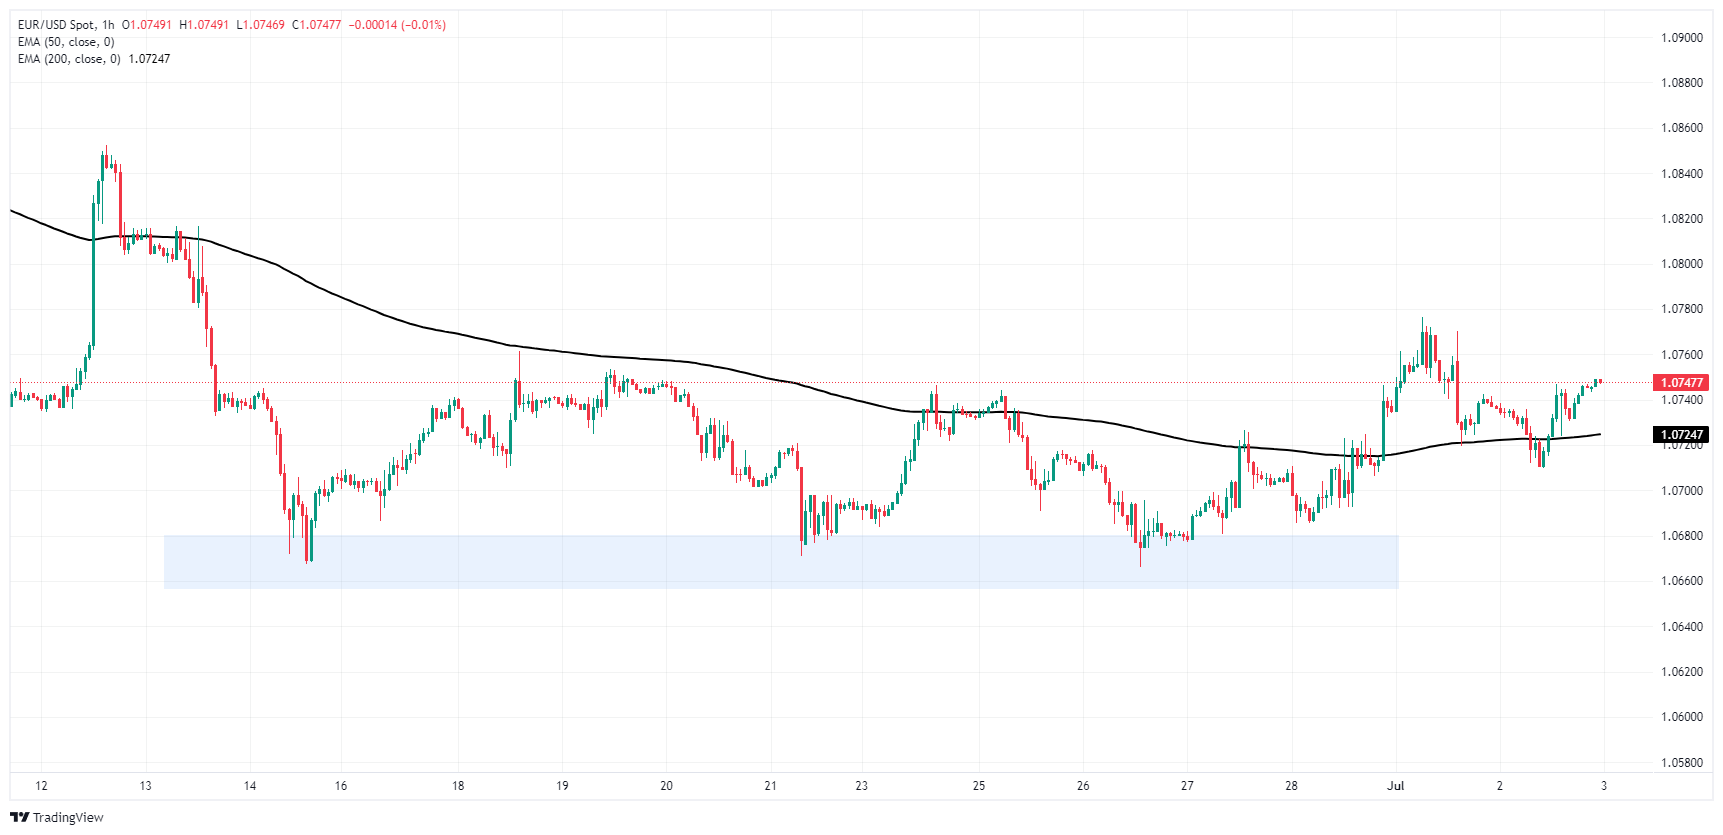
EUR/USD daily chart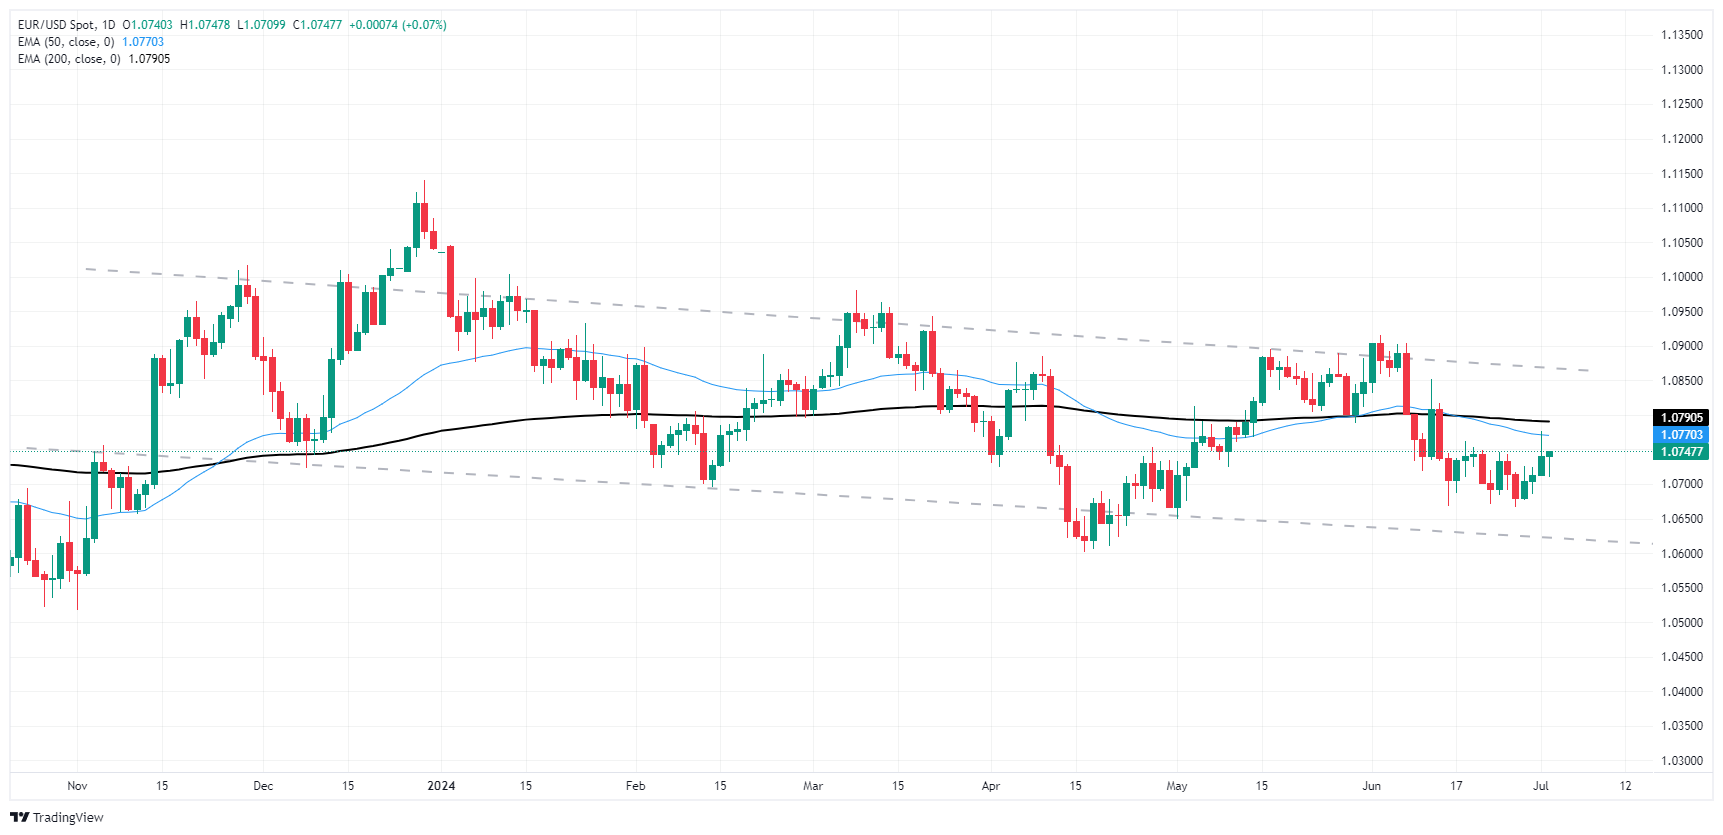
Euro FAQs
The Euro is the currency for the 20 European Union countries that belong to the Eurozone. It is the second most heavily traded currency in the world behind the US Dollar. In 2022, it accounted for 31% of all foreign exchange transactions, with an average daily turnover of over $2.2 trillion a day. EUR/USD is the most heavily traded currency pair in the world, accounting for an estimated 30% off all transactions, followed by EUR/JPY (4%), EUR/GBP (3%) and EUR/AUD (2%).
The European Central Bank (ECB) in Frankfurt, Germany, is the reserve bank for the Eurozone. The ECB sets interest rates and manages monetary policy. The ECB’s primary mandate is to maintain price stability, which means either controlling inflation or stimulating growth. Its primary tool is the raising or lowering of interest rates. Relatively high interest rates – or the expectation of higher rates – will usually benefit the Euro and vice versa. The ECB Governing Council makes monetary policy decisions at meetings held eight times a year. Decisions are made by heads of the Eurozone national banks and six permanent members, including the President of the ECB, Christine Lagarde.
Eurozone inflation data, measured by the Harmonized Index of Consumer Prices (HICP), is an important econometric for the Euro. If inflation rises more than expected, especially if above the ECB’s 2% target, it obliges the ECB to raise interest rates to bring it back under control. Relatively high interest rates compared to its counterparts will usually benefit the Euro, as it makes the region more attractive as a place for global investors to park their money.
Data releases gauge the health of the economy and can impact on the Euro. Indicators such as GDP, Manufacturing and Services PMIs, employment, and consumer sentiment surveys can all influence the direction of the single currency. A strong economy is good for the Euro. Not only does it attract more foreign investment but it may encourage the ECB to put up interest rates, which will directly strengthen the Euro. Otherwise, if economic data is weak, the Euro is likely to fall. Economic data for the four largest economies in the euro area (Germany, France, Italy and Spain) are especially significant, as they account for 75% of the Eurozone’s economy.
Another significant data release for the Euro is the Trade Balance. This indicator measures the difference between what a country earns from its exports and what it spends on imports over a given period. If a country produces highly sought after exports then its currency will gain in value purely from the extra demand created from foreign buyers seeking to purchase these goods. Therefore, a positive net Trade Balance strengthens a currency and vice versa for a negative balance.
Judo Bank's Australia Purchasing Managers Index (PMI) figures improved slightly in June, with the Services PMI ticking upwards to 51.2 MoM compared to the previous month's 51.0, and flaunting the forecast move lower to 50.6.
Judo Bank's Composite PMI also ticked higher, moving to 50.7 MoM compared to the previous 50.6.
Despite the improved figure, weak spots in Australian business activity outlooks remains muted. As noted by Judo Bank Economist Matthew De Pasquale, "The final composite PMI results for June confirm that the Australian business sector continued to see output expand into the end of the financial year, with the services sector driving this growth. Despite the improvement in margin pressure and the resilience of business activity, business confidence remains soft and fell a little further in the month."
Economic Indicator
Judo Bank Services PMI
The Services Purchasing Managers Index (PMI), released on a monthly basis by Judo Bank and S&P Global, is a leading indicator gauging business activity in Australia’s services sector. The data is derived from surveys of senior executives at private-sector companies from the services sector. Survey responses reflect the change, if any, in the current month compared to the previous month and can anticipate changing trends in official data series such as Gross Domestic Product (GDP), employment and inflation. A reading above 50 indicates that the services economy is generally expanding, a bullish sign for the Australian Dollar (AUD). Meanwhile, a reading below 50 signals that activity among service providers is generally declining, which is seen as bearish for AUD.
Read more.Last release: Tue Jul 02, 2024 23:00
Frequency: Monthly
Actual: 51.2
Consensus: 50.6
Previous: 51
Source: S&P Global
AUD/USD five minute chart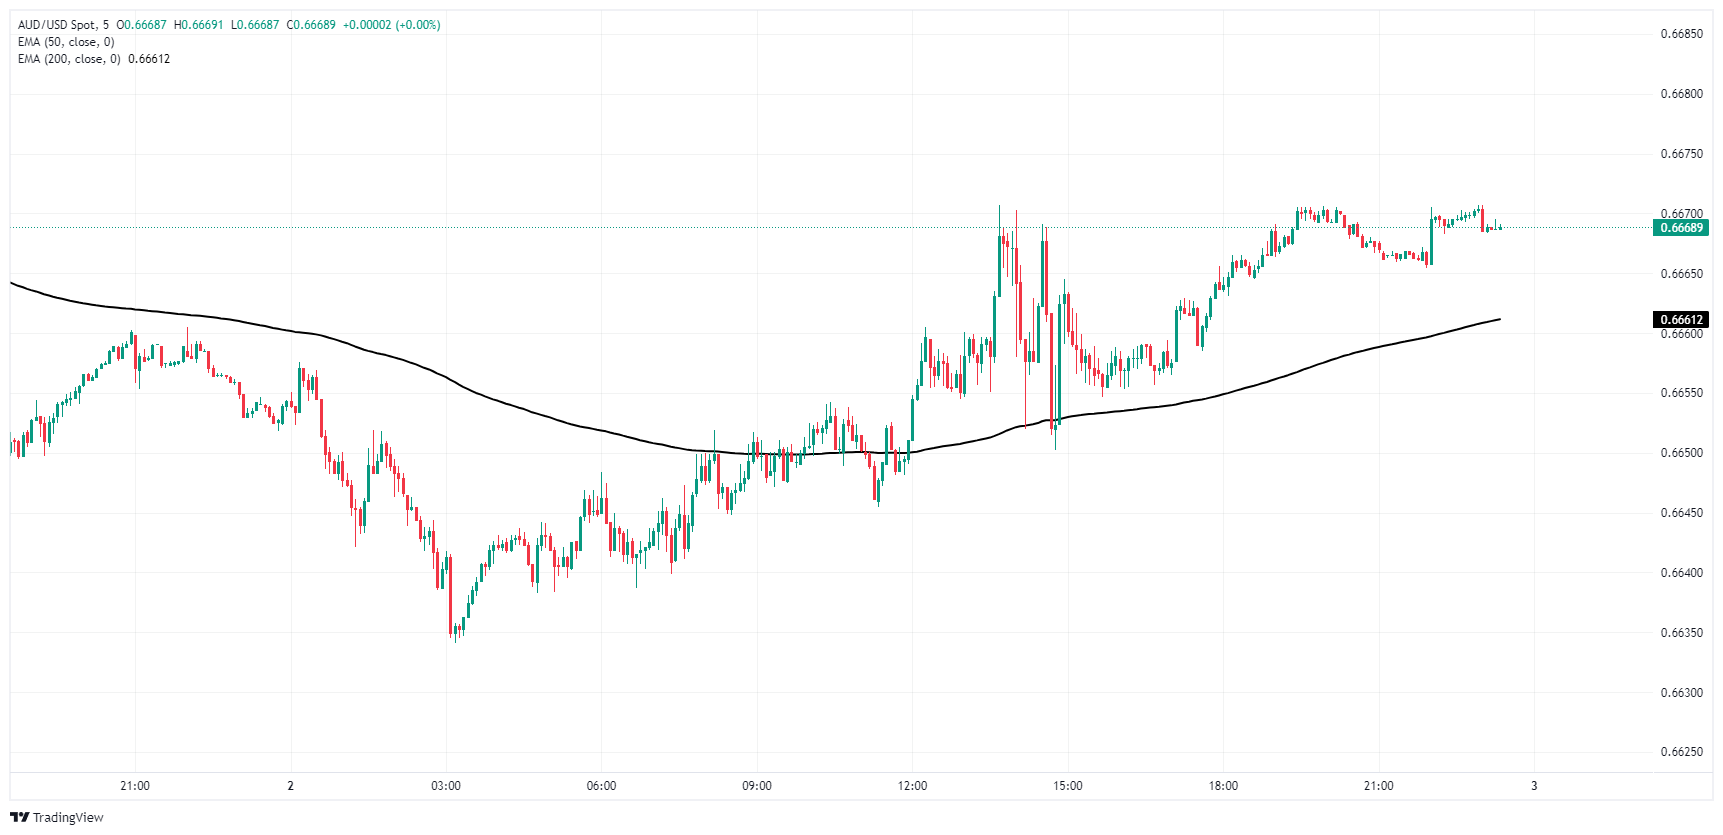
About Australian Judo Bank Services PMI
The Services Purchasing Managers Index (PMI), released on a monthly basis by Judo Bank and S&P Global, is a leading indicator gauging business activity in Australia’s services sector. The data is derived from surveys of senior executives at private-sector companies from the services sector. Survey responses reflect the change, if any, in the current month compared to the previous month and can anticipate changing trends in official data series such as Gross Domestic Product (GDP), employment and inflation. A reading above 50 indicates that the services economy is generally expanding, a bullish sign for the Australian Dollar (AUD). Meanwhile, a reading below 50 signals that activity among service providers is generally declining, which is seen as bearish for AUD.
- GBP/USD extends the rally near 1.2688 on the weaker US dollar in Wednesday’s early Asian session.
- Fed Chair Powell saw progress on inflation but needed more confidence before cutting rate.
- Financial markets expect a rate cut from the BoE on August 1.
The GBP/USD pair trades in positive territory for the fifth consecutive day around 1.2688 on Wednesday during the early Asian session. The USD Index (DXY) declines below the 106.00 hurdle, which supports the major pair. Investors await the US June ADP Employment Change, ISM Services PMI, along with the FOMC Minutes, which are due later on Wednesday.
On Tuesday, US Federal Reserve Chair Jerome Powell stated that US inflation is cooling again after higher readings earlier this year. Still, he wants to see more evidence before being confident enough to start cutting interest rates. Powell added that the US economy and job market remain strong, which means the central bank can take its time in deciding when rate cuts are appropriate.
Meanwhile, Chicago Fed President Austan Goolsbee said that he sees some "warning signs" of economic weakness, adding that the Fed's goal is to bring inflation down without pressuring the labour market. Traders raise their bets on the Fed easing cycle this year, seeing nearly 63% odds for a 25 basis points (bps) rate cut in September, up from 58% on Monday, according to the CME FedWatch tool. This, in turn, exerts some selling pressure on the Greenback.
On the other hand, the Pound Sterling (GBP) edges higher against the USD despite expectations of early rate cuts by the Bank of England (BoE). Currently, investors anticipate the UK central bank to start cutting interest rates at its upcoming meeting in August. “The MPC is following the data. The data is clearly moving in the right direction, and therefore, rate cuts will have to follow,” said Michael Field, European market strategist at Morningstar.
Pound Sterling FAQs
The Pound Sterling (GBP) is the oldest currency in the world (886 AD) and the official currency of the United Kingdom. It is the fourth most traded unit for foreign exchange (FX) in the world, accounting for 12% of all transactions, averaging $630 billion a day, according to 2022 data. Its key trading pairs are GBP/USD, aka ‘Cable’, which accounts for 11% of FX, GBP/JPY, or the ‘Dragon’ as it is known by traders (3%), and EUR/GBP (2%). The Pound Sterling is issued by the Bank of England (BoE).
The single most important factor influencing the value of the Pound Sterling is monetary policy decided by the Bank of England. The BoE bases its decisions on whether it has achieved its primary goal of “price stability” – a steady inflation rate of around 2%. Its primary tool for achieving this is the adjustment of interest rates. When inflation is too high, the BoE will try to rein it in by raising interest rates, making it more expensive for people and businesses to access credit. This is generally positive for GBP, as higher interest rates make the UK a more attractive place for global investors to park their money. When inflation falls too low it is a sign economic growth is slowing. In this scenario, the BoE will consider lowering interest rates to cheapen credit so businesses will borrow more to invest in growth-generating projects.
Data releases gauge the health of the economy and can impact the value of the Pound Sterling. Indicators such as GDP, Manufacturing and Services PMIs, and employment can all influence the direction of the GBP. A strong economy is good for Sterling. Not only does it attract more foreign investment but it may encourage the BoE to put up interest rates, which will directly strengthen GBP. Otherwise, if economic data is weak, the Pound Sterling is likely to fall.
Another significant data release for the Pound Sterling is the Trade Balance. This indicator measures the difference between what a country earns from its exports and what it spends on imports over a given period. If a country produces highly sought-after exports, its currency will benefit purely from the extra demand created from foreign buyers seeking to purchase these goods. Therefore, a positive net Trade Balance strengthens a currency and vice versa for a negative balance.
- In Tuesday's session, NZD/USD marginally rose, while bears tested the 100 and 200-day Simple SMA convergence at 0.6070.
- Buyers saw some resilience but the dominant force seems to be the selling one.
On Tuesday, the NZD/USD saw minimal gains, with the pair now testing the crucial convergence of the 100 and 200-day Simple Moving Averages (SMAs) near the 0.6070 level and cleared daily losses. Whether the bulls gather momentum or the bears conquer this zone could provide fresh momentum and chart the pair's future course.
The Relative Strength Index (RSI) for the NZD/USD pair on the daily chart sits below 50, indicating a selling strength. While the RSI is gaining gradually, the broader negative momentum cannot be ignored. Similarly, the Moving Average Convergence Divergence (MACD) continues to print flat red bars, signaling the subdued but bearish market bias.
NZD/USD daily chart
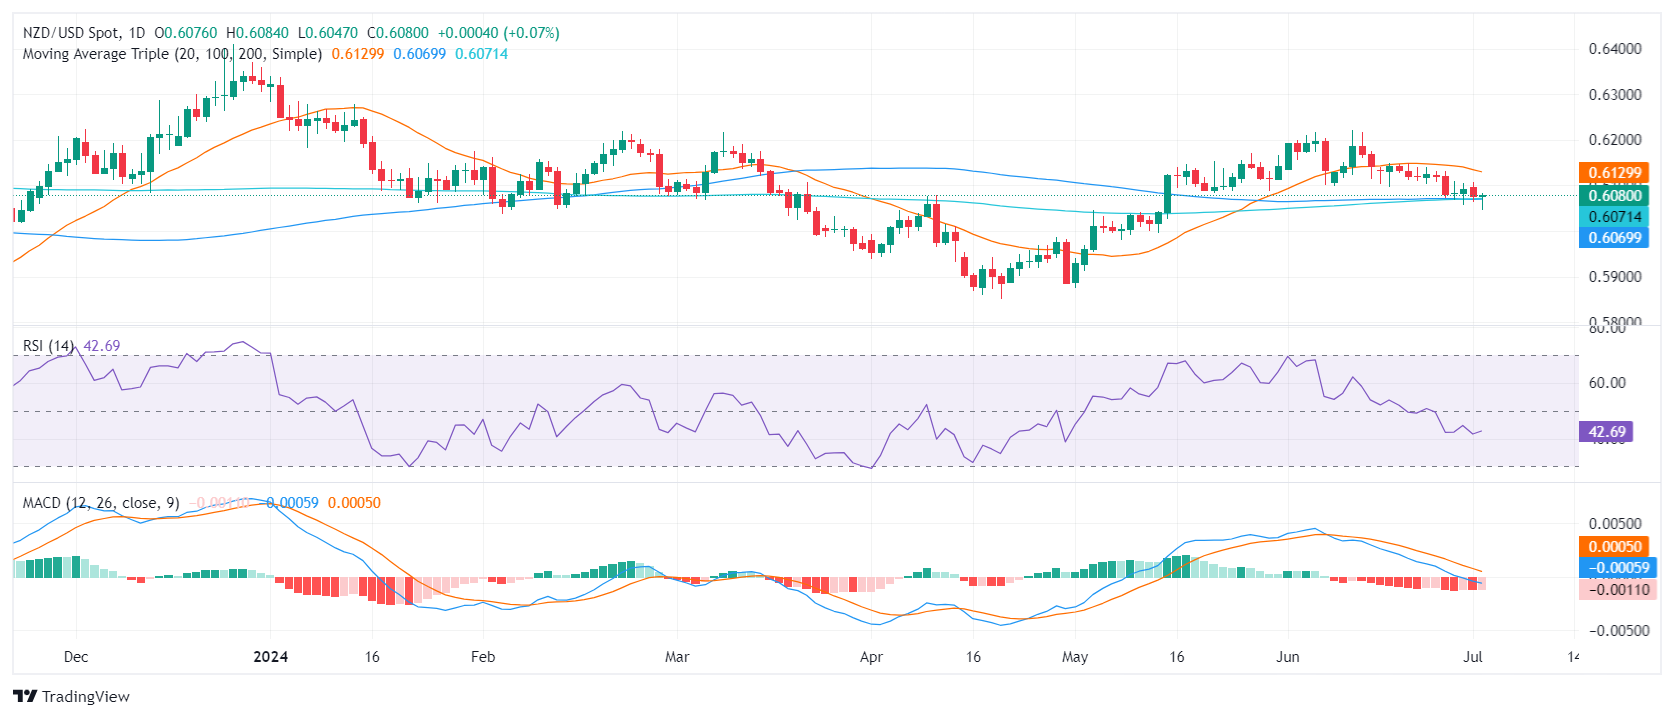
The NZD/USD encounters immediate support near the 0.6070 threshold, coinciding with the meeting point of the 100 and 200-day SMAs. If the bears break below it, more selling pressure could mount, confirming a deeper downswing. More support can be found near the 0.6050 level and below at 0.6030. The good news is that bears pushed the pair towards 0.6050 but bulls managed to recover and bring it back to 0.6070.
Conversely, resistance now lies around 0.6100 followed by a crucial hurdle at the 20-day SMA at 0.6150. Additional resistance points expected are at 0.6170 and 0.6200. A break above these resistance levels could potentially end the bearish grip and steer the pair into a bullish zone.
- Crude Oil briefly found fresh highs on Tuesday before falling back.
- WTI tested above $83.50 per barrel before easing back to $82.50.
- API reported a steeper-than-expected drawdown in US Crude Oil supplies.
West Texas Intermediate (WTI) US Crude Oil briefly clipped into a nine-week peak just shy of $84.00 per barrel on Tuesday before mid-US session market flows pulled barrel bids back down to $82.50.
Crude Oil markets continue to be bolstered by ongoing tensions in the Middle East. The Israel-Palestinian Hamas conflict continues to roil energy markets as investors remain concerned that a cross-border spillover of the conflict would involve direct action from Iran, which backs Hamas and would threaten Crude Oil supplies and logistics stability in the region.
The American Petroleum Institute (API) noted its steepest week-on-week US Weekly Crude Oil Stocks in nearly two years; API barrel counts noted a weekly decline of -9.163 million, far below the forecast -150K drawdown and adding to the previous week’s -3 million barrel decline.
Despite the sharp downturn in Crude Oil stocks, WTI bids remain constrained on Tuesday’s low end after the API also noted a 2.468 million uptick in Gasoline counts as refiners prepare for the summer travel peak. Distillate inventories declined -740K for the week ended June 28, and US Crude Oil stocks at the Cushing facility still rose 404K barrels.
Economic Indicator
API Weekly Crude Oil Stock
API’s Weekly Statistical Bulletin (WSB) has reported total U.S. and regional data relating to refinery operations and the production of the four major petroleum products: motor gasoline, kerosene jet fuel, distillate (by sulfur content), and residual fuel oil. These products represent more than 85% of total petroleum industry.
Read more.Last release: Tue Jul 02, 2024 20:30
Frequency: Weekly
Actual: -9.163M
Consensus: -0.15M
Previous: 0.914M
Source: American Petroleum Institute
WTI technical outlook
WTI has broken north of near-term consolidation around the $81.50 region, but intraday bullish momentum failed to breach $84.00 per barrel. WTI is primed for a near-term pullback to median bids at the 200-hour Exponential Moving Average (EMA) at $81.28.
After a bullish breakout from near-term consolidation, WTI is drawing a potential bearish signal as topside momentum remains thin and US Crude Oil trades just north of the 200-day EMA near $79.00.
WTI hourly chart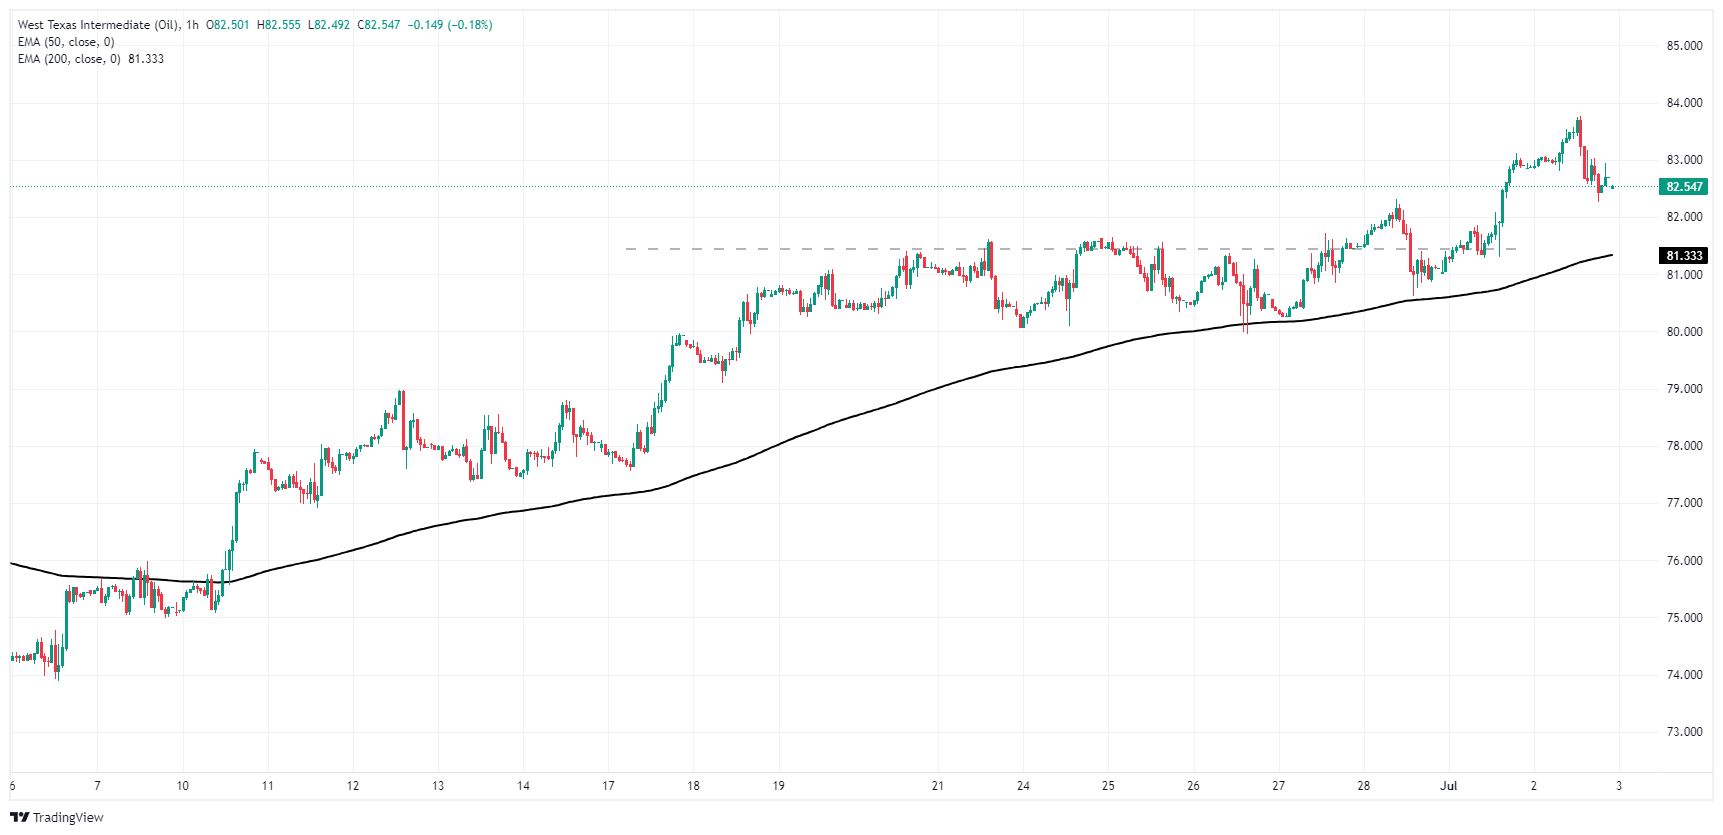
WTI daily chart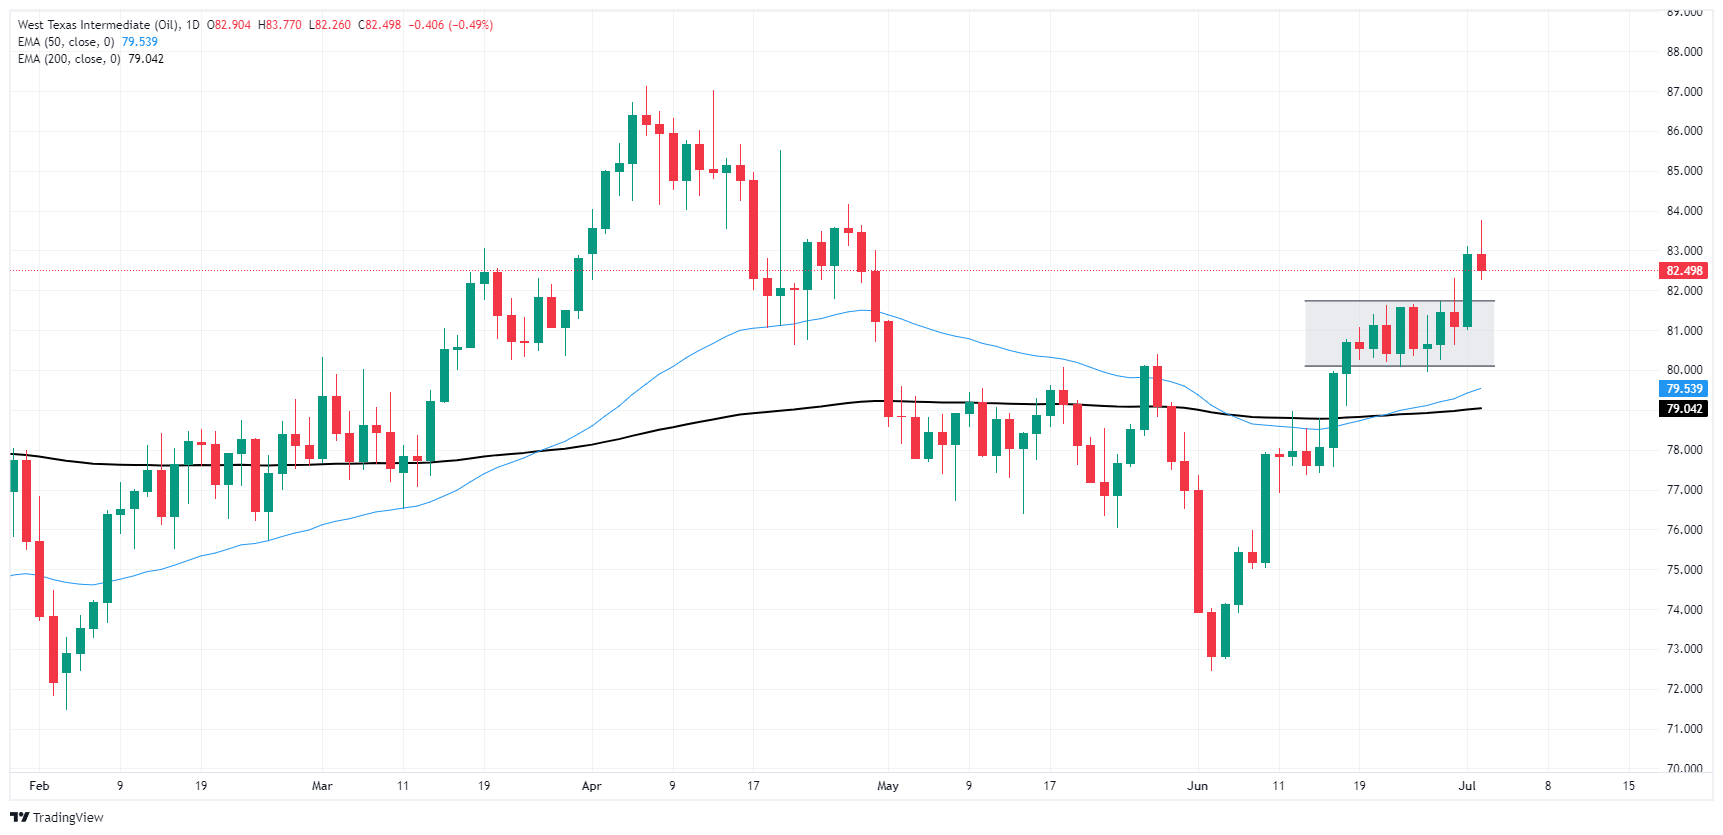
WTI Oil FAQs
WTI Oil is a type of Crude Oil sold on international markets. The WTI stands for West Texas Intermediate, one of three major types including Brent and Dubai Crude. WTI is also referred to as “light” and “sweet” because of its relatively low gravity and sulfur content respectively. It is considered a high quality Oil that is easily refined. It is sourced in the United States and distributed via the Cushing hub, which is considered “The Pipeline Crossroads of the World”. It is a benchmark for the Oil market and WTI price is frequently quoted in the media.
Like all assets, supply and demand are the key drivers of WTI Oil price. As such, global growth can be a driver of increased demand and vice versa for weak global growth. Political instability, wars, and sanctions can disrupt supply and impact prices. The decisions of OPEC, a group of major Oil-producing countries, is another key driver of price. The value of the US Dollar influences the price of WTI Crude Oil, since Oil is predominantly traded in US Dollars, thus a weaker US Dollar can make Oil more affordable and vice versa.
The weekly Oil inventory reports published by the American Petroleum Institute (API) and the Energy Information Agency (EIA) impact the price of WTI Oil. Changes in inventories reflect fluctuating supply and demand. If the data shows a drop in inventories it can indicate increased demand, pushing up Oil price. Higher inventories can reflect increased supply, pushing down prices. API’s report is published every Tuesday and EIA’s the day after. Their results are usually similar, falling within 1% of each other 75% of the time. The EIA data is considered more reliable, since it is a government agency.
OPEC (Organization of the Petroleum Exporting Countries) is a group of 13 Oil-producing nations who collectively decide production quotas for member countries at twice-yearly meetings. Their decisions often impact WTI Oil prices. When OPEC decides to lower quotas, it can tighten supply, pushing up Oil prices. When OPEC increases production, it has the opposite effect. OPEC+ refers to an expanded group that includes ten extra non-OPEC members, the most notable of which is Russia.
- Silver advanced 0.20%, after Powell's hawkish comments.
- Technicals: Uptrend within descending channel, potential 'double bottom' pattern.
- Resistance levels: $29.50, $30.84 (June 21 high), $32.29 (May 29 peak), $32.51 (YTD high).
- Support points: $29.00, $28.57 (June 26 low), $27.59 (April 15 low).
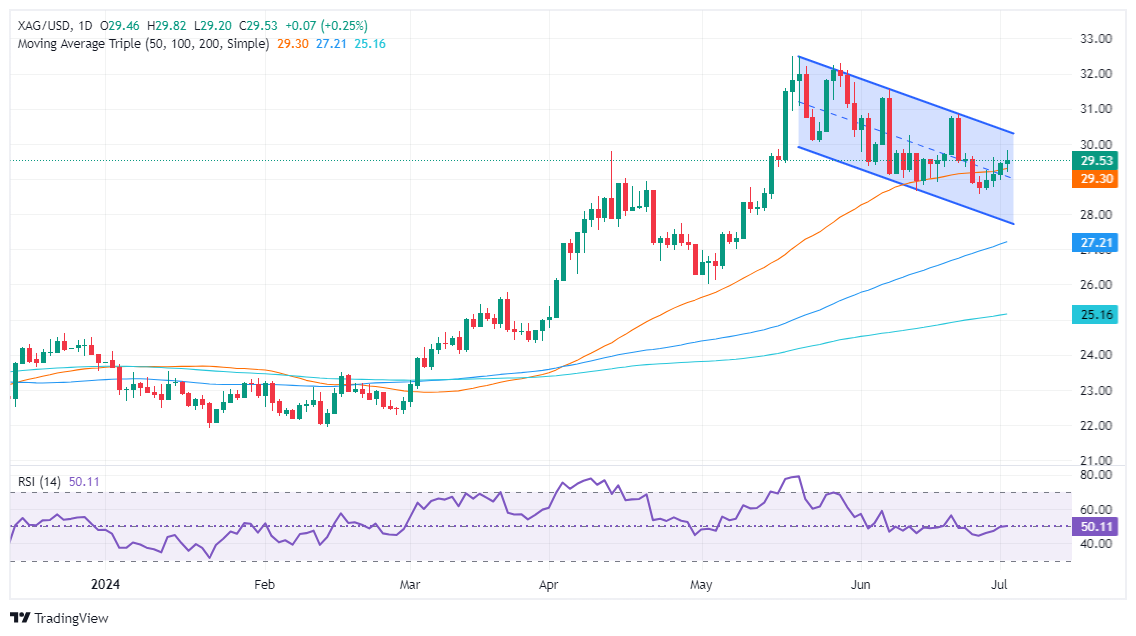
Silver prices rose as Tuesday’s North American session finished, trading at $29.51 and registering gains of more than 0.20% at the time of writing. The grey metal advanced as Fed Chair Jerome Powell delivered hawkish remarks in an ECB event in Portugal, where he acknowledged that the Fed’s dual mandate risks are more balanced.
XAG/USD Price Analysis: Technical outlook
Silver’s uptrend remains intact but is capped to the upside and downside by a descending channel. Although it has formed a ‘double bottom’ chart pattern, buyers lack the momentum to clear the top of the channel, as depicted by the Relative Strength Index (RSI) almost flat at the neutral midline.
To confirm the ‘double bottom’ chart pattern, XAG/USD needs to crack the next resistance level, which is $29.50. Once surpassed the next stop would be the neckline' at $30.84, the June 21 high, followed by the May 29 peak of $32.29. A breach of the latter will expose the year-to-date (YTD) high of $32.51.
Conversely, if XAG/USD falls below $29.00, the next support level would be the June 26 low of $28.57. Clearing this level could lead to a drop to the April 15 swing low of $27.59.
XAG/USD Price Action – Daily Chart
Economic Indicator
Fed Interest Rate Decision
The Federal Reserve (Fed) deliberates on monetary policy and makes a decision on interest rates at eight pre-scheduled meetings per year. It has two mandates: to keep inflation at 2%, and to maintain full employment. Its main tool for achieving this is by setting interest rates – both at which it lends to banks and banks lend to each other. If it decides to hike rates, the US Dollar (USD) tends to strengthen as it attracts more foreign capital inflows. If it cuts rates, it tends to weaken the USD as capital drains out to countries offering higher returns. If rates are left unchanged, attention turns to the tone of the Federal Open Market Committee (FOMC) statement, and whether it is hawkish (expectant of higher future interest rates), or dovish (expectant of lower future rates).
Read more.Last release: Wed Jun 12, 2024 18:00
Frequency: Irregular
Actual: 5.5%
Consensus: 5.5%
Previous: 5.5%
Source: Federal Reserve
- NZD/JPY trades neutral around 98.00 as buyers take a breather.
- The cross might find supports at the 97.50-97.00 range for deep corrections.
On Tuesday, the NZD/JPY pair noted neutral movements as indicators retreated from overbought levels, and the cross called for a slight correction.
The daily chart's Relative Strength Index (RSI) which approached overbought levels on Monday has shown a decline, indicating a potential cooldown in the bullish run observed last week. Even as the bullish drive remains the leading factor for this pair, the Moving Average Convergence Divergence (MACD) manifests red bars, implying that the recent bullish acceleration might be easing off.
NZD/JPY daily chart
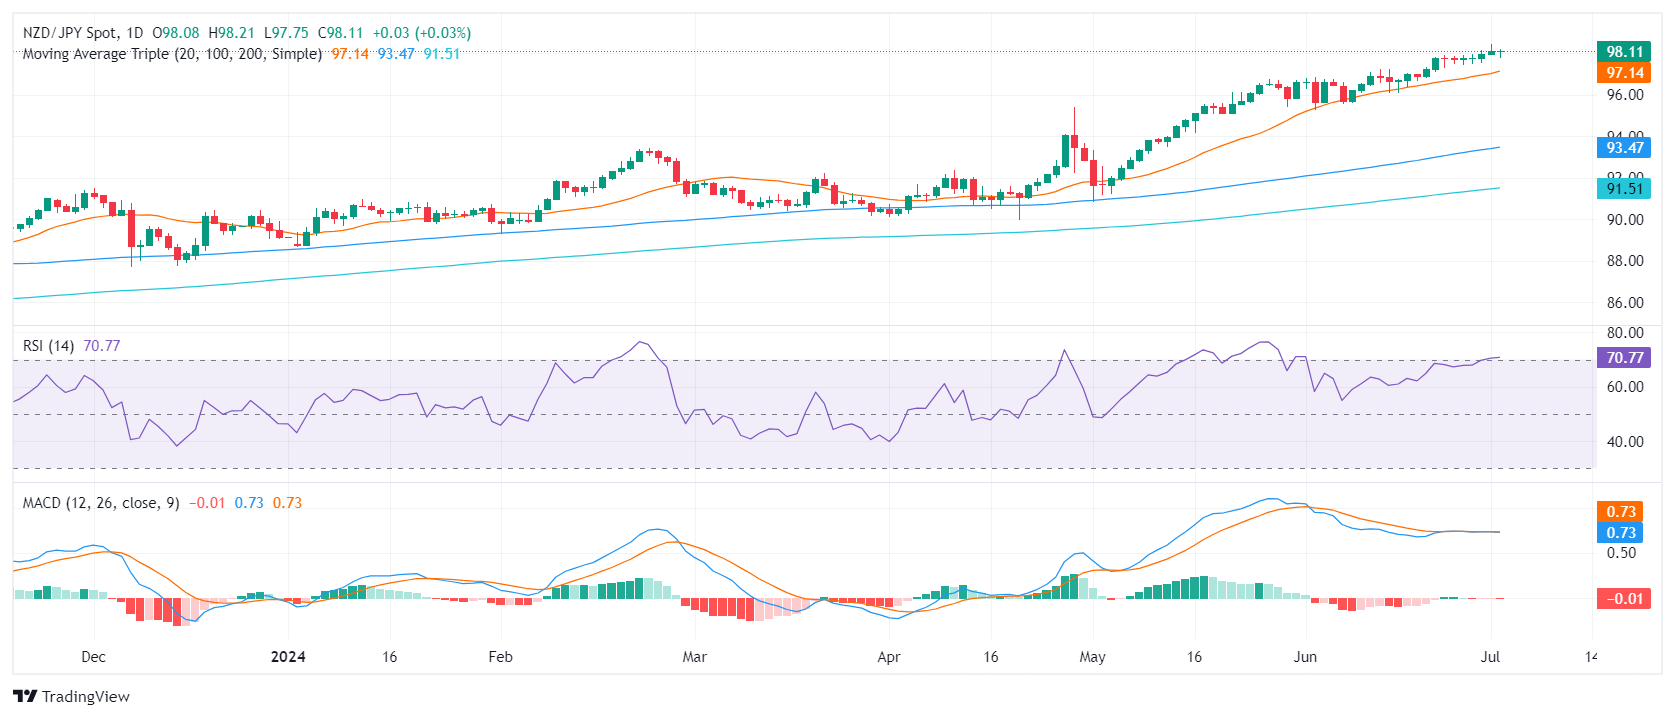
Looking ahead, in case of further correction, immediate support is currently seen at 97.50, and near the 20-day Simple Moving Average (SMA) at the 97.00 mark. Buyers ought to concentrate on defending these levels prior to targeting newer peaks.
- GBP/JPY is on pace to clip into 205.00 as the pair machines through multi-year highs.
- A lack of notable data on Tuesday left the Guppy free to drift higher.
- UK Parliamentary Elections loom ahead on Thursday.
GBP/JPY drifted into yet another 16-year high on Tuesday, peaking near 204.85 as the pair continues to grind towards 205.00. The Japanese Yen is crumbling in broader FX markets as currency traders shrug off outright pleas and threats of direct intervention from the Bank of Japan (BoJ) and Japan’s Ministry of Finance (MoF).
Tuesday was notably light on data releases for both the GBP and the JPY, giving the Guppy room to breathe and test into fresh highs as bids continue to push into ground unseen since August of 2008. The economic calendar remains thin for both currencies through the remainder of the trading week, but UK Parliamentary Elections slated for Thursday could introduce some volatility into the election run-up and after results are tallied. The UK’s Labour Party is broadly expected to sweep to a majority win according to advance polling, and Labour’s Keir Starmer is expected to replace the Conservative Party’s Tory leader Rishi Sunak as the UK’s Prime Minister.
Japanese data remains notably thin looking to the weeks ahead, leaving Yen traders to keep an eye out for one-off statements from officials as JPY speculators hunker down for the long wait to the BoJ’s next rate call, slated for July 31.
GBP/JPY technical outlook
GBP/JPY continues to lean firmly bullish as intraday price gains accelerate into the top side. The pair is set to snap the 205.00 major price handle, and the pair would have to decline a full percent just to cross back into bearish territory below the 200-hour Exponential Moving Average (EMA) approaching 203.00.
The Guppy has closed in the green for 12 consecutive trading days, and a long-term bullish trend with few pullbacks has left the pair deep in bull country, trading well above significant technical levels at the 200-day EMA, way below current price action at 190.54.
GBP/JPY hourly chart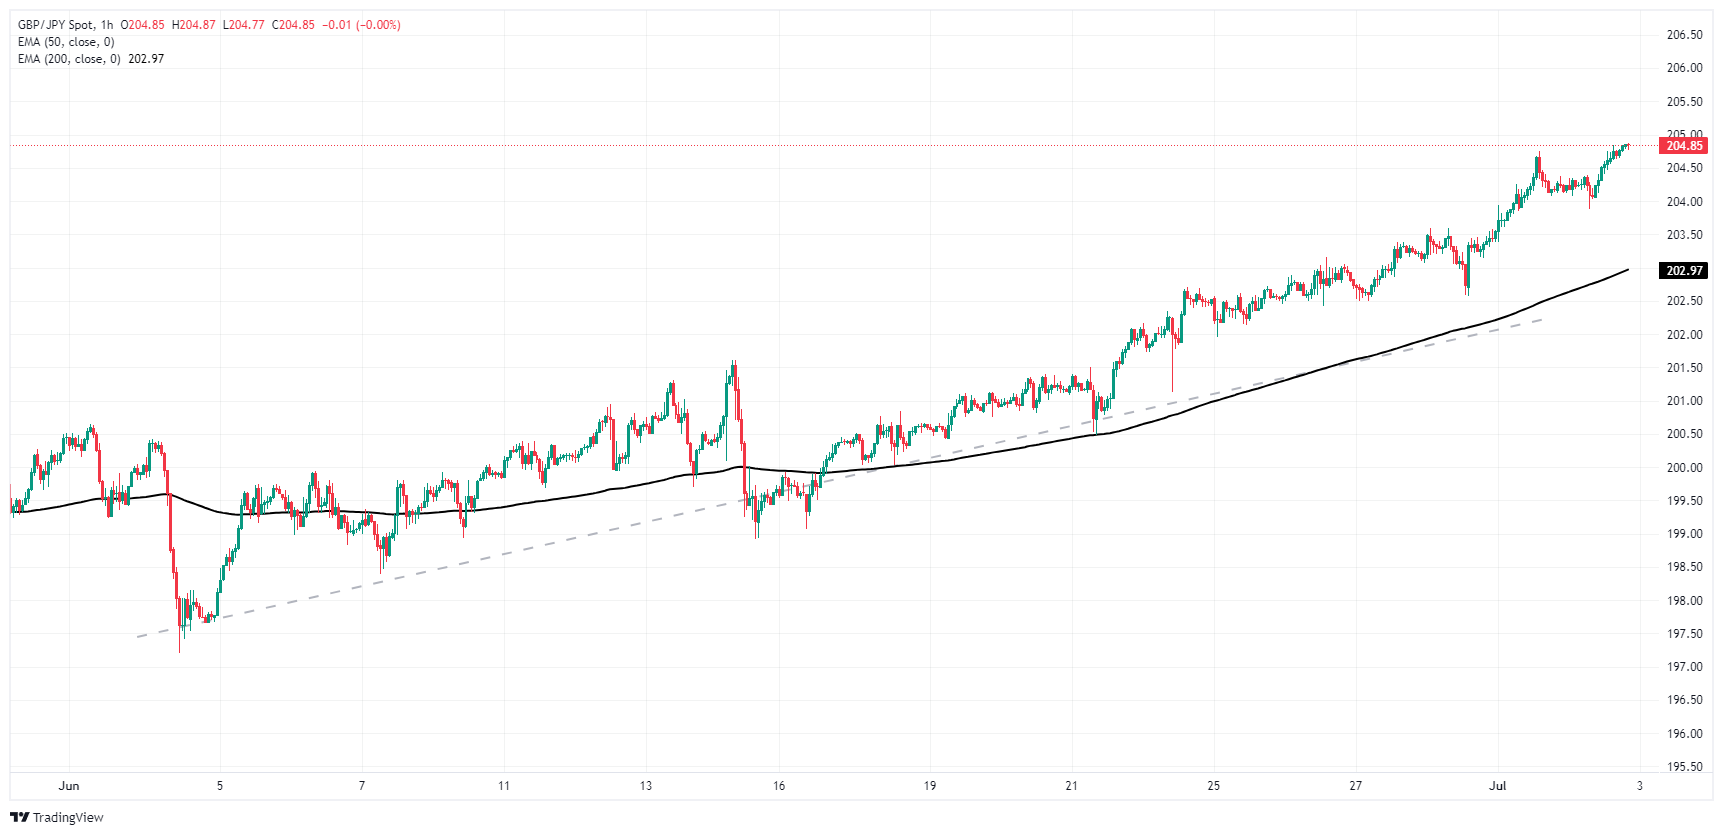
GBP/JPY daily chart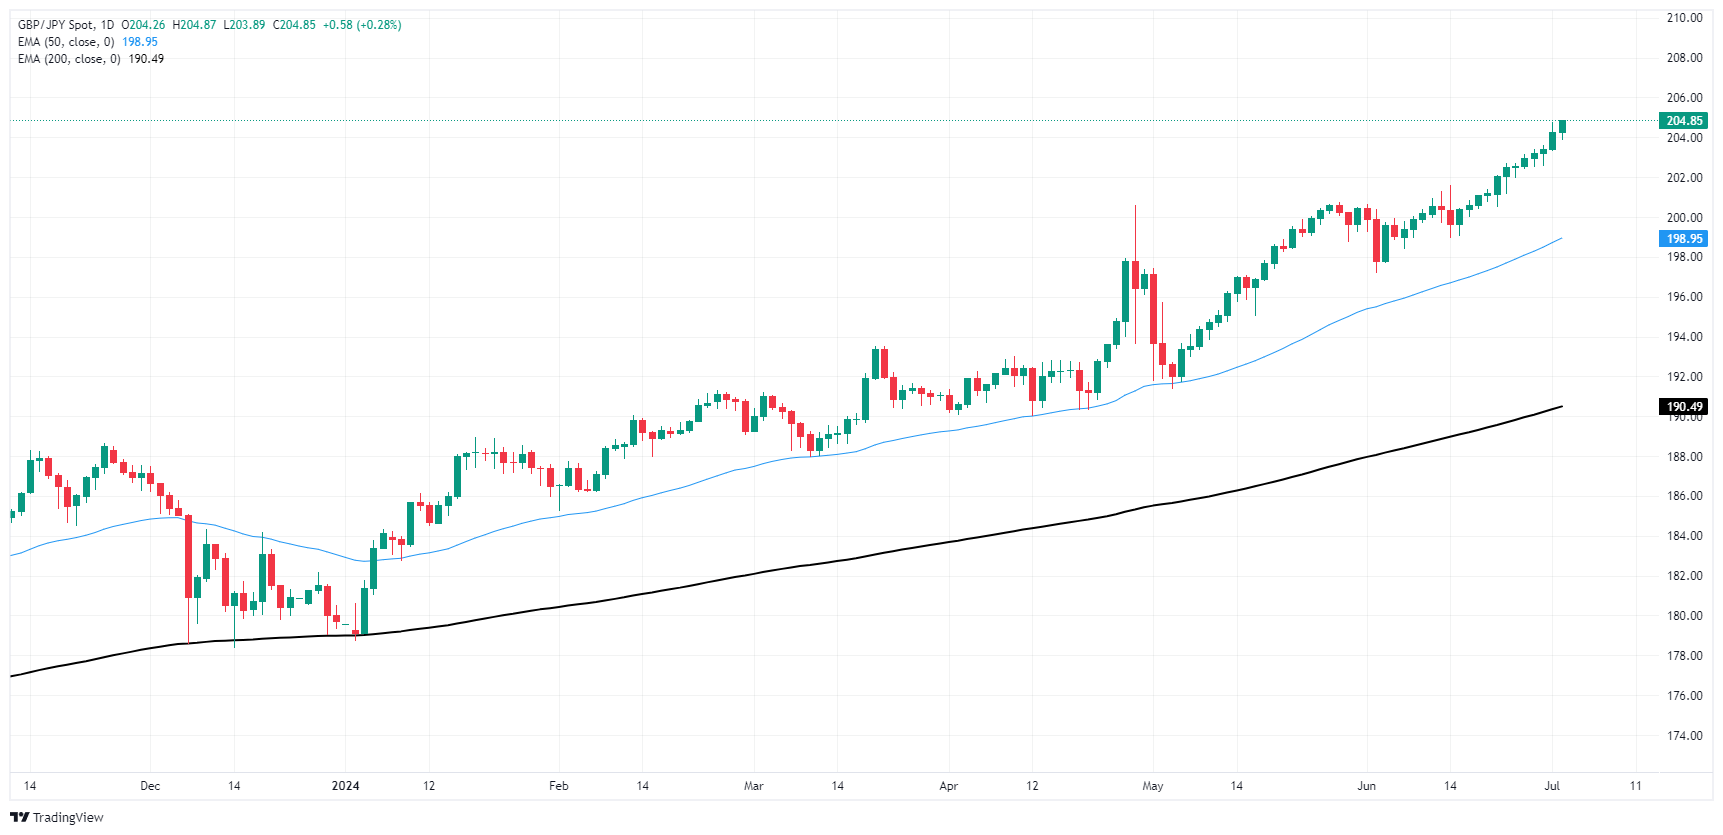
Pound Sterling FAQs
The Pound Sterling (GBP) is the oldest currency in the world (886 AD) and the official currency of the United Kingdom. It is the fourth most traded unit for foreign exchange (FX) in the world, accounting for 12% of all transactions, averaging $630 billion a day, according to 2022 data. Its key trading pairs are GBP/USD, aka ‘Cable’, which accounts for 11% of FX, GBP/JPY, or the ‘Dragon’ as it is known by traders (3%), and EUR/GBP (2%). The Pound Sterling is issued by the Bank of England (BoE).
The single most important factor influencing the value of the Pound Sterling is monetary policy decided by the Bank of England. The BoE bases its decisions on whether it has achieved its primary goal of “price stability” – a steady inflation rate of around 2%. Its primary tool for achieving this is the adjustment of interest rates. When inflation is too high, the BoE will try to rein it in by raising interest rates, making it more expensive for people and businesses to access credit. This is generally positive for GBP, as higher interest rates make the UK a more attractive place for global investors to park their money. When inflation falls too low it is a sign economic growth is slowing. In this scenario, the BoE will consider lowering interest rates to cheapen credit so businesses will borrow more to invest in growth-generating projects.
Data releases gauge the health of the economy and can impact the value of the Pound Sterling. Indicators such as GDP, Manufacturing and Services PMIs, and employment can all influence the direction of the GBP. A strong economy is good for Sterling. Not only does it attract more foreign investment but it may encourage the BoE to put up interest rates, which will directly strengthen GBP. Otherwise, if economic data is weak, the Pound Sterling is likely to fall.
Another significant data release for the Pound Sterling is the Trade Balance. This indicator measures the difference between what a country earns from its exports and what it spends on imports over a given period. If a country produces highly sought-after exports, its currency will benefit purely from the extra demand created from foreign buyers seeking to purchase these goods. Therefore, a positive net Trade Balance strengthens a currency and vice versa for a negative balance.
- Buyers steer AUD/NZD upwards, raising the pair near 1.0990 and then stabilizing at 1.0970.
- Firms in New Zealand expect a deterioration of the economic outlook according to the NZIER Survey of Business Opinion.
- RBA minutes from the June meeting confirmed a hawkish stance from the RBA.
The AUD/NZD buyers took the initiative on Tuesday. The steady stance by the Reserve Bank of Australia (RBA) seen in the latest minutes has raised market speculation for an interest rate hike in the August meeting, providing impetus to the pair's upward movement. The gloomy outlook in New Zealand is also pushing the pair upwards.
In New Zealand, the market is focused on the Q2 NZIER Survey of Business Opinion (QSBO) released this Tuesday. The survey showed that a great portion of the firm's survey expects a slowdown in the New Zealand economy over the coming year. Regarding the Reserve Bank of New Zealand, contrary to market expectations for a cut in November, the bank has its first rate cut planned for Q3 2025. However, if the economy shows more signs of weakening, the bank might consider earlier reductions.
Meanwhile, in Australia, the RBA's June meeting minutes underscored the bank's hawkish stance. Key reasons for maintaining the policy rate included uncertainty around consumption data and clear financial stress on many households and reaffirmed its intention of doing anything necessary to bring inflation down which boosted bets on a hike. The upcoming May Retail Sales data, due this Wednesday, is expected to further tilt the scale in favor of an RBA policy rate hike. In light of this and the stubbornly high inflation, markets now see nearly 40% odds of a rate hike on September 24, rising to nearly 50% for November 5.
AUD/NZD technical analysis
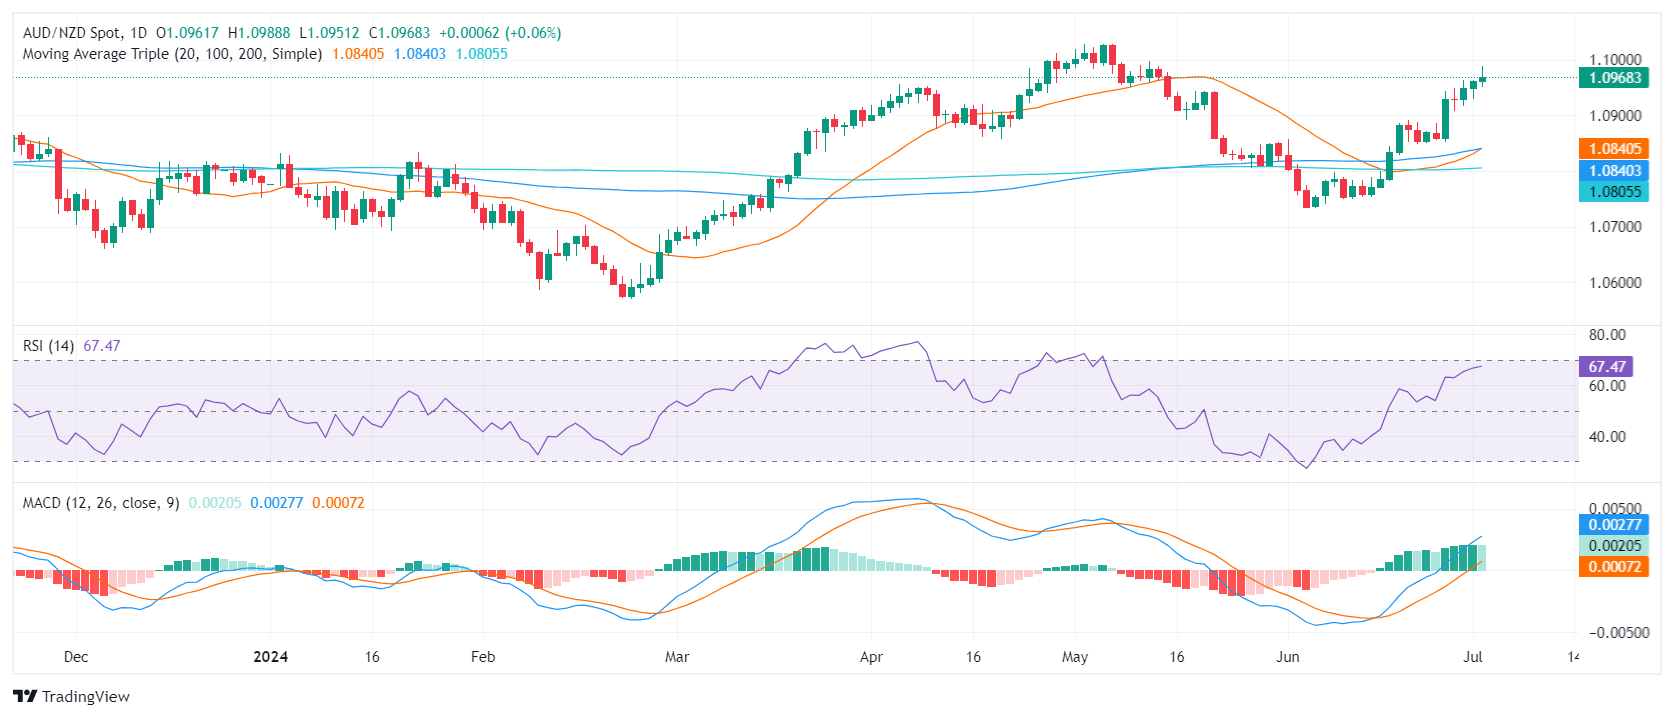
Short-term, the technical view of AUD/NZD remains bullish, but indicators nearing overbought conditions may indicate that a correction looms. The Relative Strength Index (RSI) is approaching 70 and the Moving Average Convergence Divergence (MACD) is printing rising green bars.
On the downside, supports are lining up at 1.0950, 1.0930, and 1.0900. The 1.1000 target is the next resistance for the purchasers. The risks of a potential correction seem to loom, but as long as the cross maintains its position above the 20, 100, and 200-day Simple Moving Averages (SMA) the outlook will remain positive.
AUD/NZD daily chart
- USD/CHF continues to advance as bulls gain momentum.
- Next resistance levels: psychological 0.9050, followed by 0.9100 and May 24 high of 0.9158.
- Key support levels: 50-DMA at 0.9029, followed by the 0.9000 figure and 100-DMA at 0.8982.
The USD/CHF extended its rally for the second consecutive trading day after registering gains of 0.47% on Monday. It traded at 0.9042 on Tuesday, above its opening price of 0.20%.
USD/CHF Price Analysis: Technical outlook
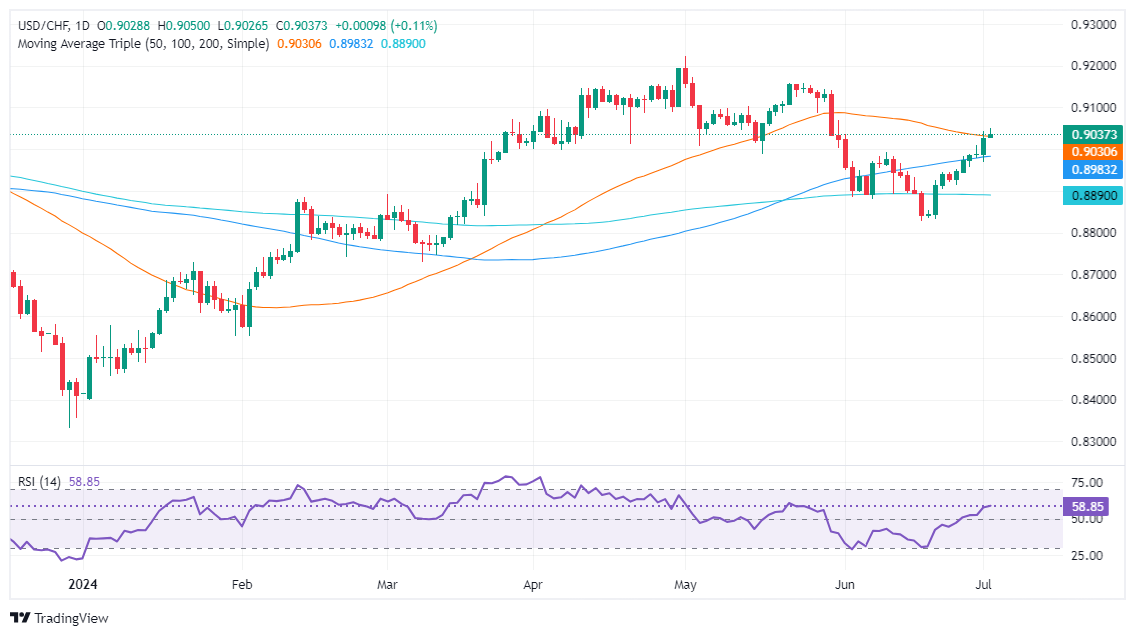
The USD/CHF resumed its uptrend after a pullback dragged the exchange rate to a three-month low of 0.8826. Since then, the Greenback has staged a recovery, as the pair has rallied more than 2.20%, surpassing key technical levels on its way north, like the 200-day and 100-day moving averages (DMAs), each at 0.8895 and 0.8982, respectively.
Momentum supports buyers, as depicted by the Relative Strength Index (RSI).
On further USD/CHF strength, the pair could challenge the 0.9050 psychological level. Once cleared, the next stop would be 0.9100, followed by the May 24 high of 0.9158.
Conversely, the USD/CHF first support would be the 50-DMA at 0.9029. If surpassed, up next would be the 0.9000 figure, ahead of challenging the 100-DMA at 0.8982.
USD/CHF Price Action – Daily Chart
Swiss Franc FAQs
The Swiss Franc (CHF) is Switzerland’s official currency. It is among the top ten most traded currencies globally, reaching volumes that well exceed the size of the Swiss economy. Its value is determined by the broad market sentiment, the country’s economic health or action taken by the Swiss National Bank (SNB), among other factors. Between 2011 and 2015, the Swiss Franc was pegged to the Euro (EUR). The peg was abruptly removed, resulting in a more than 20% increase in the Franc’s value, causing a turmoil in markets. Even though the peg isn’t in force anymore, CHF fortunes tend to be highly correlated with the Euro ones due to the high dependency of the Swiss economy on the neighboring Eurozone.
The Swiss Franc (CHF) is considered a safe-haven asset, or a currency that investors tend to buy in times of market stress. This is due to the perceived status of Switzerland in the world: a stable economy, a strong export sector, big central bank reserves or a longstanding political stance towards neutrality in global conflicts make the country’s currency a good choice for investors fleeing from risks. Turbulent times are likely to strengthen CHF value against other currencies that are seen as more risky to invest in.
The Swiss National Bank (SNB) meets four times a year – once every quarter, less than other major central banks – to decide on monetary policy. The bank aims for an annual inflation rate of less than 2%. When inflation is above target or forecasted to be above target in the foreseeable future, the bank will attempt to tame price growth by raising its policy rate. Higher interest rates are generally positive for the Swiss Franc (CHF) as they lead to higher yields, making the country a more attractive place for investors. On the contrary, lower interest rates tend to weaken CHF.
Macroeconomic data releases in Switzerland are key to assessing the state of the economy and can impact the Swiss Franc’s (CHF) valuation. The Swiss economy is broadly stable, but any sudden change in economic growth, inflation, current account or the central bank’s currency reserves have the potential to trigger moves in CHF. Generally, high economic growth, low unemployment and high confidence are good for CHF. Conversely, if economic data points to weakening momentum, CHF is likely to depreciate.
As a small and open economy, Switzerland is heavily dependent on the health of the neighboring Eurozone economies. The broader European Union is Switzerland’s main economic partner and a key political ally, so macroeconomic and monetary policy stability in the Eurozone is essential for Switzerland and, thus, for the Swiss Franc (CHF). With such dependency, some models suggest that the correlation between the fortunes of the Euro (EUR) and the CHF is more than 90%, or close to perfect.
The Greenback traded slightly on the defensive against the backdrop of another session of muted price action in the FX galaxy. In the meantime, Chief Powell and President Lagarde left no room for surprises at their discussion panel at the ECB Forum. Meanwhile, investors get ready for a slew of US data releases on Wednesday, along with the FOMC Minutes, prior to the US Independence Day holiday and the UK general elections on July 4.
Here is what you need to know on Wednesday, July 3:
The USD Index (DXY) maintained its bearish stance in place for the fourth session in a row, although navigating tight ranges and always below the 106.00 hurdle. A busy calendar on July 3 will see the release of weekly Mortgage Applications in the first turn, seconded by the ADP Employment Change and Balance of Trade. In addition, Initial Jobless Claims come later prior to the final S&P Global Services PMI, Factory Orders, the ISM Services PMI and the FOMC Minutes.
EUR/USD advanced modestly and revisited the 1.0750 zone amidst a generalized muted price action in the global markets. On July 3, the ECB Forum will enter its third day, while the final HCOB Services PMI in Germany and the broader euro bloc are due.
Everything was flat but GBP/USD on Tuesday, as the pair managed to print marked gains and extend its recovery for the fourth consecutive session. The final S&P Global Services PMI will be released on July 3.
USD/JPY advanced marginally on Tuesday, although it was enough to clinch another multi-decade top in the 161.70–161.75 band. The final print of the Jibun Bank Services PMI is expected on July 3.
AUD/USD remained sidelined in the sub-0.6700 region, managing to partially fade the negative start to the week. In Oz, the Ai Group Industry Index is due on July 3, ahead of the final Judo Bank Services PMI and preliminary readings of Building Permits and Retail Sales.
Prices of WTI rose to fresh three-month highs north of the $84.00 mark per barrel, just to give away all those gains and return to the sub-$83.00 region towards the end of the NA session on Tuesday.
Prices of Gold navigated a narrow range near $2,330 per ounce troy amidst the broader consolidative phase in place since mid-May. Silver, on the flip side, printed acceptable gains and extended its recovery for yet another session, retargeting the key $30.00 mark per ounce.
- Gold falls 0.28%, reacting to Powell’s ECB forum remarks.
- Powell is cautiously optimistic on disinflation, emphasizes need for more progress before rate cuts.
- US Treasury yields steady, while US Dollar fluctuates in familiar range.
- Strong US labor data: Job vacancies exceed expectations, highlighting economic resilience.
Gold price slid during the North American session as market participants digested Federal Reserve (Fed) Chair Jerome Powell’s comments at a European Central Bank (ECB) forum in Portugal. Powell turned slightly dovish, yet US Treasury yields remained firm. The Greenback fluctuated but remained within familiar levels. Therefore, the XAU/USD trades at $2,324, down 0.28%.
Powell commented that the disinflation process has resumed yet stated that he’d like to see further progress before cutting interest rates. He added, “Because the US economy is strong and the labor market is strong, we have the ability to take our time and get this right.”
He acknowledged the Fed’s dual mandate risks had become more balanced, noting that “we have to manage them.”
US jobs data revealed that job vacancies surprisingly rose above estimates, displaying the robustness of the labor market amid high interest rates of 5.25%-5.50% set by the Fed.
Further data is expected on Wednesday, led by the release of the Federal Open Market Committee's (FOMC) last Meeting Minutes, alongside Services PMIs from S&P Global and the Institute for Supply Management (ISM).
Data will resume on Friday as US markets will be closed on Thursday due to Independence Day. By Friday, traders will be focused on June’s Nonfarm Payrolls (NFP) report.
Daily digest market movers: Gold price retreats below $2,330 amid strong JOLTS data
- US Bureau of Labor Statistics released May Job Openings and Labor Turnover reports, which showed 8.14 million job vacancies, exceeding forecasts and April’s 7.919 million, the lowest level in three years.
- US business activity in the manufacturing sector showed mixed results. Traders are now focusing on the upcoming release of service sector data on Wednesday.
- According to the CME FedWatch Tool, odds for a 25-basis-point Fed rate cut in September are at 63%, up from 58% on Monday.
- December 2024 fed funds rate futures contract implies that the Fed will ease policy by just 36 basis points (bps) toward the end of the year.
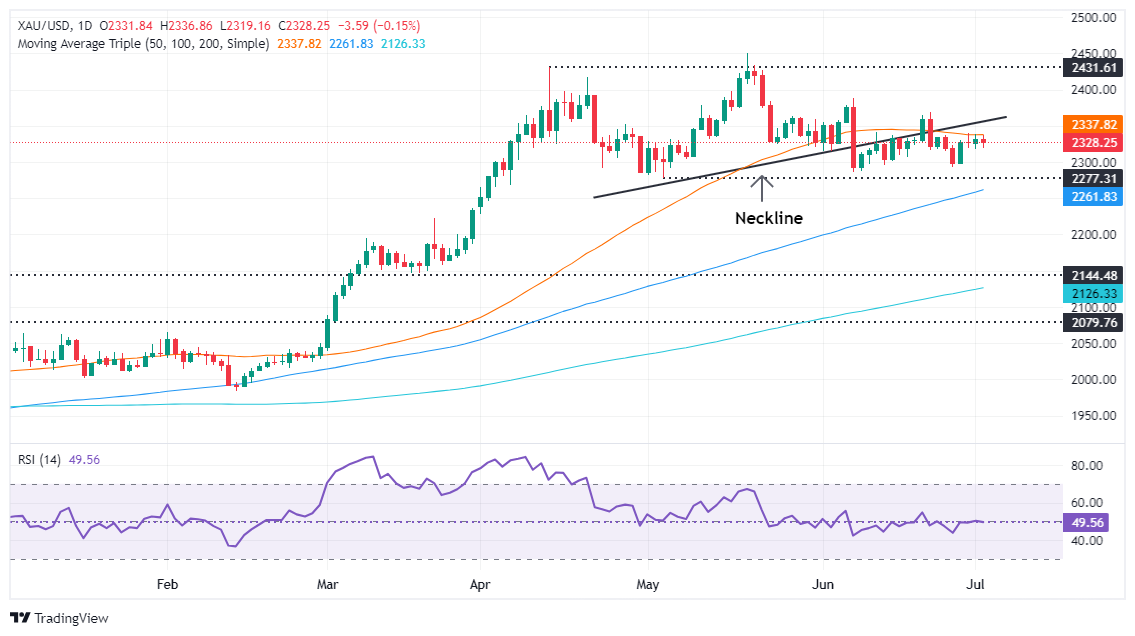
Technical analysis: Gold price fluctuates nearby Head-and-Shoulders neckline
Gold is upwardly biased but consolidates near the Head-and-Shoulders neckline around $2,320-$2,350. Despite the bearish chart pattern, momentum has turned neutral with the Relative Strength Index (RSI) nearing its 50-neutral line. That indicates a stalemate between buyers and sellers.
For a bearish continuation, sellers must drive prices below $2,300. If successful, the next demand zone would be the May 3 low of $2,277, followed by the March 21 high of $2,222. Further declines would target the Head-and-Shoulders pattern objective between $2,170 and $2,160.
Conversely, if buyers break through $2,350, they would aim for key resistance levels, such as the June 7 cycle high of $2,387, eventually targeting the $2,400 mark.
Gold FAQs
Gold has played a key role in human’s history as it has been widely used as a store of value and medium of exchange. Currently, apart from its shine and usage for jewelry, the precious metal is widely seen as a safe-haven asset, meaning that it is considered a good investment during turbulent times. Gold is also widely seen as a hedge against inflation and against depreciating currencies as it doesn’t rely on any specific issuer or government.
Central banks are the biggest Gold holders. In their aim to support their currencies in turbulent times, central banks tend to diversify their reserves and buy Gold to improve the perceived strength of the economy and the currency. High Gold reserves can be a source of trust for a country’s solvency. Central banks added 1,136 tonnes of Gold worth around $70 billion to their reserves in 2022, according to data from the World Gold Council. This is the highest yearly purchase since records began. Central banks from emerging economies such as China, India and Turkey are quickly increasing their Gold reserves.
Gold has an inverse correlation with the US Dollar and US Treasuries, which are both major reserve and safe-haven assets. When the Dollar depreciates, Gold tends to rise, enabling investors and central banks to diversify their assets in turbulent times. Gold is also inversely correlated with risk assets. A rally in the stock market tends to weaken Gold price, while sell-offs in riskier markets tend to favor the precious metal.
The price can move due to a wide range of factors. Geopolitical instability or fears of a deep recession can quickly make Gold price escalate due to its safe-haven status. As a yield-less asset, Gold tends to rise with lower interest rates, while higher cost of money usually weighs down on the yellow metal. Still, most moves depend on how the US Dollar (USD) behaves as the asset is priced in dollars (XAU/USD). A strong Dollar tends to keep the price of Gold controlled, whereas a weaker Dollar is likely to push Gold prices up.
- AUD/USD continues sideways trading around 20-day SMA.
- Fed Minutes on Wednesday follow RBA’s turn.
- May’s Retail Sales from Australia and US ADP figures are also due on Wednesday.
- Powell showed confidence in inflation coming back down to 2% sooner than expected.
Tuesday's session witnessed the Australian Dollar (AUD) clearing losses against the US Dollar following the release of the hawkish Reserve Bank of Australia (RBA) minutes and the US JOLTs figures from May. For the USD, the confidence of Jerome Powell on inflation coming back down sooner on the prospects of a cooling labor market weakened the Greenback.
The Australian economy exhibits some signs of weakness. Nevertheless, the persistently high inflation is prompting the RBA to delay potential rate cuts. The RBA is set to be among the last G10 countries' central banks to start reducing rates, which may limit the downside of the Aussie.
Daily digest market movers: Aussie clears losses as market assesses latest RBA minutes
- RBA Minutes from June meeting offered more details on bank’s hold stance. One of the main reasons that the RBA members saw a stronger case to leave the policy rate unchanged rather than a hike was because of the “uncertainty around the data for consumption and clear evidence that many households were experiencing financial stress.”
- On Wednesday, sales figures for May in Australia will be reported. The expectation is for a 0.3% MoM rise compared with 0.1% in April and its outcome will be key.
- Markets predict a 25% chance of a 25-basis-point rate increase at the next August 6 meeting from the RBA.
- In the US, JOLT Job Openings came in above 8 million in May.
- In addition, Jerome Powell was on the wires and admitted some progress on inflation and that the rate may reach 2% the next year.
- As for now, the market sees 70% odds of a Federal Reserve rate cut in September but will heavily depend on the upcoming data.
Technical analysis: AUD/USD sways above the 20-day SMA
From a technical perspective, the AUD/USD has continued a trend of sideways trading since mid-May. The 20-day Simple Moving Average (SMA) at 0.6640 provides strong support, with further support found at levels 0.6620 and 0.6600. The critical resistance levels are currently set at 0.6660, 0.6690 and 0.6700. This supports a continuation of the established 0.6600-0.6700 range.
RBA FAQs
The Reserve Bank of Australia (RBA) sets interest rates and manages monetary policy for Australia. Decisions are made by a board of governors at 11 meetings a year and ad hoc emergency meetings as required. The RBA’s primary mandate is to maintain price stability, which means an inflation rate of 2-3%, but also “..to contribute to the stability of the currency, full employment, and the economic prosperity and welfare of the Australian people.” Its main tool for achieving this is by raising or lowering interest rates. Relatively high interest rates will strengthen the Australian Dollar (AUD) and vice versa. Other RBA tools include quantitative easing and tightening.
While inflation had always traditionally been thought of as a negative factor for currencies since it lowers the value of money in general, the opposite has actually been the case in modern times with the relaxation of cross-border capital controls. Moderately higher inflation now tends to lead central banks to put up their interest rates, which in turn has the effect of attracting more capital inflows from global investors seeking a lucrative place to keep their money. This increases demand for the local currency, which in the case of Australia is the Aussie Dollar.
Macroeconomic data gauges the health of an economy and can have an impact on the value of its currency. Investors prefer to invest their capital in economies that are safe and growing rather than precarious and shrinking. Greater capital inflows increase the aggregate demand and value of the domestic currency. Classic indicators, such as GDP, Manufacturing and Services PMIs, employment, and consumer sentiment surveys can influence AUD. A strong economy may encourage the Reserve Bank of Australia to put up interest rates, also supporting AUD.
Quantitative Easing (QE) is a tool used in extreme situations when lowering interest rates is not enough to restore the flow of credit in the economy. QE is the process by which the Reserve Bank of Australia (RBA) prints Australian Dollars (AUD) for the purpose of buying assets – usually government or corporate bonds – from financial institutions, thereby providing them with much-needed liquidity. QE usually results in a weaker AUD.
Quantitative tightening (QT) is the reverse of QE. It is undertaken after QE when an economic recovery is underway and inflation starts rising. Whilst in QE the Reserve Bank of Australia (RBA) purchases government and corporate bonds from financial institutions to provide them with liquidity, in QT the RBA stops buying more assets, and stops reinvesting the principal maturing on the bonds it already holds. It would be positive (or bullish) for the Australian Dollar.
- Dow Jones struggled to make gains on Tuesday, underperforming other indexes.
- Fedspeak is cautiously tilting towards rate cuts, but more progress remains.
- Key US data looms ahead this week with Friday’s NFP over the horizon.
The Dow Jones Industrial Average (DJIA) churned close to flat on Monday, despite an overall uptick in investor risk appetite after Federal Reserve (Fed) officials gave a head-nod to easing inflation pressure in US economic data.
US JOLTS Jobs Openings in May ticked up slightly to 8.14 million MoM, easing above the forecast hold near 7.91 million. A slight uptick in available jobs helps to ease tightness in the labor market, giving risk appetite a leg up as softening labor figures will help to bolster rate cut odds from the Federal Reserve (Fed).
Fedspeak has shifted to the optimistic side on the inflation outlook, helping to further prop up broad-market sentiment as markets grind towards key economic figures slated for the rest of the week. Friday’s US Nonfarm Payrolls (NFP) looms large over the horizon, with ADP Employment Change figures slated for Wednesday.
Dow Jones news
The Dow Jones index gave a firmly mixed performance on Tuesday with roughly half of the major equity index’s constituent securities trading into the green for the day. Amazon.com Inc (AMZN) rose 1.5% to $200.25 per share, while Verizon Communications Inc. (VZ) backslid -2.12%, falling to $40.85 per share.
Economic Indicator
JOLTS Job Openings
JOLTS Job Openings is a survey done by the US Bureau of Labor Statistics to help measure job vacancies. It collects data from employers including retailers, manufacturers and different offices each month.
Read more.Last release: Tue Jul 02, 2024 14:00
Frequency: Monthly
Actual: 8.14M
Consensus: 7.91M
Previous: 8.059M
Source: US Bureau of Labor Statistics
Dow Jones technical outlook
A sideways grind has plagued the Dow Jones index since it climbed back into chart territory between 39,500.00 and the 39,000.00 handle. A near-term technical ceiling is baked in at the last swing high into 39,581.00, with the 50-day Exponential Moving Average (EMA) providing an intraday price floor from 38,918.00.
The Dow Jones remains on the low side of all-time highs set just above the 40,000.00 major price handle in May, and a slow recovery from the last major swing low into 38,000.00 threatens to run out of gas.
Dow Jones five minute chart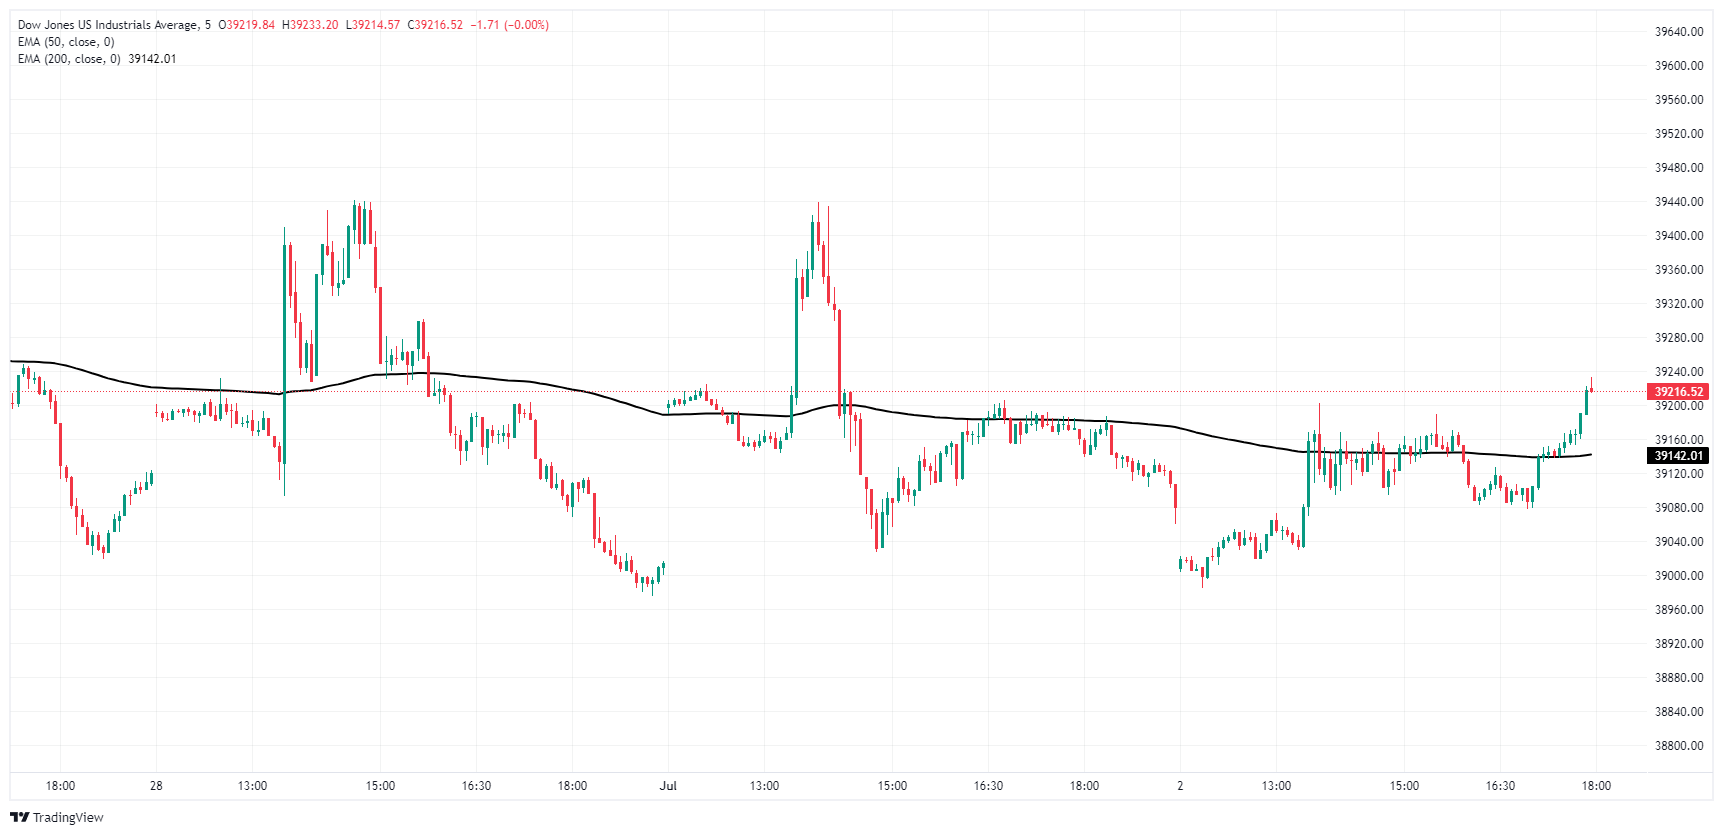
Dow Jones daily chart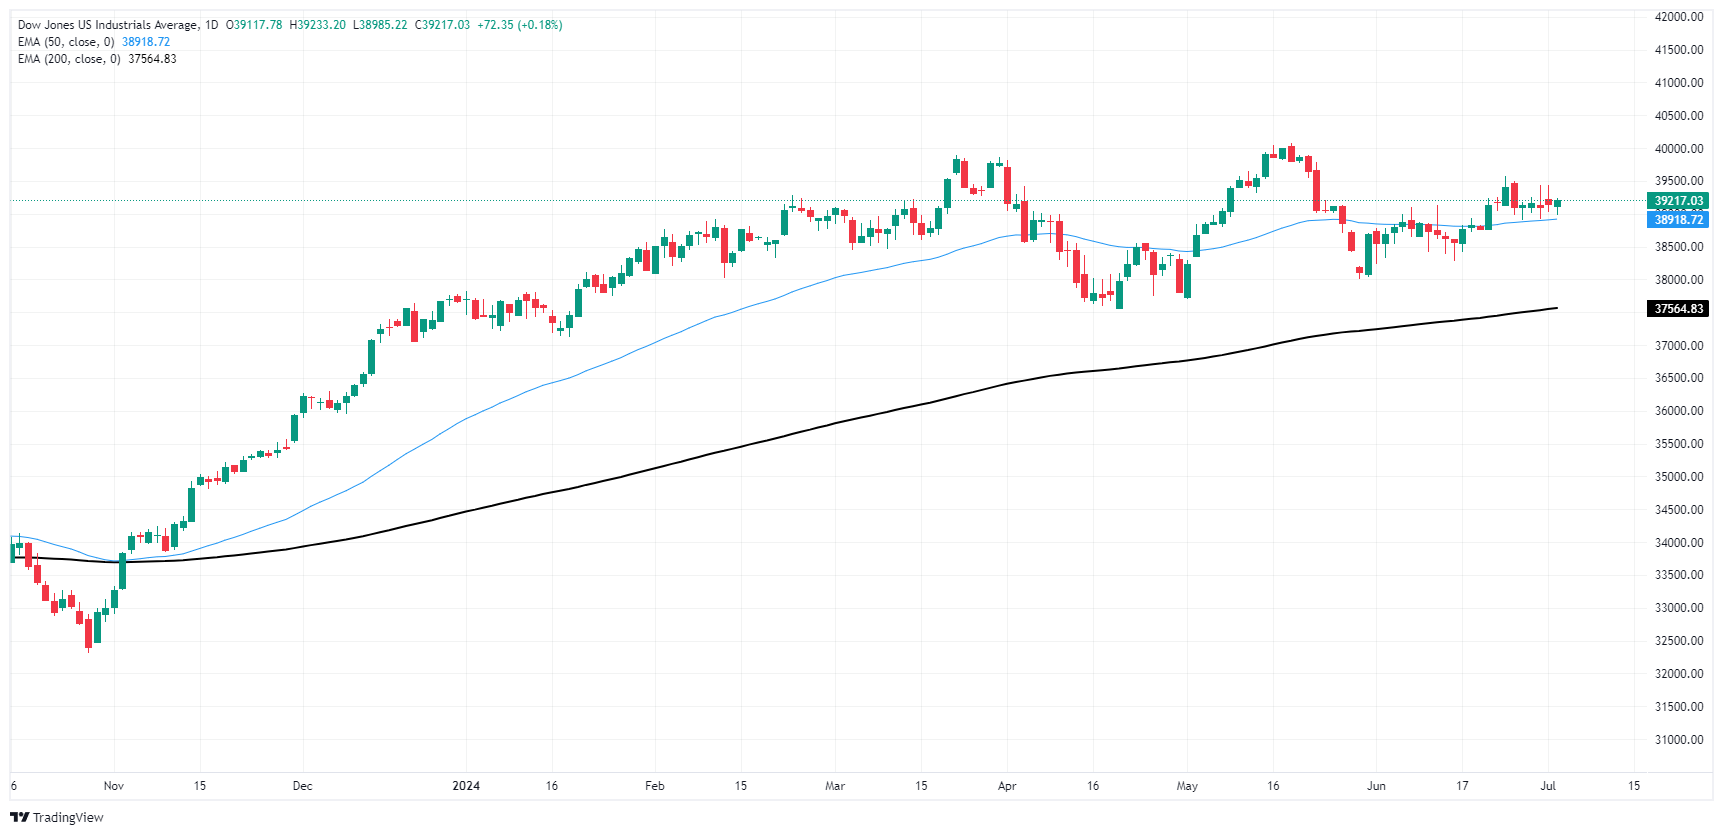
Dow Jones FAQs
The Dow Jones Industrial Average, one of the oldest stock market indices in the world, is compiled of the 30 most traded stocks in the US. The index is price-weighted rather than weighted by capitalization. It is calculated by summing the prices of the constituent stocks and dividing them by a factor, currently 0.152. The index was founded by Charles Dow, who also founded the Wall Street Journal. In later years it has been criticized for not being broadly representative enough because it only tracks 30 conglomerates, unlike broader indices such as the S&P 500.
Many different factors drive the Dow Jones Industrial Average (DJIA). The aggregate performance of the component companies revealed in quarterly company earnings reports is the main one. US and global macroeconomic data also contributes as it impacts on investor sentiment. The level of interest rates, set by the Federal Reserve (Fed), also influences the DJIA as it affects the cost of credit, on which many corporations are heavily reliant. Therefore, inflation can be a major driver as well as other metrics which impact the Fed decisions.
Dow Theory is a method for identifying the primary trend of the stock market developed by Charles Dow. A key step is to compare the direction of the Dow Jones Industrial Average (DJIA) and the Dow Jones Transportation Average (DJTA) and only follow trends where both are moving in the same direction. Volume is a confirmatory criteria. The theory uses elements of peak and trough analysis. Dow’s theory posits three trend phases: accumulation, when smart money starts buying or selling; public participation, when the wider public joins in; and distribution, when the smart money exits.
There are a number of ways to trade the DJIA. One is to use ETFs which allow investors to trade the DJIA as a single security, rather than having to buy shares in all 30 constituent companies. A leading example is the SPDR Dow Jones Industrial Average ETF (DIA). DJIA futures contracts enable traders to speculate on the future value of the index and Options provide the right, but not the obligation, to buy or sell the index at a predetermined price in the future. Mutual funds enable investors to buy a share of a diversified portfolio of DJIA stocks thus providing exposure to the overall index.
- Mexican Peso rallies after dovish remarks from Fed Chair Powell.
- Powell highlights progress on US inflation, hints at balanced risks.
- Banxico Governor Rodriguez Ceja suggests possible future rate cuts as disinflation persists.
- Banxico survey adjusts GDP, policy outlook down, forecasts 2024 USD/MXN rate at 18.73 from 17.80.
The Mexican Peso advanced against most currencies on Tuesday, particularly the US Dollar, after Federal Reserve (Fed) Chairman Jerome Powell delivered remarks perceived as dovish by market participants. This punished the Greenback, which lost some 0.70% as the USD/MXN traded at 18.22 below its opening price.
Powell commented that the US economy made significant progress on inflation while adding that the risks of the Fed’s dual mandate are more balanced. His remarks came before the release of May’s JOLTs report, which came in hotter than expected.
Aside from this, the Mexican currency gained some traction even though Bank of Mexico Governor Victoria Rodriguez Ceja was dovish, adding that the progress of disinflation can “allow us to continue discussing downward adjustments in our rate, and I consider that this is what we will be doing in our next monetary policy meetings.”
Mexico’s economic docket featured Gross Fixed Investment in April, which showed mixed readings between monthly and annual figures.
Meanwhile, Banxico’s latest survey of economic expectations showed that most private analysts have revised the Gross Domestic Product (GDP) and their monetary policy expectations downward. Regarding the USD/MXN exchange rate for 2024, economists lifted their forecasts from 17.80 to 18.73.
Daily digest market movers: Mexican Peso climbs despite expected economic deceleration
- Banxico’s survey showed that economists estimate the Gross Domestic Product (GDP) to end at 2%, down from 2.1%. They expect Banxico to cut rates from 11.00% to 10.25%, up from 10.00% projected in May.
- Mexico's Gross Fixed Investment increased in April from 0.8% to 0.9% MoM but missed estimates of 1.2%. On an annual basis, investment grew 18.1%, crushed March’s 3%, and exceeded forecasts for a 17.1% increase.
- US job openings rose in May from 7.919 million to 8.14 million, exceeding the 7.91 million projected by the consensus, revealed the US Bureau of Labor Statistics (BLS).
- US business activity in the manufacturing sector was mixed, according to S&P Global Manufacturing and the Institute for Supply Management (ISM). Traders are eyeing the release of the services sector on Wednesday.
- CME FedWatch Tool shows odds for a 25-basis-point Fed rate cut in September at 63%, up from 58% on Monday.
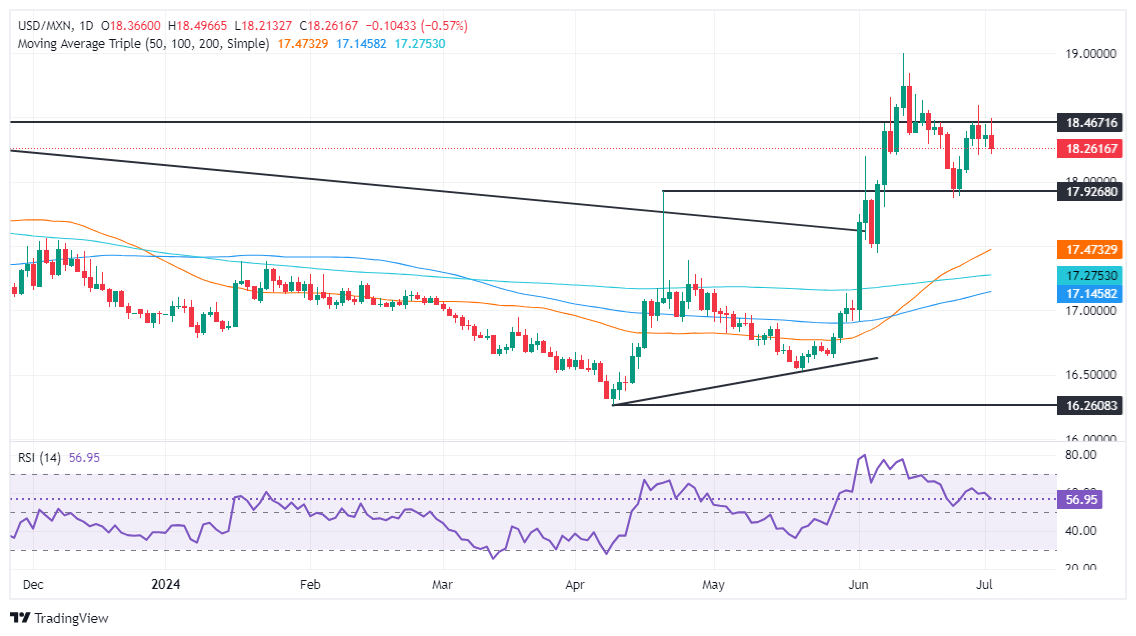
Technical analysis: Mexican Peso gains traction as USD/MXN slumps below 18.30
The USD/MXN failed to decisively crack the June 28 high of 18.59, which prompted market participants to sell the pair, which dropped below 18.30. Momentum is still in favor of buyers but aims lower, suggesting that in the near term sellers are in control.
If USD/MXN tumbles further, the next stop would be the psychological 18.00 figure. Once cleared, the next support level would be the December 5 high turned support at 17.56 before sliding toward the 50-day Simple Moving Average (SMA) at 17.37.
On the flip side, if buyers lift the spot price above 18.50, that will exacerbate a rally toward the June 28 high of 18.59 if they would like to extend their gains and challenge the year-to-date high of 18.99.
Mexican Peso FAQs
The Mexican Peso (MXN) is the most traded currency among its Latin American peers. Its value is broadly determined by the performance of the Mexican economy, the country’s central bank’s policy, the amount of foreign investment in the country and even the levels of remittances sent by Mexicans who live abroad, particularly in the United States. Geopolitical trends can also move MXN: for example, the process of nearshoring – or the decision by some firms to relocate manufacturing capacity and supply chains closer to their home countries – is also seen as a catalyst for the Mexican currency as the country is considered a key manufacturing hub in the American continent. Another catalyst for MXN is Oil prices as Mexico is a key exporter of the commodity.
The main objective of Mexico’s central bank, also known as Banxico, is to maintain inflation at low and stable levels (at or close to its target of 3%, the midpoint in a tolerance band of between 2% and 4%). To this end, the bank sets an appropriate level of interest rates. When inflation is too high, Banxico will attempt to tame it by raising interest rates, making it more expensive for households and businesses to borrow money, thus cooling demand and the overall economy. Higher interest rates are generally positive for the Mexican Peso (MXN) as they lead to higher yields, making the country a more attractive place for investors. On the contrary, lower interest rates tend to weaken MXN.
Macroeconomic data releases are key to assess the state of the economy and can have an impact on the Mexican Peso (MXN) valuation. A strong Mexican economy, based on high economic growth, low unemployment and high confidence is good for MXN. Not only does it attract more foreign investment but it may encourage the Bank of Mexico (Banxico) to increase interest rates, particularly if this strength comes together with elevated inflation. However, if economic data is weak, MXN is likely to depreciate.
As an emerging-market currency, the Mexican Peso (MXN) tends to strive during risk-on periods, or when investors perceive that broader market risks are low and thus are eager to engage with investments that carry a higher risk. Conversely, MXN tends to weaken at times of market turbulence or economic uncertainty as investors tend to sell higher-risk assets and flee to the more-stable safe havens.
- Canadian Dollar climbs across board despite Canadian PMI miss.
- Canada data remains thin on economic calendar until Friday’s labor data.
- Markets are gearing up for Friday’s US NFP print with preview data.
The Canadian Dollar (CAD) recovered ground on Tuesday after CAD traders shrugged off a slight misfire from Canadian Purchasing Managers Index (PMI) figures. Market sentiment is broadly picking up steam and carrying the Canadian Dollar into recovery mode.
Canada saw a flat print in S&P Global Manufacturing PMI figures in June, and US JOLTS Job Opening in May ticked even higher, soothing market jitters that had frayed investor sentiment around the edges on Monday.
Daily digest market movers: Canadian Dollar shrugs off PMI miss to gain lost ground
- Canadian Manufacturing PMI holds flat at 49.3 in June, missing the forecast increase to 50.2.
- As broad-market sentiment improves, CAD traders shrug off the data miss, bolstering Canadian Dollar into recovery mode.
- US JOLTS Job Openings in May rose to 8.14 million, rising above the forecast flat hold of 7.91 million.
- Fedspeak tilts into dovish side on Tuesday as Federal Reserve (Fed) officials gain hopeful inflation outlook.
- Wednesday’s US ADP Employment Change to be rough preview of Friday’s upcoming US Nonfarm Payrolls (NFP) labor data dump.
Canadian Dollar PRICE Today
The table below shows the percentage change of Canadian Dollar (CAD) against listed major currencies today. Canadian Dollar was the strongest against the Swiss Franc.
| USD | EUR | GBP | JPY | CAD | AUD | NZD | CHF | |
|---|---|---|---|---|---|---|---|---|
| USD | 0.08% | -0.13% | 0.06% | -0.30% | 0.02% | 0.09% | 0.22% | |
| EUR | -0.08% | -0.21% | 0.00% | -0.38% | -0.05% | -0.01% | 0.14% | |
| GBP | 0.13% | 0.21% | 0.23% | -0.16% | 0.13% | 0.21% | 0.34% | |
| JPY | -0.06% | 0.00% | -0.23% | -0.38% | -0.04% | -0.01% | 0.13% | |
| CAD | 0.30% | 0.38% | 0.16% | 0.38% | 0.32% | 0.39% | 0.51% | |
| AUD | -0.02% | 0.05% | -0.13% | 0.04% | -0.32% | 0.06% | 0.19% | |
| NZD | -0.09% | 0.01% | -0.21% | 0.01% | -0.39% | -0.06% | 0.13% | |
| CHF | -0.22% | -0.14% | -0.34% | -0.13% | -0.51% | -0.19% | -0.13% |
The heat map shows percentage changes of major currencies against each other. The base currency is picked from the left column, while the quote currency is picked from the top row. For example, if you pick the Canadian Dollar from the left column and move along the horizontal line to the US Dollar, the percentage change displayed in the box will represent CAD (base)/USD (quote).
Technical outlook: Canadian Dollar broadly rebounds on Tuesday
The Canadian Dollar (CAD) took a step higher on Tuesday, recovering near-term losses and climbing around one-third of one percent against the US Dollar (USD), Euro (EUR), and Japanese Yen (JPY) for the day. The CAD is firmly on pace to be Tuesday’s single best-performing currency among the major currencies.
USD/CAD has tumbled back below the 1.3700 handle after tapping a fresh near-term peak around 1.3755 this week. Intraday price action remains volatile, leaving plenty of churn on the chart. Daily candlesticks remain hung up on the 50-day Exponential Moving Average (EMA) at 1.3680. USD/CAD continues to trade north of the 200-day EMA at 1.3588, but bullish momentum has failed to chalk in fresh gains since peaking just shy of 1.3850 in April.
USD/CAD hourly chart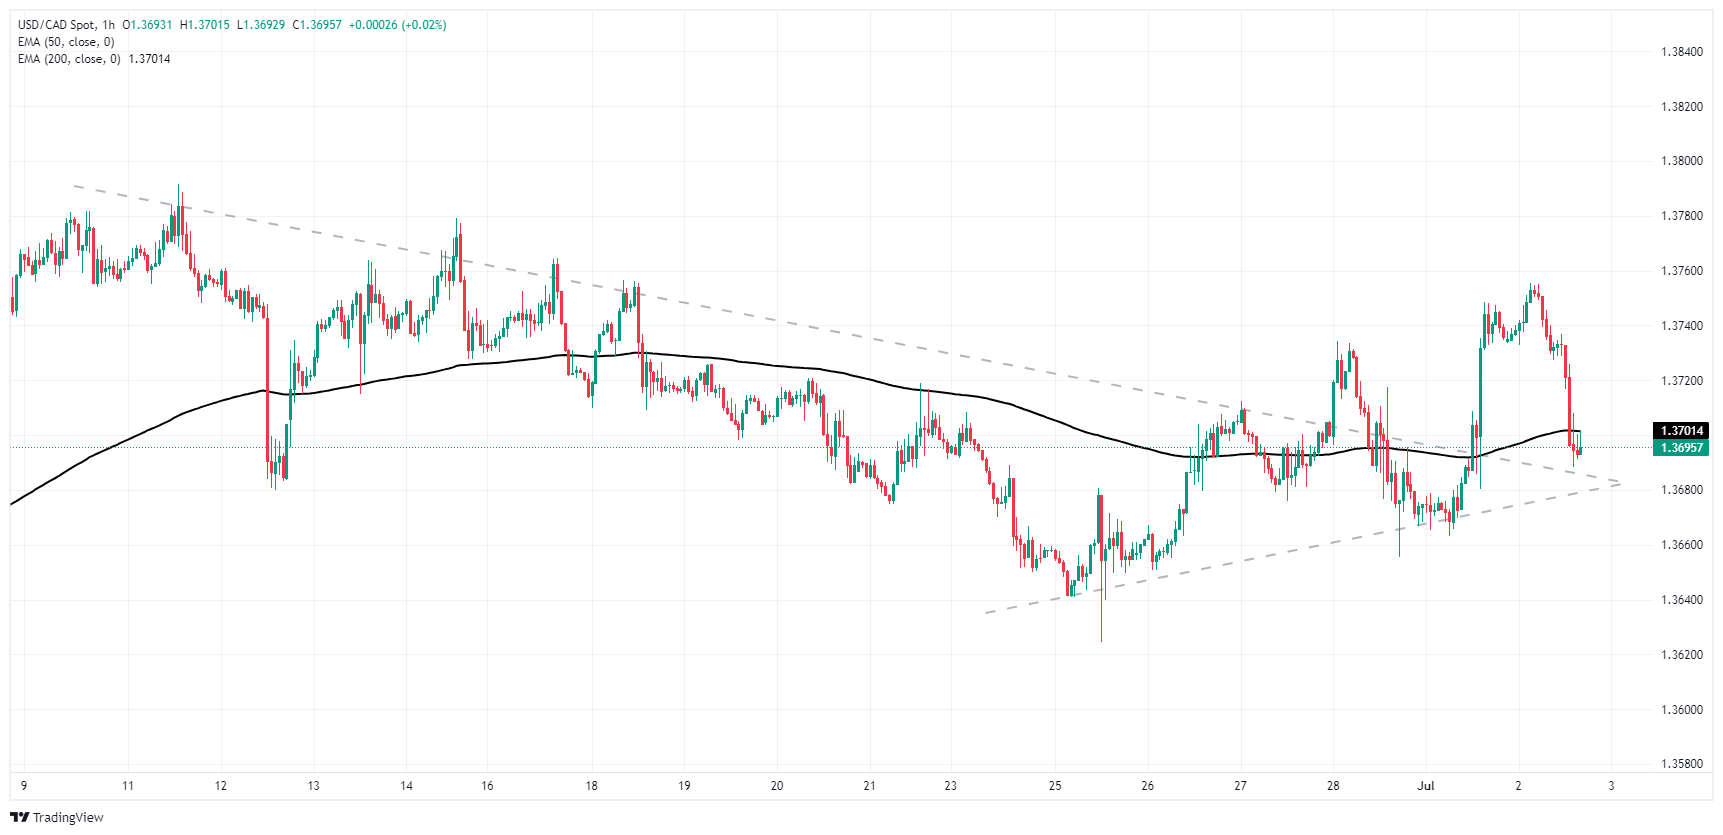
USD/CAD daily chart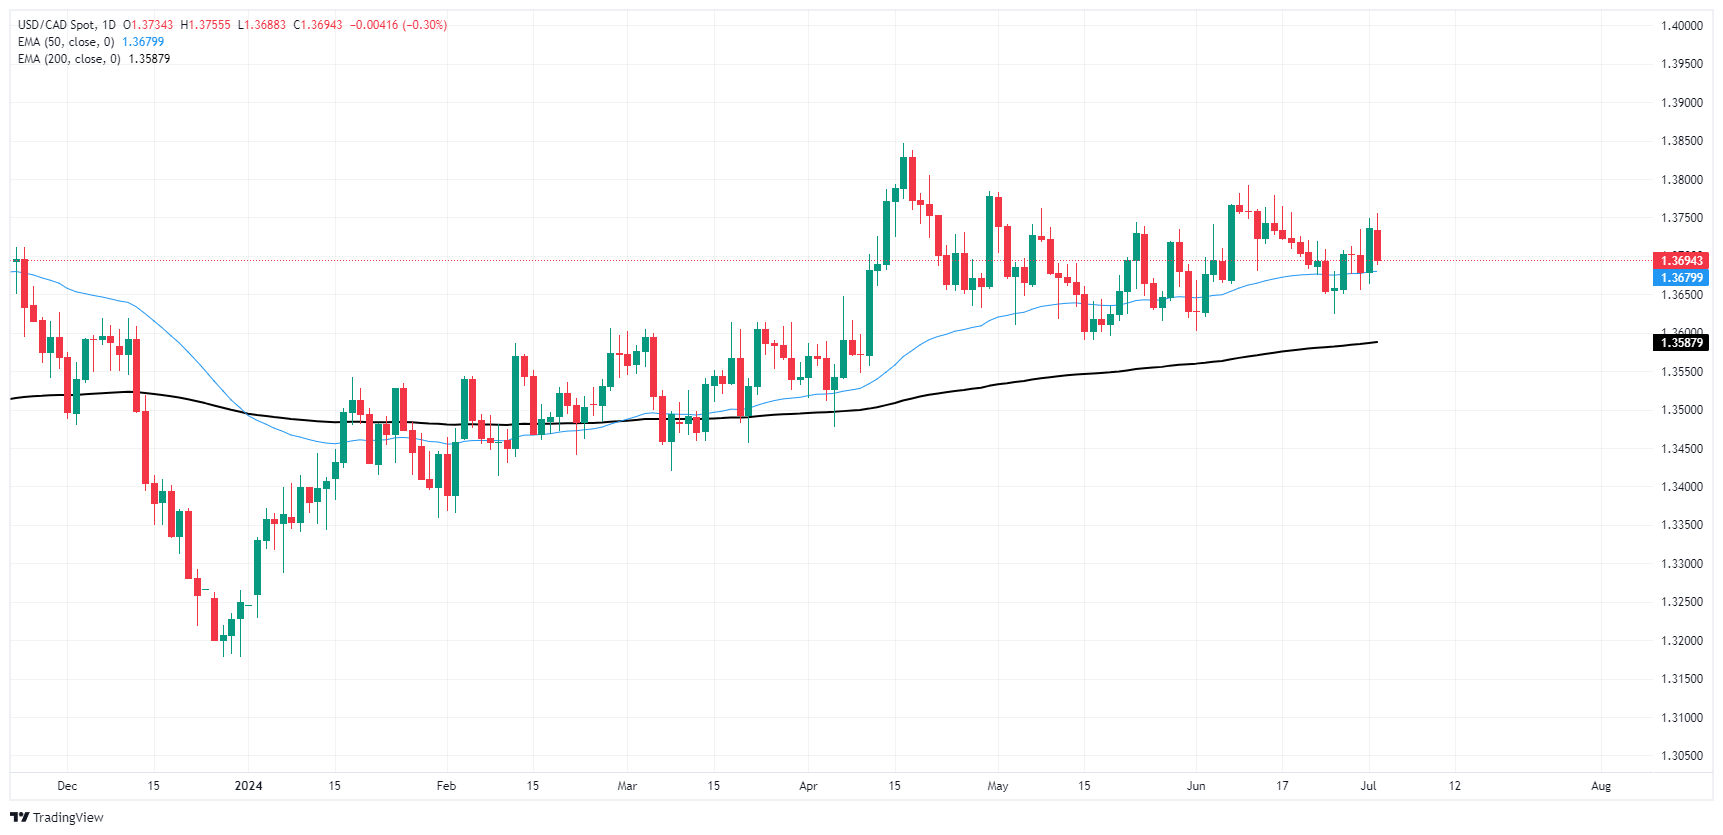
Canadian Dollar FAQs
The key factors driving the Canadian Dollar (CAD) are the level of interest rates set by the Bank of Canada (BoC), the price of Oil, Canada’s largest export, the health of its economy, inflation and the Trade Balance, which is the difference between the value of Canada’s exports versus its imports. Other factors include market sentiment – whether investors are taking on more risky assets (risk-on) or seeking safe-havens (risk-off) – with risk-on being CAD-positive. As its largest trading partner, the health of the US economy is also a key factor influencing the Canadian Dollar.
The Bank of Canada (BoC) has a significant influence on the Canadian Dollar by setting the level of interest rates that banks can lend to one another. This influences the level of interest rates for everyone. The main goal of the BoC is to maintain inflation at 1-3% by adjusting interest rates up or down. Relatively higher interest rates tend to be positive for the CAD. The Bank of Canada can also use quantitative easing and tightening to influence credit conditions, with the former CAD-negative and the latter CAD-positive.
The price of Oil is a key factor impacting the value of the Canadian Dollar. Petroleum is Canada’s biggest export, so Oil price tends to have an immediate impact on the CAD value. Generally, if Oil price rises CAD also goes up, as aggregate demand for the currency increases. The opposite is the case if the price of Oil falls. Higher Oil prices also tend to result in a greater likelihood of a positive Trade Balance, which is also supportive of the CAD.
While inflation had always traditionally been thought of as a negative factor for a currency since it lowers the value of money, the opposite has actually been the case in modern times with the relaxation of cross-border capital controls. Higher inflation tends to lead central banks to put up interest rates which attracts more capital inflows from global investors seeking a lucrative place to keep their money. This increases demand for the local currency, which in Canada’s case is the Canadian Dollar.
Macroeconomic data releases gauge the health of the economy and can have an impact on the Canadian Dollar. Indicators such as GDP, Manufacturing and Services PMIs, employment, and consumer sentiment surveys can all influence the direction of the CAD. A strong economy is good for the Canadian Dollar. Not only does it attract more foreign investment but it may encourage the Bank of Canada to put up interest rates, leading to a stronger currency. If economic data is weak, however, the CAD is likely to fall.
Top traders on the Shanghai Futures Exchange (SHFE) have added back to their net Gold (XAU/USD) and Silver (XAG/USD) positions, Senior Commodity Strategist at TDS Ryan McKay notes.
Asian demand remains strong
“Asian demand is set to remain strong, while nascent sings are appearing that macro interest may be starting to pick up as ETF positions are on course to post their first monthly increase since May 2023.”
“The PCE data came in roughly in line with expectations, and the y/y pace for core PCE represents the lowest level of the cycle. Overall, inflation data continues to gradually normalize back to the trend the Federal Reserve (Fed) would like to see, but it is still not enough evidence for officials to pound the table on policy easing.”
“In this sense, precious metals investors are likely to remain on the sidelines for the time being, with this week's job data serving as the next piece of Fed the puzzle.”
- US Dollar sees minor losses amid Jerome Powell's disinflation forecasts.
- JOLTs figure from June came in higher than expected.
- Expectations of interest rate cut in September remain steady ahead of key NFPs on Friday.
On Tuesday, the US Dollar, as per the DXY Index, showed a decrease in gains to hover near 105.70. The Greenback is influenced by rising JOLTS figures and Jerome Powell's comments about the inflation outlook.
Although the US is starting to exhibit signs of disinflation, and the markets anticipate a potential September rate cut, Federal Reserve (Fed) officials remain careful by adhering to their data-oriented approach. Jerome Powell showed some confidence on the inflation outlook but didn’t give clear signs that cuts would arrive sooner.
Daily digest market movers: US Dollar trims gains despite robust JOLTS data
- Job Openings and Labor Turnover Survey (JOLTS) released by the US Bureau of Labor Statistics (BLS) on Tuesday showed that job openings on the last business day of May totaled 8.14 million.
- This was a significant increase from April's 7.9 million (revised from 8.05 million), surpassing the market's forecast of 7.9 million.
- Key takeaways from Powell's remarks include his mentioning that wage increases are moving back down toward more sustainable levels, suggesting that the labor market is cooling off.
- In addition, he added that “Inflation may get back to 2% late next year or the following year," hinting at a slower-than-expected inflation rate.
- The week ends with a spotlight on June's Nonfarm Payrolls on Friday. Bloomberg's consensus reveals an expectation of 190K versus May's 272K, while the whisper number currently stands at 198K. Wage inflation and the Unemployment Rate will also be closely looked upon.
DXY technical outlook: Bullish momentum struggles though outlook still positive
Despite a muted contraction, the Relative Strength Index (RSI) and Moving Average Convergence Divergence (MACD) portray a robust landscape. The RSI remains above 50 with a slight flattening, while the MACD continues to display green bars, hinting at increased bullish momentum.
Resiliently above its 20, 100 and 200-day Simple Moving Averages (SMAs), the DXY remains steady at the highs observed since May, with both the 106.50 and 106.00 zones viewed as targets. Investors should also consider potential pullbacks toward the 105.50 and 105.00 zones in case bears step in.
Fed FAQs
Monetary policy in the US is shaped by the Federal Reserve (Fed). The Fed has two mandates: to achieve price stability and foster full employment. Its primary tool to achieve these goals is by adjusting interest rates. When prices are rising too quickly and inflation is above the Fed’s 2% target, it raises interest rates, increasing borrowing costs throughout the economy. This results in a stronger US Dollar (USD) as it makes the US a more attractive place for international investors to park their money. When inflation falls below 2% or the Unemployment Rate is too high, the Fed may lower interest rates to encourage borrowing, which weighs on the Greenback.
The Federal Reserve (Fed) holds eight policy meetings a year, where the Federal Open Market Committee (FOMC) assesses economic conditions and makes monetary policy decisions. The FOMC is attended by twelve Fed officials – the seven members of the Board of Governors, the president of the Federal Reserve Bank of New York, and four of the remaining eleven regional Reserve Bank presidents, who serve one-year terms on a rotating basis.
In extreme situations, the Federal Reserve may resort to a policy named Quantitative Easing (QE). QE is the process by which the Fed substantially increases the flow of credit in a stuck financial system. It is a non-standard policy measure used during crises or when inflation is extremely low. It was the Fed’s weapon of choice during the Great Financial Crisis in 2008. It involves the Fed printing more Dollars and using them to buy high grade bonds from financial institutions. QE usually weakens the US Dollar.
Quantitative tightening (QT) is the reverse process of QE, whereby the Federal Reserve stops buying bonds from financial institutions and does not reinvest the principal from the bonds it holds maturing, to purchase new bonds. It is usually positive for the value of the US Dollar.
Red Metal is under selling pressure influenced by price action in the base metal complex, TDS Senior Commodity Strategist Ryan McKay notes.
China hoards Copper inventories
“Price action in the base metal complex continues to stave off Commodity Trading Advisor (CTA) selling pressure in Copper, however the higher selling trigger, now at $9,422/t, is becoming more of an entrenched risk for the Red Metal.”
“With our gauge of global commodity demand continuing to weaken, while depressed premiums and surging inventories in the Middle Kingdom argue against fundamental tightness, top traders in Shanghai Futures Exchange (SHFE) have taken on a net short position.”
“While the fundamental situation certainly looks promising in the years to come, the lack of evidence supporting current physical tightness can continue to see these money manager positions unwind.”
Oil market upside is being driven by Commodity Trading Advisors (CTA) flows yet again, TD Securities Senior Commodity Strategist Ryan McKay notes.
Crude oil is back on the rise
“Systematic flows have reignited in WTI crude, with funds looking to add a whopping +17% of their historic max length, and they could add more if the rally extends beyond $85.45/bbl.”
“Brent crude is also seeing a large scale +12% of max length added, although CTAs are now firing long on all cylinders and could see modest reductions to their length below $87.03/bbl.”
“CTAs have covered their recently acquired RBOB gasoline shorts, with funds now sitting flat heading into driving season. However, downside triggers are closer to market amid weaker demand statistics and large inventory builds that have thus far bucked the typical seasonal pattern.”
Austan Goolsbee, President of the Federal Reserve (Fed) Bank of Chicago noted on Monday that progress on the final chunk of inflation heading towards the Fed's 2% inflation target will happen faster than many expect.
Key highlights
I don't buy that the last mile on inflation could take longer.
Market-based rents are down, but not yet reflected in the data.
I still think a soft landing is possible.
I see some warning signs from the real economy weakening.
As inflation comes down, policy gets more tight.
I think we are restrictive.
I think we should tighten by choice, not default.
Only want to stay this restrictive for as long as you have to.
If we were using the measures on housing inflation that they use in Europe, we would be at 2% already.
- GBP/USD maintains earlier gains, as Powell was mute about comments on the forward rate path.
- Momentum favors sellers; RSI near 50 hints at decreasing bearish pressure.
- Support levels: 1.2612 (June 27 low), 1.2600, 1.2563 (200-DMA).
- Resistance points: 1.2709 (July 1 high), 1.2739 (June 19 high), 1.2800.
The Pound Sterling held to earlier gains against the US Dollar on Tuesday at the time the Federal Reserve Chair Jerome Powell crossed the wires at the European Central Bank (ECB) forum in Portugal and said that inflation may get back to the Fed’s 2% target late next year or the following. The GBP/USD trades at 1.2667, above its opening price by 0.14%.
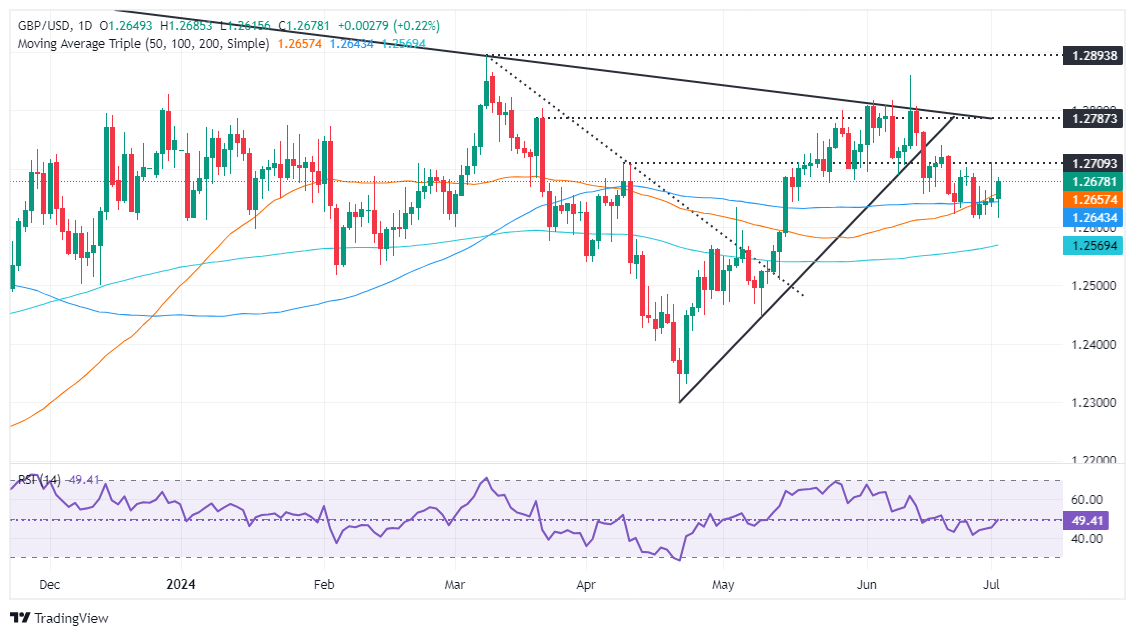
GBP/USD Price Analysis: Technical outlook
The GBP/USD appears to have bottomed out at around 1.2640, with sellers unable to push the exchange rate below the latter, which could exacerbate a test of lower prices, with the 200-day moving average (DMA) being the next target at 1.2563.
Momentum suggests that sellers control the price action in the near term, as depicted by the Relative Strength Index (RSI) standing bearish, yet they seem to be losing steam as the RSI approaches its 50-neutral line.
If the Pound weakens, the pair might fall below the June 27 cycle low of 1.2612, exposing 1.2600. That would increase the chances of testing the 200-DMA located in the midpoint of the 1.25-1.26 range, which would attract further attention. If cleared, the 1.2500 figure would follow.
Contrarily, if GBP/USD buyers lift the spot price above July’s 1 high of 1.2709, look for further gains past the latter. The next supply zone would be the June 19 high at 1.2739, followed by the 1.2800 mark.
GBP/USD Price Action – Daily Chart
Pound Sterling FAQs
The Pound Sterling (GBP) is the oldest currency in the world (886 AD) and the official currency of the United Kingdom. It is the fourth most traded unit for foreign exchange (FX) in the world, accounting for 12% of all transactions, averaging $630 billion a day, according to 2022 data. Its key trading pairs are GBP/USD, aka ‘Cable’, which accounts for 11% of FX, GBP/JPY, or the ‘Dragon’ as it is known by traders (3%), and EUR/GBP (2%). The Pound Sterling is issued by the Bank of England (BoE).
The single most important factor influencing the value of the Pound Sterling is monetary policy decided by the Bank of England. The BoE bases its decisions on whether it has achieved its primary goal of “price stability” – a steady inflation rate of around 2%. Its primary tool for achieving this is the adjustment of interest rates. When inflation is too high, the BoE will try to rein it in by raising interest rates, making it more expensive for people and businesses to access credit. This is generally positive for GBP, as higher interest rates make the UK a more attractive place for global investors to park their money. When inflation falls too low it is a sign economic growth is slowing. In this scenario, the BoE will consider lowering interest rates to cheapen credit so businesses will borrow more to invest in growth-generating projects.
Data releases gauge the health of the economy and can impact the value of the Pound Sterling. Indicators such as GDP, Manufacturing and Services PMIs, and employment can all influence the direction of the GBP. A strong economy is good for Sterling. Not only does it attract more foreign investment but it may encourage the BoE to put up interest rates, which will directly strengthen GBP. Otherwise, if economic data is weak, the Pound Sterling is likely to fall.
Another significant data release for the Pound Sterling is the Trade Balance. This indicator measures the difference between what a country earns from its exports and what it spends on imports over a given period. If a country produces highly sought-after exports, its currency will benefit purely from the extra demand created from foreign buyers seeking to purchase these goods. Therefore, a positive net Trade Balance strengthens a currency and vice versa for a negative balance.
The Reserve Bank of Australia (RBA) published the minutes of its 18 June policy meeting last night that confirmed that board ultimately saw the case for a hold, ING’s FX strategist Francesco Pesole notes.
Rate hike isn’t ruled out
“RBA published the minutes of its 18 June policy meeting last night. It was confirmed that board discussed raising rates but ultimately saw the case for a hold as the “stronger one”, although it is not ruling anything in or out in terms of future policy moves.”
“Remember that the meeting was followed by a major inflation surprise in the May read, which rose from 3.6% to 4.0% year-on-year. There is a non-negligible risk the RBA will raise rates again (around 50% priced in by November), and the second quarter CPI report on 31 July will be a make-or-break event. Another inflation surprise and a rate hike will be a very tangible possibility.”
"That possibility is keeping us confident that the Australian Dollar (AUD) will have a strong summer. As we see US macro data endorsing rising dovish bets in the US, we think high-beta currencies can do well and markets will reward especially those that can count on hawkish domestic central banks. A move to 0.68 in AUD/USD remains our base case."
- USD/CAD corrects sharply as Fed Powell admits progress in the disinflation process.
- Fed Powell sees risks to price pressures as more balanced.
- This week, investors will pay close attention to the labor market data for June from the US and Canada.
The USD/CAD pair extends its correction to near the round-level support of 1.3700 in Tuesday’s New York session. The Loonie asset declines as the US Dollar retreats after Federal Reserve (Fed) Chair Jerome Powell’s commentary at the European Central Bank (ECB) Forum on the Central Banking in Sintra, Portugal.
Fed Powell said that the central bank has made quiet a bit progress in inflation and latest data suggests that the disinflation process has resumed. However, he reiterated that more good inflation data is needed before cutting interest rates. Powell added that risks to inflation are more balanced. He also said that an unexpected weakness in the labor market could force them to react on interest rates.
The US Dollar Index (DXY), which tracks the Greenback’s value against six major currencies, falls back to 105.80.
Going forward, the major trigger for the US Dollar will be the United States (US) Nonfarm Payrolls (NFP) data for June, which will be published on Friday.
Meanwhile, the Canadian Dollar remains under pressure even though higher-than-expected May inflation data have diminished expectations that the Bank of Canada (BoC) will deliver rate cuts sequentially.
This week, the Canadian Dollar will dance to the tunes of the Employment data for June, which will be published on Friday. Economists expect that the Unemployment Rate increased to 6.3% from the prior release of 6.2%. Canadian employers hired 22.5K workers, which was lower than the former reading of 26.7 K.
Economic Indicator
Net Change in Employment
The Net Change in Employment released by Statistics Canada is a measure of the change in the number of people in employment in Canada. Generally speaking, a rise in this indicator has positive implications for consumer spending and indicates economic growth. Therefore, a high reading is seen as bullish for the Canadian Dollar (CAD), while a low reading is seen as bearish.
Read more.Next release: Fri Jul 05, 2024 12:30
Frequency: Monthly
Consensus: 22.5K
Previous: 26.7K
Source: Statistics Canada
Canada’s labor market statistics tend to have a significant impact on the Canadian dollar, with the Employment Change figure carrying most of the weight. There is a significant correlation between the amount of people working and consumption, which impacts inflation and the Bank of Canada’s rate decisions, in turn moving the C$. Actual figures beating consensus tend to be CAD bullish, with currency markets usually reacting steadily and consistently in response to the publication.
The relief rally in the Euro (EUR) following French election results being in line with expectations ran out of steam on Monday, and there are doubts there will be significant extra support for the common currency given the open questions ahead of the second round on Sunday 7 July, ING’s FX strategist Francesco Pesole notes.
EUR/USD to jump to 1.0800 in the short run
“Interestingly, the support for other European currencies was not homogenous, with markets picking the higher-yielding NOK and GBP over the lower yielding SEK and CHF. A strengthening in NOK/SEK on the back of policy divergence is one of our core calls for this summer.”
“Another reason that EUR does not look likely to get much idiosyncratic support is that regional CPI estimates have so far come in in line with expectations, and pointed at declining inflation in the eurozone in June. Consensus for today’s eurozone-wide prints are 2.5% for headline and 2.8% for core.”
“We think USD is looking at some downside risks, but EUR appears in a worse position compared to high-beta currencies like NOK, AUD and NZD. A USD-driven move to 1.0800 is possible in EUR/USD in the next couple of days, but the upside should remain capped by French political risk this week, in our view.”
With the exception of some strengthening in the euro and the Norwegian krone thanks to a post French-vote relief, the dollar has had a good start to the week. For the second time in five days, the US Dollar (USD) is appreciating on the back of higher perceived chances of Donald Trump winning the US presidency, ING FX strategist Francesco Pesole Notes.
USD may benefit if Trump wins
“It is now clear that investors have made the Trump-stronger dollar link. This has also been our interpretation given the prospect of lower taxes, inflationary protectionism measures and greater geopolitical risks under Trump. Given the market’s growing scepticism of Biden’s chances against Trump, there is a possibility that him stepping down would be a dollar-negative development.”
“On the macro side, the June ISM manufacturing index for the US slightly softened to 48.5 yesterday, indicating continued contraction. Key components remained below the 50 threshold and inflation pressures eased, with the prices paid component dropping to 52.1. Construction spending fell unexpectedly, emphasising the reliance on consumer activity for economic growth.”
“Today, JOLTS job openings for May have decent market-moving potential. Remember how a surprise drop to 8059k a month ago drove the dollar moderately lower. Expectations are for another decline to 7950k today. The other big event is Federal Reserve Chair Jerome Powell participating in a Sintra panel with ECB President Christine Lagarde.”
Federal Reserve (Fed) Chairman Jerome Powell and European Central Bank (ECB) President Christine Lagarde discuss monetary policy outlook at the ECB Forum on Central Banking in Sintra.
Key quotes from Powell
"Very broad support for an independent Fed in the United States."
"Both political parties on Capitol Hill support an independent Fed."
"The budget deficit is very large, the deficit path is unsustainable."
"Sooner or later this needs to be tackled and it's better sooner."
Central banks FAQs
Central Banks have a key mandate which is making sure that there is price stability in a country or region. Economies are constantly facing inflation or deflation when prices for certain goods and services are fluctuating. Constant rising prices for the same goods means inflation, constant lowered prices for the same goods means deflation. It is the task of the central bank to keep the demand in line by tweaking its policy rate. For the biggest central banks like the US Federal Reserve (Fed), the European Central Bank (ECB) or the Bank of England (BoE), the mandate is to keep inflation close to 2%.
A central bank has one important tool at its disposal to get inflation higher or lower, and that is by tweaking its benchmark policy rate, commonly known as interest rate. On pre-communicated moments, the central bank will issue a statement with its policy rate and provide additional reasoning on why it is either remaining or changing (cutting or hiking) it. Local banks will adjust their savings and lending rates accordingly, which in turn will make it either harder or easier for people to earn on their savings or for companies to take out loans and make investments in their businesses. When the central bank hikes interest rates substantially, this is called monetary tightening. When it is cutting its benchmark rate, it is called monetary easing.
A central bank is often politically independent. Members of the central bank policy board are passing through a series of panels and hearings before being appointed to a policy board seat. Each member in that board often has a certain conviction on how the central bank should control inflation and the subsequent monetary policy. Members that want a very loose monetary policy, with low rates and cheap lending, to boost the economy substantially while being content to see inflation slightly above 2%, are called ‘doves’. Members that rather want to see higher rates to reward savings and want to keep a lit on inflation at all time are called ‘hawks’ and will not rest until inflation is at or just below 2%.
Normally, there is a chairman or president who leads each meeting, needs to create a consensus between the hawks or doves and has his or her final say when it would come down to a vote split to avoid a 50-50 tie on whether the current policy should be adjusted. The chairman will deliver speeches which often can be followed live, where the current monetary stance and outlook is being communicated. A central bank will try to push forward its monetary policy without triggering violent swings in rates, equities, or its currency. All members of the central bank will channel their stance toward the markets in advance of a policy meeting event. A few days before a policy meeting takes place until the new policy has been communicated, members are forbidden to talk publicly. This is called the blackout period.
- US JOLT Job Openings rose above 8 million in May.
- The US Dollar Index stays below 106.00 after the data.
The number of job openings on the last business day of May stood at 8.14 million, the US Bureau of Labor Statistics (BLS) reported in the Job Openings and Labor Turnover Survey (JOLTS) on Tuesday. This reading followed the 7.9 million (revised from 8.05 million) openings reported in April and came in above the market expectation of 7.9 million.
"Over the month, both the number of hires and total separations were little changed at 5.8 million and 5.4 million, respectively," the BLS noted in its publication. "Within separations, quits (3.5 million) and layoffs and discharges (1.7 million) changed little."
Market reaction
The US Dollar Index edged slightly higher from session lows after this report and was last seen at 105.80, where it was virtually unchanged on the day.
US Dollar FAQs
The US Dollar (USD) is the official currency of the United States of America, and the ‘de facto’ currency of a significant number of other countries where it is found in circulation alongside local notes. It is the most heavily traded currency in the world, accounting for over 88% of all global foreign exchange turnover, or an average of $6.6 trillion in transactions per day, according to data from 2022. Following the second world war, the USD took over from the British Pound as the world’s reserve currency. For most of its history, the US Dollar was backed by Gold, until the Bretton Woods Agreement in 1971 when the Gold Standard went away.
The most important single factor impacting on the value of the US Dollar is monetary policy, which is shaped by the Federal Reserve (Fed). The Fed has two mandates: to achieve price stability (control inflation) and foster full employment. Its primary tool to achieve these two goals is by adjusting interest rates. When prices are rising too quickly and inflation is above the Fed’s 2% target, the Fed will raise rates, which helps the USD value. When inflation falls below 2% or the Unemployment Rate is too high, the Fed may lower interest rates, which weighs on the Greenback.
In extreme situations, the Federal Reserve can also print more Dollars and enact quantitative easing (QE). QE is the process by which the Fed substantially increases the flow of credit in a stuck financial system. It is a non-standard policy measure used when credit has dried up because banks will not lend to each other (out of the fear of counterparty default). It is a last resort when simply lowering interest rates is unlikely to achieve the necessary result. It was the Fed’s weapon of choice to combat the credit crunch that occurred during the Great Financial Crisis in 2008. It involves the Fed printing more Dollars and using them to buy US government bonds predominantly from financial institutions. QE usually leads to a weaker US Dollar.
Quantitative tightening (QT) is the reverse process whereby the Federal Reserve stops buying bonds from financial institutions and does not reinvest the principal from the bonds it holds maturing in new purchases. It is usually positive for the US Dollar.
USD/JPY extended its rise above 160 to 161.46 from another increase in US bond yields and a lack of haven appeal after the first round of French elections, senior FX strategist at DBS Philip Wee notes.
Japanese businesses expect USD/JPY at 144.59 in 12 months
“The better-than-expected Tankan Survey in June should keep hopes alive for a second interest rate hike and provide more details on the plan to reduce JGB purchases at the upcoming Bank of Japan meeting on July 30-31. Corporates expect inflation to hold above 2% over the longer term, i.e., 2.3% over the next three years and 2.2% five years ahead.”
“Despite the Japanese economy contracting by 0.7% QoQ sa in 1Q24, large corporates planned to increase capital expenditure by 11.1% in the current fiscal year ending March 2025. The outlook for the manufacturing sector increased to 14, its strongest since September 2021, while that for the non-manufacturing sector stayed firm at 27 for the third quarter.”
“Interestingly, Japanese businesses predicted that USD/JPY would decline to 144.59 for the fiscal year ending March 2025.”
Federal Reserve (Fed) Chairman Jerome Powell and European Central Bank (ECB) President Christine Lagarde discuss monetary policy outlook at the ECB Forum on Central Banking in Sintra.
Key quotes from Powell
"Services inflation is usually stickier."
"Wage increases are moving back down towards more sustainable levels."
"Wage increases are still above where they will wind up in equilibrium."
"The labor market is cooling off."
"Inflation may get back to 2% late next year or the following year."
Fed FAQs
Monetary policy in the US is shaped by the Federal Reserve (Fed). The Fed has two mandates: to achieve price stability and foster full employment. Its primary tool to achieve these goals is by adjusting interest rates. When prices are rising too quickly and inflation is above the Fed’s 2% target, it raises interest rates, increasing borrowing costs throughout the economy. This results in a stronger US Dollar (USD) as it makes the US a more attractive place for international investors to park their money. When inflation falls below 2% or the Unemployment Rate is too high, the Fed may lower interest rates to encourage borrowing, which weighs on the Greenback.
The Federal Reserve (Fed) holds eight policy meetings a year, where the Federal Open Market Committee (FOMC) assesses economic conditions and makes monetary policy decisions. The FOMC is attended by twelve Fed officials – the seven members of the Board of Governors, the president of the Federal Reserve Bank of New York, and four of the remaining eleven regional Reserve Bank presidents, who serve one-year terms on a rotating basis.
In extreme situations, the Federal Reserve may resort to a policy named Quantitative Easing (QE). QE is the process by which the Fed substantially increases the flow of credit in a stuck financial system. It is a non-standard policy measure used during crises or when inflation is extremely low. It was the Fed’s weapon of choice during the Great Financial Crisis in 2008. It involves the Fed printing more Dollars and using them to buy high grade bonds from financial institutions. QE usually weakens the US Dollar.
Quantitative tightening (QT) is the reverse process of QE, whereby the Federal Reserve stops buying bonds from financial institutions and does not reinvest the principal from the bonds it holds maturing, to purchase new bonds. It is usually positive for the value of the US Dollar.
Federal Reserve (Fed) Chairman Jerome Powell and European Central Bank (ECB) President Christine Lagarde discuss monetary policy outlook at the ECB Forum on Central Banking in Sintra.
Key quotes from Lagarde
"We are very advanced in the disinflationary path."
"Inflation is heading in the right direction."
"We are very attentive to inflation components and services."
"We don't need to have services inflation at 2%."
ECB FAQs
The European Central Bank (ECB) in Frankfurt, Germany, is the reserve bank for the Eurozone. The ECB sets interest rates and manages monetary policy for the region. The ECB primary mandate is to maintain price stability, which means keeping inflation at around 2%. Its primary tool for achieving this is by raising or lowering interest rates. Relatively high interest rates will usually result in a stronger Euro and vice versa. The ECB Governing Council makes monetary policy decisions at meetings held eight times a year. Decisions are made by heads of the Eurozone national banks and six permanent members, including the President of the ECB, Christine Lagarde.
In extreme situations, the European Central Bank can enact a policy tool called Quantitative Easing. QE is the process by which the ECB prints Euros and uses them to buy assets – usually government or corporate bonds – from banks and other financial institutions. QE usually results in a weaker Euro. QE is a last resort when simply lowering interest rates is unlikely to achieve the objective of price stability. The ECB used it during the Great Financial Crisis in 2009-11, in 2015 when inflation remained stubbornly low, as well as during the covid pandemic.
Quantitative tightening (QT) is the reverse of QE. It is undertaken after QE when an economic recovery is underway and inflation starts rising. Whilst in QE the European Central Bank (ECB) purchases government and corporate bonds from financial institutions to provide them with liquidity, in QT the ECB stops buying more bonds, and stops reinvesting the principal maturing on the bonds it already holds. It is usually positive (or bullish) for the Euro.
The Dollar Index (DXY) ended the first day of July at 105.82, slightly below Friday’s 105.87, senior FX strategist at DBS Philip Wee notes.
USD fears a weaker US monthly jobs report
“DXY’s most significant component, the Euro (EUR), initially spiked and met resistance at 1.0776 (50-DMA) on the far-right National Rally party failing to secure an outright majority at the first round of the French elections on Sunday. EUR/USD ended Monday at 1.0740, back inside the 1.0650-1.0750 range seen in the second half of June.”
“Similarly, DXY has been consolidating in a 105.3-106.2 range since June 21. While the EUR fears the second round of the French elections (on July 7) will produce a far-right government or a hung parliament, the USD is wary of a weaker US monthly jobs report (on July 5) opening the door increasing the market’s bet for the Fed to lower rates in September.”
“GBP/USD has been within 1.26-1.27 over the past week amid more clarity about the UK elections on July 4, producing a majority government led by the opposition Labour Party.”
Federal Reserve (Fed) Chairman Jerome Powell and European Central Bank (ECB) President Christine Lagarde discuss monetary policy outlook at the ECB Forum on Central Banking in Sintra.
Key quotes from Powell
"The labor market is still strong."
"The disinflation trend shows signs of resuming."
"Made quite a bit of progress on inflation."
"We are getting back on disinflationary path."
"We need to be more confident before reducing policy rates."
"We need to see more data like we've been seeing recently."
"Data represents significant progress."
"If the labor market unexpectedly weakens, that would also cause us to react."
"We have the ability to take our time and get this right."
"Well aware of risk of going too soon and too late."
"Risks becoming much more balanced."
Interest rates FAQs
Interest rates are charged by financial institutions on loans to borrowers and are paid as interest to savers and depositors. They are influenced by base lending rates, which are set by central banks in response to changes in the economy. Central banks normally have a mandate to ensure price stability, which in most cases means targeting a core inflation rate of around 2%. If inflation falls below target the central bank may cut base lending rates, with a view to stimulating lending and boosting the economy. If inflation rises substantially above 2% it normally results in the central bank raising base lending rates in an attempt to lower inflation.
Higher interest rates generally help strengthen a country’s currency as they make it a more attractive place for global investors to park their money.
Higher interest rates overall weigh on the price of Gold because they increase the opportunity cost of holding Gold instead of investing in an interest-bearing asset or placing cash in the bank. If interest rates are high that usually pushes up the price of the US Dollar (USD), and since Gold is priced in Dollars, this has the effect of lowering the price of Gold.
The Fed funds rate is the overnight rate at which US banks lend to each other. It is the oft-quoted headline rate set by the Federal Reserve at its FOMC meetings. It is set as a range, for example 4.75%-5.00%, though the upper limit (in that case 5.00%) is the quoted figure. Market expectations for future Fed funds rate are tracked by the CME FedWatch tool, which shapes how many financial markets behave in anticipation of future Federal Reserve monetary policy decisions.
- AUD/USD bounces back as the US Dollar gives await its entire intraday gains.
- The market mood remains uncertain ahead of Fed Powell’s speech.
- RBA officials considered further policy-tightening in June but ended keeping interest rates unchanged.
The AUD/USD pair rebounds sharply after correcting to near 0.6630 in Tuesday’s American session. The Aussie asset recovers as the US Dollar (USD) gives away its entire gains generated due to uncertainty ahead of the Federal Reserve (Fed) Chair Jerome Powell’s speech scheduled at 13:30 GMT.
Market sentiment remains risk-averse as Fed Powell will provide fresh cues about when the central bank will start reducing interest rates. S&P 500 futures have posted significant losses in the early New York session. The US Dollar Index (DXY), which tracks the Greenback’s value against six major currencies, retreats to near 105.80.
Investors will keenly focus on Fed Powell’s speech to know about when the Fed will start reducing interest rates. In June’s monetary policy, Fed Powell acknowledged decline in May’s inflation as “encouraging” but reiterated that they need more good data before pivoting to rate cuts.
This week, the major trigger for the US Dollar will be the United States (US) Nonfarm Payrolls (NFP) data for June, which will be published on Friday. The NFP report will indicate the current status of labor demand and the wage growth, which will provide fresh outlook on inflation.
Meanwhile, the Australian Dollar is broadly under pressure even though Reserve Bank of Australia (RBA) minutes for the June meeting were hawkish. Policymakers considered raising interest rates further due to stubbornly higher inflation but ended keeping the Official Cash Rate (OCR) unchanged at 4.35%. Currently investors expect that the RBA would choose the April 2025 as the earliest point to start lowering interest rates.
Economic Indicator
RBA Meeting Minutes
The minutes of the Reserve Bank of Australia meetings are published two weeks after the interest rate decision. The minutes give a full account of the policy discussion, including differences of view. They also record the votes of the individual members of the Committee. Generally speaking, if the RBA is hawkish about the inflationary outlook for the economy, then the markets see a higher possibility of a rate increase, and that is positive for the AUD.
Read more.Last release: Tue Jul 02, 2024 01:30
Frequency: Weekly
Actual: -
Consensus: -
Previous: -
Source: Reserve Bank of Australia
The Reserve Bank of Australia (RBA) publishes the minutes of its monetary policy meeting two weeks after the interest rate decision is announced. It provides a detailed record of the discussions held between the RBA’s board members on monetary policy and economic conditions that influenced their decision on adjusting interest rates and/or bond buys, significantly impacting the AUD. The minutes also reveal considerations on international economic developments and the exchange rate value.
- Natural Gas snaps below $2.50 and flirts with a six-week low.
- A Louisiana judge has lifted Biden’s ban on new licenses for LNG exports.
- The US Dollar index rallies higher and pops above 106.00 on concerns about a Trump win.
Natural Gas price (XNG/USD) sinks lower yet again, snapping below $2.50 and extending its losing streak for a sixth day in a row. Over 15% in value has already evaporated since June 25th, and more downturns could be at hand as a US judge in Louisiana issued a ruling on Monday to lift the current ban on new export licenses for Liquified Natural Gas (LNG). The Biden administration had issued a ban for new LNG export licenses a few months ago, in order to meet demands from climate changes and reforms.
Meanwhile, the US Dollar Index (DXY), which tracks the Greenback’s value against six major currencies, is having a field day and rallies higher on concerns in the bond markets. With former US President Donald Trump in the lead now in recent polls, his spending plan is a concern for the bond market. With ample amounts of spending, the US debt would become intolerable, while other measures, such as tariffs, are hardly enough to offset any big spending promises.
Natural Gas is trading at $2.46 per MMBtu at the time of writing.
Natural Gas news and market movers: More supply to hit markets
- US District Judge James D. Cain Jr. in Louisiana has decided in favor of 16 states that opposed US President Joe Biden’s current export moratorium on new LNG projects, Bloomberg reports.
- Bloomberg’s Energy Desk is forecasting that any supply glut in LNG will be absorbed by 2030 as several new projects currently are facing substantial delays, which means not being operative by the time already operational plants are set to near the end of their lifetime cycle.
- European Gas prices are facing less downturn, with several regions experiencing substantially elevated temperatures, and sparking demand for electricity in order to keep air conditioners performing, Reuters reports.
Natural Gas Technical Analysis: The pain trade
Natural Gas price has snapped the important 200-day Simple Moving Average (SMA) support near $2.53. With that break lower, Gas price is now trading below $2.50. With not much level to go on, the only next support near is still 8% lower, while the Relative Strength Index (RSI) is not yet nearing its oversold barrier.
The 200-day SMA turns now as a resistance, near $2.53. Once back above there, the pivotal level near $3.08 (March 6, 2023, high) remains key resistance after its false break last week, which is still 20% away. In addition, the red descending trendline in the chart below at $3.10 will also weigh on this area as a cap. Further up, the fresh year-to-date high at $3.16 is the level to beat.
On the downside, the next target could be the pivotal level near $2.13, with interim support by the 100-day SMA near $2.25
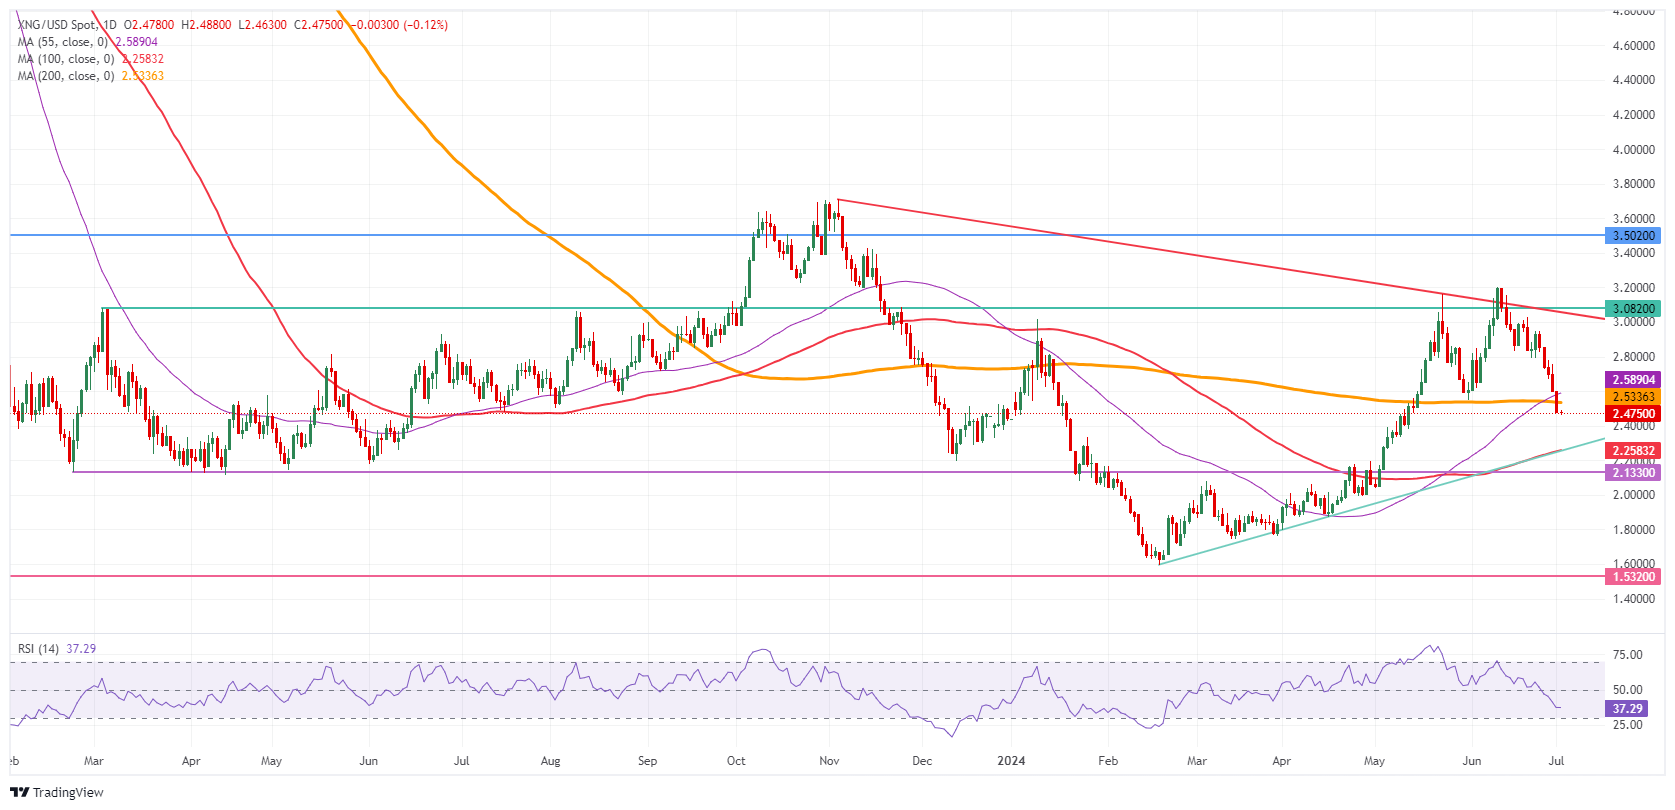
Natural Gas: Daily Chart
Natural Gas FAQs
Supply and demand dynamics are a key factor influencing Natural Gas prices, and are themselves influenced by global economic growth, industrial activity, population growth, production levels, and inventories. The weather impacts Natural Gas prices because more Gas is used during cold winters and hot summers for heating and cooling. Competition from other energy sources impacts prices as consumers may switch to cheaper sources. Geopolitical events are factors as exemplified by the war in Ukraine. Government policies relating to extraction, transportation, and environmental issues also impact prices.
The main economic release influencing Natural Gas prices is the weekly inventory bulletin from the Energy Information Administration (EIA), a US government agency that produces US gas market data. The EIA Gas bulletin usually comes out on Thursday at 14:30 GMT, a day after the EIA publishes its weekly Oil bulletin. Economic data from large consumers of Natural Gas can impact supply and demand, the largest of which include China, Germany and Japan. Natural Gas is primarily priced and traded in US Dollars, thus economic releases impacting the US Dollar are also factors.
The US Dollar is the world’s reserve currency and most commodities, including Natural Gas are priced and traded on international markets in US Dollars. As such, the value of the US Dollar is a factor in the price of Natural Gas, because if the Dollar strengthens it means less Dollars are required to buy the same volume of Gas (the price falls), and vice versa if USD strengthens.
When will the US Dollar's (USD) appeal fade? Not yet, as the US sucks up all the rest of the world’s savings, partly because the US is exceptional, and partly because it has marched to a different tune to the rest of us on its fiscal/monetary policy mix in recent years, FX strategist at Societe Generale Kit Juckes notes.
Treasury market to overshadow Sintra economic forum
“The US net international investment position is deteriorating dramatically after a brief respite. Rising US equity prices make the data and it takes two to tango, but the charts are striking. European Central Bank (ECB) showed 2023 data for the big surplus and deficit economies. Japan, Germany and China are the biggest net owners of foreign assets, but they’re midgets by comparison to Uncle Sam!”
“We saw concerns about the outlook for fiscal policy after the Presidential election come back to haunt the Treasury market. I’m not sure why anyone is more worried about this issue now than a few days ago, but any upward pressure on Treasury yields will simply strengthen the US Dollar further.”
“Today’s focus will be on Eurozone CPI and unemployment data, is JOLTS, and the ECB’s Sintra conference. The message from the ECB is that they are not going to rush rate cuts. Relative ECB/Fed expectations are shifting marginally in favour of the Euro (EUR), but the political backdrop, on both sides of the Atlantic, favours the dollar.”
- The Mexican Peso depreciates as traders price in an ever-increasing risk of Donald Trump winning the US presidential elections.
- Such a victory would likely lead to higher tariffs on foreign imports, negatively impacting Mexico.
- Banxico Governor Victoria Rodríguez Ceja raises the possibility of interest-rate cuts coming down the track
The Mexican Peso (MXN) continues creeping lower in its most traded pairs on Tuesday as concerns mount that former US President Donald Trump could win the US presidential election in November and raise tariffs on Mexican imports. Meanwhile, commentary from Bank of Mexico (Banxico) Governor Victoria Rodríguez Ceja suggests the bank is moving closer to cutting interest rates, another negative factor for MXN.
One US Dollar (USD) buys 18.43 Mexican Pesos at the time of writing, whilst EUR/MXN trades at 19.74, and GBP/MXN at 23.28.
Mexican Peso slides on neighbor danger and Banxico outlook
The Mexican Peso is sliding after the US Supreme Court judged Donald Trump has broad immunity from prosecution over his alleged attempts to undermine the 2020 election results that saw Democrat Joe Biden win by a narrow victory, as per Reuters.
The decision increases the chances Trump could go on and win the US presidential election in November. Such an outcome would probably have a negative impact on trade. Trump has said he will continue with an “America First” agenda, preferencing American-made goods and slapping tariffs on foreign imports. The move would be negative for the Peso given the close trade ties between the two nations.
Further, given the stark political differences between the two countries’ presidents, the likelihood of much goodwill generated between them is extremely low.
Ceja’s dovish twist
In an interview with El Financiero, Banxico Governor Victoria Rodríguez Ceja said, “The Mexican economy is in a solid position to face any external or internal challenges that may arise,” adding that volatility in Mexico’s financial markets after the June election had subsided.
Rodríguez Ceja added that the Peso’s depreciation following the election had influenced Banxico’s Governing Board not to cut interest rates (a weaker Peso drives up imported inflation) at their last meeting. But she added that progress was being made on disinflation and that “allows us to continue discussing downward adjustments in our rate, and I consider that this is what we will be doing in our next monetary policy meetings.”
If Banxico cuts interest rates at its next policy meeting it will probably have a negative impact on the Mexican Peso because lower interest rates attract less foreign capital inflows.
Technical Analysis: USD/MXN plods back up towards June 28 high
USD/MXN manages to continue higher after pulling back from its June 28 swing high at 18.59 – it is now not so far away, trading in the 18.40s.
USD/MXN 4-hour Chart
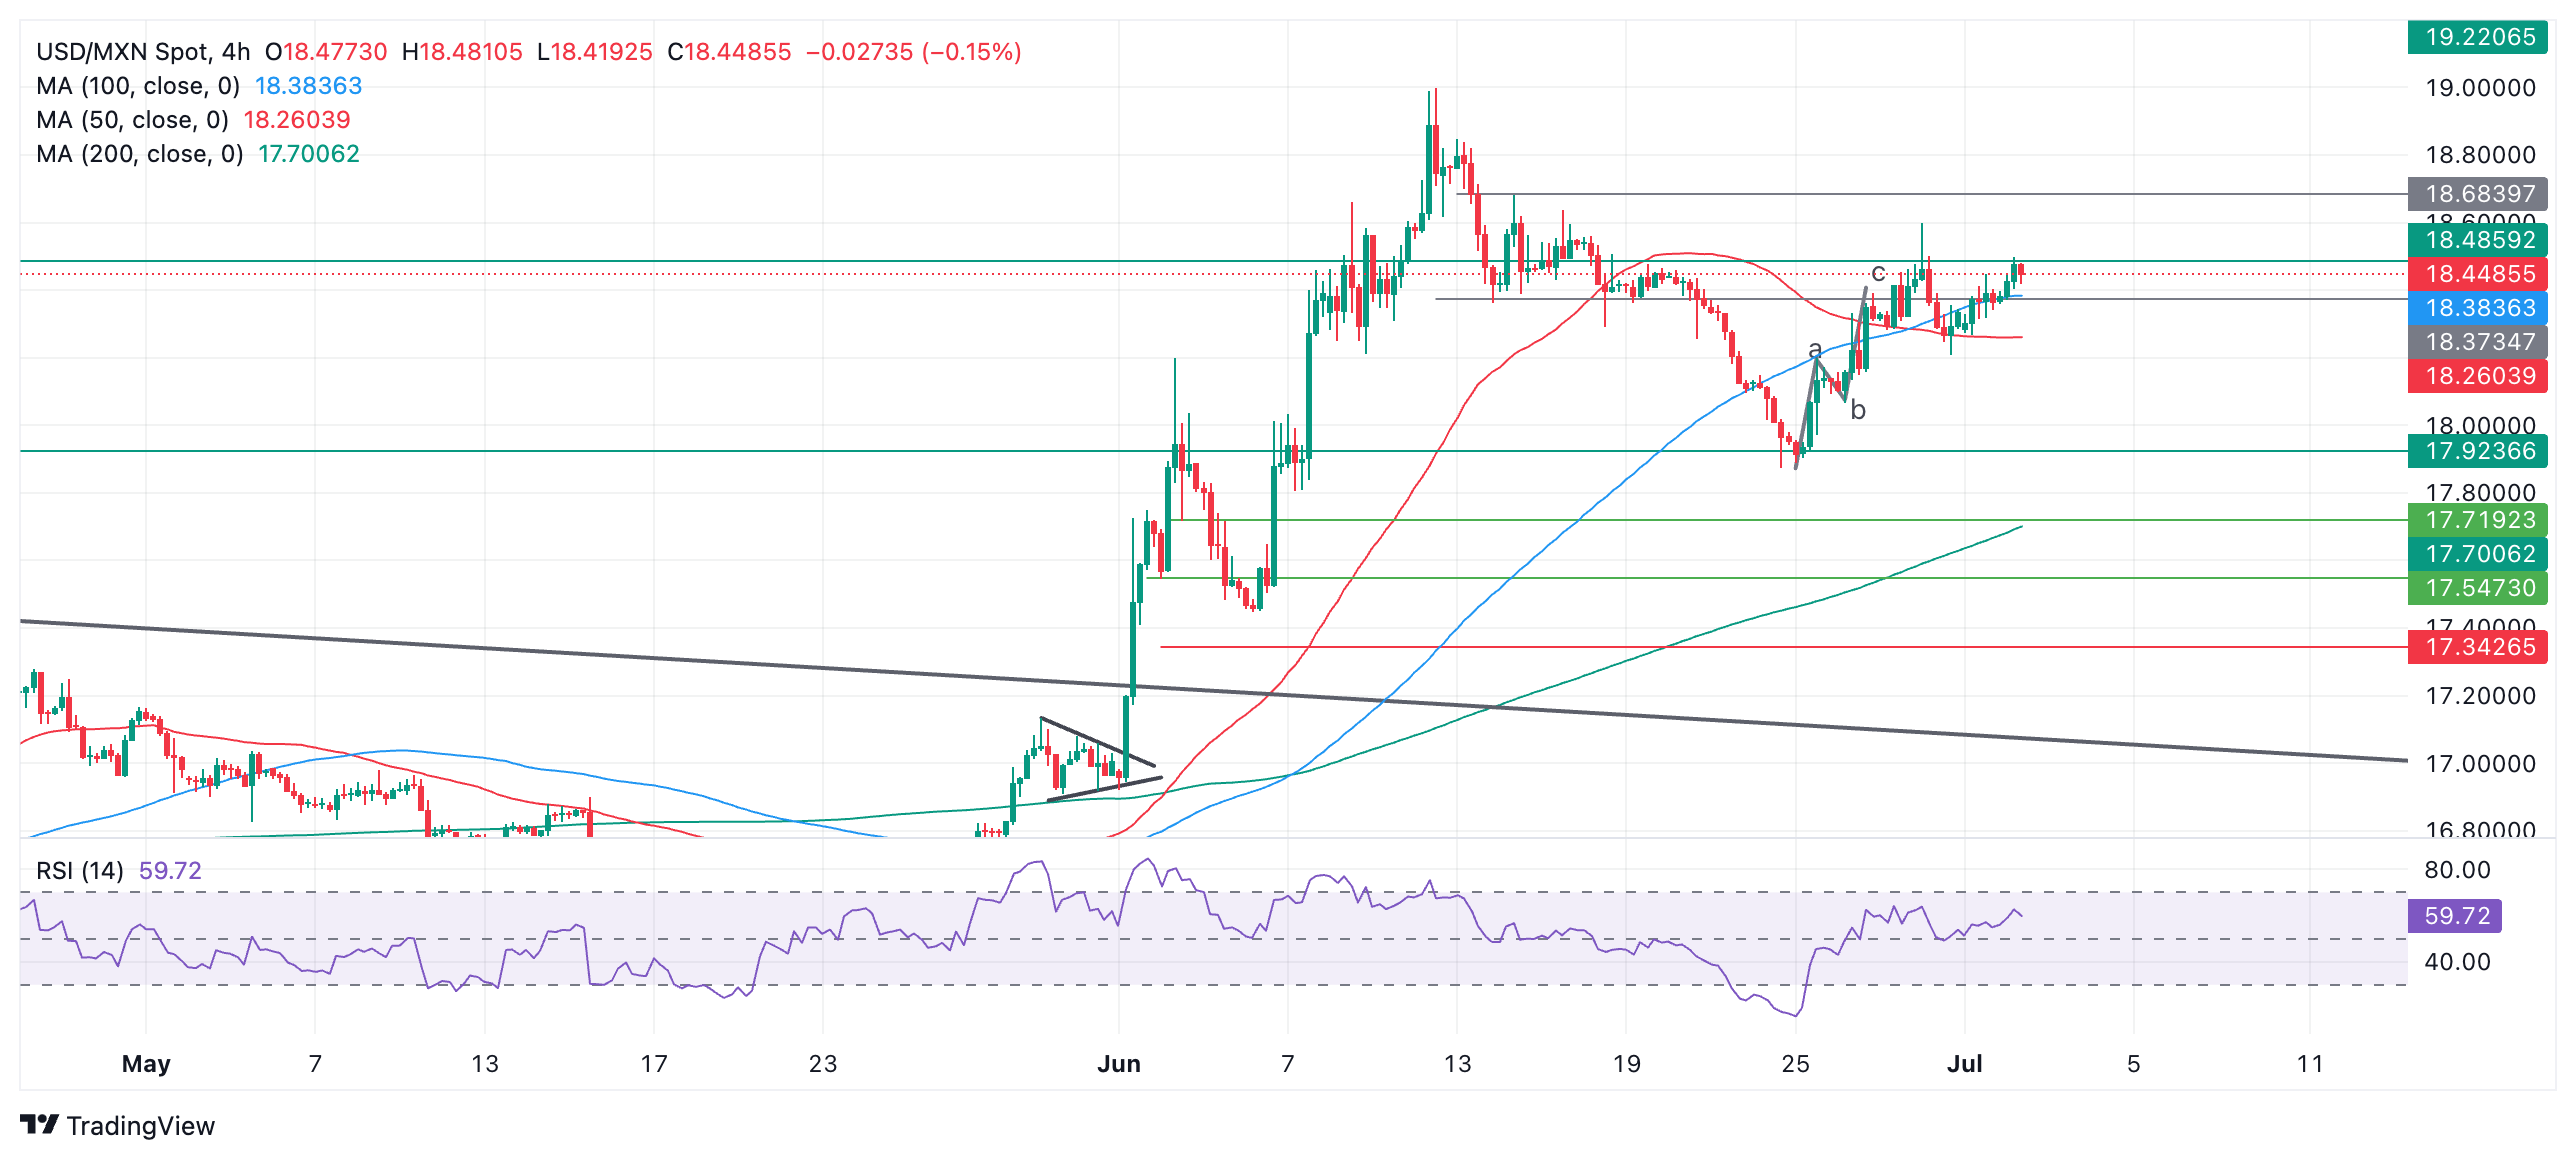
If USD/MXN rallies and breaks above 18.59 it will make a higher high and is likely to continue up to 18.68 (June 14 high), followed by 19.00 (June 12 high). A break above 19.00 would provide strong confirmation of a resumption of the short-and-intermediate term uptrends.
A move below 18.06 (June 26 low), however, would suggest the short-term downtrend was resuming and probably see a continuation down to 17.87 (June 24 low).
The direction of the long-term trend remains in doubt.
Mexican Peso FAQs
The Mexican Peso (MXN) is the most traded currency among its Latin American peers. Its value is broadly determined by the performance of the Mexican economy, the country’s central bank’s policy, the amount of foreign investment in the country and even the levels of remittances sent by Mexicans who live abroad, particularly in the United States. Geopolitical trends can also move MXN: for example, the process of nearshoring – or the decision by some firms to relocate manufacturing capacity and supply chains closer to their home countries – is also seen as a catalyst for the Mexican currency as the country is considered a key manufacturing hub in the American continent. Another catalyst for MXN is Oil prices as Mexico is a key exporter of the commodity.
The main objective of Mexico’s central bank, also known as Banxico, is to maintain inflation at low and stable levels (at or close to its target of 3%, the midpoint in a tolerance band of between 2% and 4%). To this end, the bank sets an appropriate level of interest rates. When inflation is too high, Banxico will attempt to tame it by raising interest rates, making it more expensive for households and businesses to borrow money, thus cooling demand and the overall economy. Higher interest rates are generally positive for the Mexican Peso (MXN) as they lead to higher yields, making the country a more attractive place for investors. On the contrary, lower interest rates tend to weaken MXN.
Macroeconomic data releases are key to assess the state of the economy and can have an impact on the Mexican Peso (MXN) valuation. A strong Mexican economy, based on high economic growth, low unemployment and high confidence is good for MXN. Not only does it attract more foreign investment but it may encourage the Bank of Mexico (Banxico) to increase interest rates, particularly if this strength comes together with elevated inflation. However, if economic data is weak, MXN is likely to depreciate.
As an emerging-market currency, the Mexican Peso (MXN) tends to strive during risk-on periods, or when investors perceive that broader market risks are low and thus are eager to engage with investments that carry a higher risk. Conversely, MXN tends to weaken at times of market turbulence or economic uncertainty as investors tend to sell higher-risk assets and flee to the more-stable safe havens.
- The US Dollar sets the record straight on Tuesday, extending Monday’s gains.
- The bond market is signalling issues ahead with Trump’s spending plans.
- The US Dollar index pops above 106.00 and flirts with another break higher.
The US Dollar (USD) gains strength on Tuesday, with the bond market fretting over former US President Donald Trump’s spending plans. The possibility of Trump being reelected as President gained a lot after the US Supreme Court ruling confirmed on Monday that Trump has partial immunity in the court cases on the riots that ended in a breach at the US Congress. With the recent spending plans revealed by the former President, the bond market is worried about where the money will come from while local market conditions could turn into higher inflation again.
On the US economic front, the calendar is relatively light in terms of data. However, from a speaker's point of view, the big guns are out. European Central Bank (ECB) President Christine Lagarde and the US Federal Reserve (Fed) Chairman Jerome Powell will take the stage at the Sintra ECB symposium.
Daily digest market movers: Sintra Portugal a place to be
- At 13:30 GMT, Fed Chairman Jerome Powell and ECB President Christine Lagarde will participate in a panel about monetary policy at the ECB Forum on Central Banking in Sintra, Portugal.
- The JOLTS Job Openings figure for May will be released at 14:00 GMT. A slide towards 7.9 million is expected from the previous count of 8.059 million.
- Equities are cracking a bit under pressure on the back of the reaction in the bond market after Trump’s legal victory. Both European and US equities are in the red ahead of the US session.
- The CME Fedwatch Tool is broadly backing a rate cut in September despite recent comments from Fed officials. The odds now stand at 59.9% for a 25-basis-point cut. A rate pause stands at a 34.7% chance, while a 50-basis-point rate cut has a slim 5.4% possibility.
- The US 10-year benchmark rate trades near 4.45% and prints a new high for the week.
US Dollar Index Technical Analysis: Greenback hits the panic button
The US Dollar Index (DXY) is gaining on the back of some risk-off sentiment that entered the markets late Monday. The change of heart came after the US Supreme Court ruling that fell partially in favor of former US President Donald Trump. With the DXY now gaining more momentum, the threat grows by the day the Japanese government might intervene to safeguard the Japanese Yen (JPY).
On the upside, the pivotal level of 105.89 is being regained, which is a must have for additional gains. Once a daily close has taken place above that level, marching above the red descending trend line in the chart below at 106.26 and the peak of April at 106.52 are the two main resistances ahead of a fresh nine-month high. That would be reached once 107.35 is being broken to the upside.
On the downside, 105.53 is the first support ahead of a trifecta of Simple Moving Averages (SMA). Next down is the 55-day SMA at 105.25, safeguarding the 105.00 round figure. A touch lower, near 104.75 and 104.46, both the 100-day and the 200-day SMA form a double layer of protection to support any declines together with the green ascending trendline from last December.
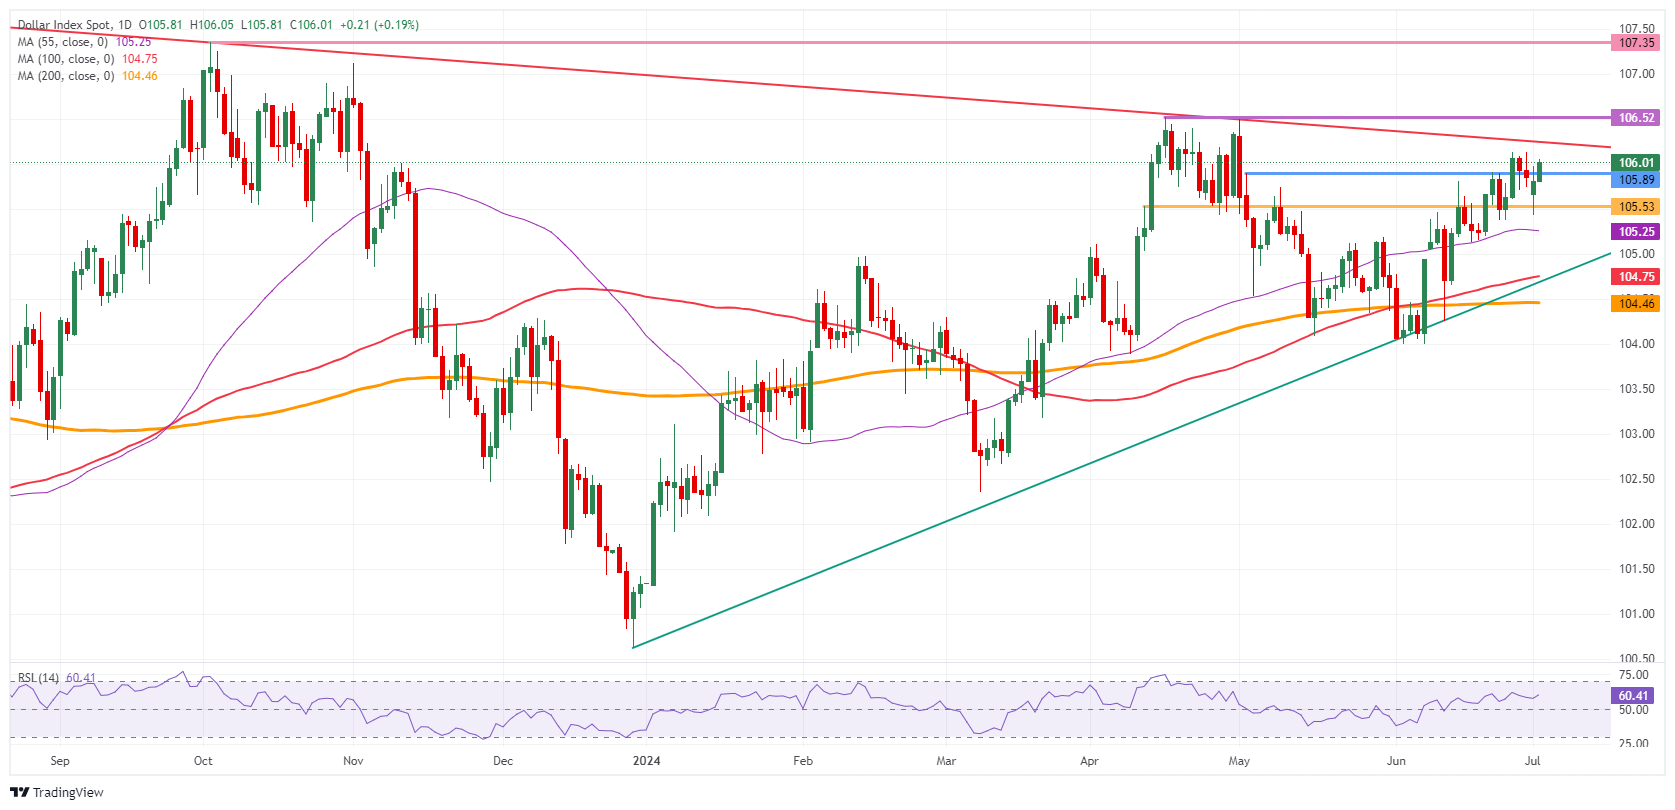
US Dollar Index: Daily Chart
US Dollar FAQs
The US Dollar (USD) is the official currency of the United States of America, and the ‘de facto’ currency of a significant number of other countries where it is found in circulation alongside local notes. It is the most heavily traded currency in the world, accounting for over 88% of all global foreign exchange turnover, or an average of $6.6 trillion in transactions per day, according to data from 2022. Following the second world war, the USD took over from the British Pound as the world’s reserve currency. For most of its history, the US Dollar was backed by Gold, until the Bretton Woods Agreement in 1971 when the Gold Standard went away.
The most important single factor impacting on the value of the US Dollar is monetary policy, which is shaped by the Federal Reserve (Fed). The Fed has two mandates: to achieve price stability (control inflation) and foster full employment. Its primary tool to achieve these two goals is by adjusting interest rates. When prices are rising too quickly and inflation is above the Fed’s 2% target, the Fed will raise rates, which helps the USD value. When inflation falls below 2% or the Unemployment Rate is too high, the Fed may lower interest rates, which weighs on the Greenback.
In extreme situations, the Federal Reserve can also print more Dollars and enact quantitative easing (QE). QE is the process by which the Fed substantially increases the flow of credit in a stuck financial system. It is a non-standard policy measure used when credit has dried up because banks will not lend to each other (out of the fear of counterparty default). It is a last resort when simply lowering interest rates is unlikely to achieve the necessary result. It was the Fed’s weapon of choice to combat the credit crunch that occurred during the Great Financial Crisis in 2008. It involves the Fed printing more Dollars and using them to buy US government bonds predominantly from financial institutions. QE usually leads to a weaker US Dollar.
Quantitative tightening (QT) is the reverse process whereby the Federal Reserve stops buying bonds from financial institutions and does not reinvest the principal from the bonds it holds maturing in new purchases. It is usually positive for the US Dollar.
NZD/USD edged lower under its 200-day moving average (0.6071), BBH analysts note.
35% of firms expect a deterioration in the economic outlook
“The NZ Institute of Economic Research (NZIER) Survey of Business Opinion (QSBO) declined in Q2 and points to a continued slowing in the New Zealand economy over the coming year.”
“A net 35% of firms expect a deterioration in the general economic outlook over the coming months on a seasonally adjusted basis vs. 25% in Q1. This reinforces the case for the RBNZ to start easing earlier than they project which can further weigh on NZD. The RBNZ has a first policy rate cut penciled-in for Q3 2025.”
“In contrast, the swaps market has a November cut more than fully priced in.”
The US Dollar (USD) is firmer across the board and the US yield curve (10 minus 2-year Treasury yields) steepened, BBH strategists note.
USD remains bullish in short term
“The narrative is financial markets are positioning for a Trump win ahead of the November 5 election. Donald Trump plans to slash taxes and raise import tariffs if elected. This combination is inflationary and could force the Federal Reserve (Fed) to keep policy restrictive for longer.”
“A loose fiscal/tight monetary policy mix is generally positive for a currency and supports higher bond yields. Additionally, expansionary fiscal policy if not accompanied by stronger growth could worsen the US fiscal backdrop and raise the term premium on longer term Treasury yields.”
“We remain cyclically bullish on USD, but in the near-term softer US economic activity is a USD headwind.”
- EUR/GBP drops from 0.8500 after the annual Eurozone headline HICP decelerated expectedly to 2.5%.
- ECB Muller sees further policy easing before year-end.
- The BoE is expected to start reducing interest rates in August.
The EUR/GBP pair falls back after failing to recapture the psychological resistance of 1.2500. The cross retreats after the preliminary Eurozone Harmonized Index of Consumer Prices (HICP) report shows that price pressures were mixed in June.
According to the preliminary HICP report, headline HICP decelerated expectedly to 2.5% year-on-year from May’s reading of 2.6%. In the same period, the core HICP, which strips off volatile items, grew steadily by 2.9%. Investors expected the underlying inflation to have declined to 2.8%. These inflation readings don’t provide any cues about where price pressures are heading and won't solve the interest rate outlook puzzle.
Speaking at the European Central Bank (ECB) Forum on Central Banking on Monday, ECB President Christine Lagarde said that the central bank is not in a hurry to cut interest rates further.
Meanwhile, ECB policymaker Madis Muller also advised to be patient with further rate cuts, said in Tuesday’s European trading hours. Muller added, “We can probably cut rates again before year-end.”
On the political front, the smaller-than-expected lead of Marine Le Pen's far-right National Rally (RN) in the first round of France’s legislative elections against the Centralist alliance and Leftist has eased uncertainty over the deepening financial crisis. However, these fears could revamp again if the second-round runoffs result new government formation.
In the United Kingdom (UK) region, easing price pressures have prompted expectations for the Bank of England (BoE) to begin reducing interest rates from the August meeting. The British Retail Consortium (BRC) showed on Monday that the annual shop price inflation grew at the slowest pace of 0.2% since October 2021 in June
Economic Indicator
Harmonized Index of Consumer Prices (YoY)
The Harmonized Index of Consumer Prices (HICP) measures changes in the prices of a representative basket of goods and services in the European Monetary Union. The HICP, released by Eurostat on a monthly basis, is harmonized because the same methodology is used across all member states and their contribution is weighted. The YoY reading compares prices in the reference month to a year earlier. Generally, a high reading is seen as bullish for the Euro (EUR), while a low reading is seen as bearish.
Read more.Last release: Tue Jul 02, 2024 09:00 (Prel)
Frequency: Monthly
Actual: 2.5%
Consensus: 2.5%
Previous: 2.6%
Source: Eurostat
The British Retail Consortium shop price index (measuring prices in selected stores in the UK) sank to a 0.2% y/y rate. “Is this the end of profit-led inflation?”, UBS macro analyst Paul Donovan asks.
Cost of living in the West remains a politically toxic subject
“Profit-led inflation occurs when retailers use a dominant narrative to disguise profit increases when raising prices. However, at some point, price increases become the dominant narrative and consumer rebellion defeats margin expansion.”
“The collapse in inflation in the US, the UK, and Europe has been miraculous, but cost of living remains a politically toxic subject. Consumers focus on price levels (especially for high frequency purchases) and the ending of margin expansion may slow inflation without lowering prices to levels consumers believe to be ‘fair’.”
“Preliminary June Eurozone consumer price inflation should show a modest slowing. This argues for more rate cuts from the European Central Bank (ECB). The US job openings data (JOLTS) are due. Federal Reserve (Fed) Chair Powell, ECB President Lagarde, and Banco Central do Brasil President Campos Neto are on a panel together.”
China’s official manufacturing PMI remained in contraction for the second consecutive month in Jun while the non-manufacturing PMI slipped to its lowest reading this year. UOB Group macro analysts set their forecast for 2Q24 Chinese GDP growth is at 5.1% y/y.
China to prevent the economic recovery from stalling
“China’s official manufacturing PMI remained in contraction for the second consecutive month in Jun while the non-manufacturing PMI slipped to its lowest reading this year. However, the Caixin manufacturing PMI outperformed again as it edged higher.”
“To prevent the economic recovery from stalling again, the authorities are expected to step up the implementation of earlier announced proactive fiscal measures, particularly on consumption and developing its high-tech growth drivers. The third plenum on 15-18 Jul will focus on the ‘reform of the economic system’ but there is little anticipation for additional stimulus measures.”
“Our forecast for 2Q24 GDP growth is at 5.1% y/y. We maintain our forecast for the 1Y loan prime rate (LPR) to fall to 3.20% by end-4Q24 (current: 3.45%) while the 5Y LPR may stay on hold at 3.95% through the rest of 2024. There is also a possibility of another 50 bps cut to the reserve requirement ratio (RRR) in 2H24.”
- The Pound Sterling faces selling pressure against the US Dollar as uncertainty ahead of Fed Powell’s dampens market sentiment.
- UK’s annual shop price inflation decelerated to its lowest since October 2021.
- The BoE may start cutting interest rates in August.
The Pound Sterling (GBP) retraces to 1.2620 against the US Dollar (USD) in Tuesday’s London session. The GBP/USD pair weakens as market participants turn risk-averse amid uncertainty ahead of Federal Reserve (Fed) Chair Jerome Powell’s speech at 13:30 GMT and the United States (US) Nonfarm Payrolls (NFP) data for June, scheduled on Friday.
Powell is expected to provide cues about when the central bank will begin lowering its key borrowing rates. In June’s policy meeting, Powell said that the softening of inflationary pressures in May is encouraging, but policymakers want to see inflation decline for months before considering interest rate cuts. Officials projected only one rate cut this year as they lack evidence that inflation is on course to return to the desired rate of 2%.
This week, investors will pay close attention to the labor demand and the wage growth data, which will indicate whether the Fed should start reducing interest rates from the September meeting, as indicated by 30-day Federal Fund futures pricing data from the CME FedWatch tool.
In Tuesday’s session, investors will also focus on the US JOLTS Job Openings data for May, which will be published at 14:00 GMT. Economists expect the number of fresh job vacancies to be 7.90 million, slightly lower from 8.06 million in April.
Daily digest market movers: Pound Sterling falls on backfoot
- The Pound Sterling exhibits weakness against its major peers from North America, Europe, and the Japanese Yen (JPY) but is outperforming against Asia-Pacific currencies in Tuesday’s session. The British currency has come under pressure as easing United Kingdom (UK) price pressures have boosted expectations of early rate cuts by the Bank of England (BoE).
- The British Retail Consortium (BRC) showed on Monday that the annual shop price inflation grew 0.2% in June, at the slowest pace since October 2021, decelerating significantly from May’s reading of 0.6%. The agency also reported that food inflation slowed straight for 14 months, declining to 2.5% from 3.2%, and prices for non-food items fell by 1.0% year-on-year, Reuters reported.
- It is worth noting that annual headline inflation, as measured by the Consumer Price Index (CPI), has already returned to the bank’s target of 2%. High inflation in the service sector continues to be a major concern for BoE officials. Policymakers see service inflation as the preferred gauge for price pressures and want it to decline significantly to gain confidence for pivoting to policy normalization.
- Currently, investors expect the BoE to start reducing interest rates at its upcoming meeting in August.
- Meanwhile, the revised estimates for the manufacturing sector showed that factory activities expanded modestly in June. The S&P Global/CIPS Manufacturing PMI report showed on Monday that the factory activity fell to 50.9 from the preliminary reading and the estimates of 51.4. However, it remained above the 50.0 threshold that separates expansion from contraction.
Pound Sterling Price Today:
British Pound PRICE Today
The table below shows the percentage change of British Pound (GBP) against listed major currencies today. British Pound was the strongest against the New Zealand Dollar.
| GBP | EUR | USD | JPY | CAD | AUD | NZD | CHF | |
|---|---|---|---|---|---|---|---|---|
| GBP | 0.08% | -0.14% | 0.00% | -0.12% | 0.00% | 0.20% | 0.03% | |
| EUR | -0.08% | -0.24% | -0.12% | -0.27% | -0.07% | 0.11% | -0.07% | |
| USD | 0.14% | 0.24% | 0.10% | -0.02% | 0.16% | 0.35% | 0.18% | |
| JPY | 0.00% | 0.12% | -0.10% | -0.12% | 0.07% | 0.22% | 0.05% | |
| CAD | 0.12% | 0.27% | 0.02% | 0.12% | 0.18% | 0.37% | 0.18% | |
| AUD | -0.01% | 0.07% | -0.16% | -0.07% | -0.18% | 0.18% | 0.00% | |
| NZD | -0.20% | -0.11% | -0.35% | -0.22% | -0.37% | -0.18% | -0.18% | |
| CHF | -0.03% | 0.07% | -0.18% | -0.05% | -0.18% | -0.00% | 0.18% |
The heat map shows percentage changes of major currencies against each other. The base currency is picked from the left column, while the quote currency is picked from the top row. For example, if you pick the British Pound from the left column and move along the horizontal line to the US Dollar, the percentage change displayed in the box will represent GBP (base)/USD (quote).
Technical Analysis: Pound Sterling falls to near 1.2600
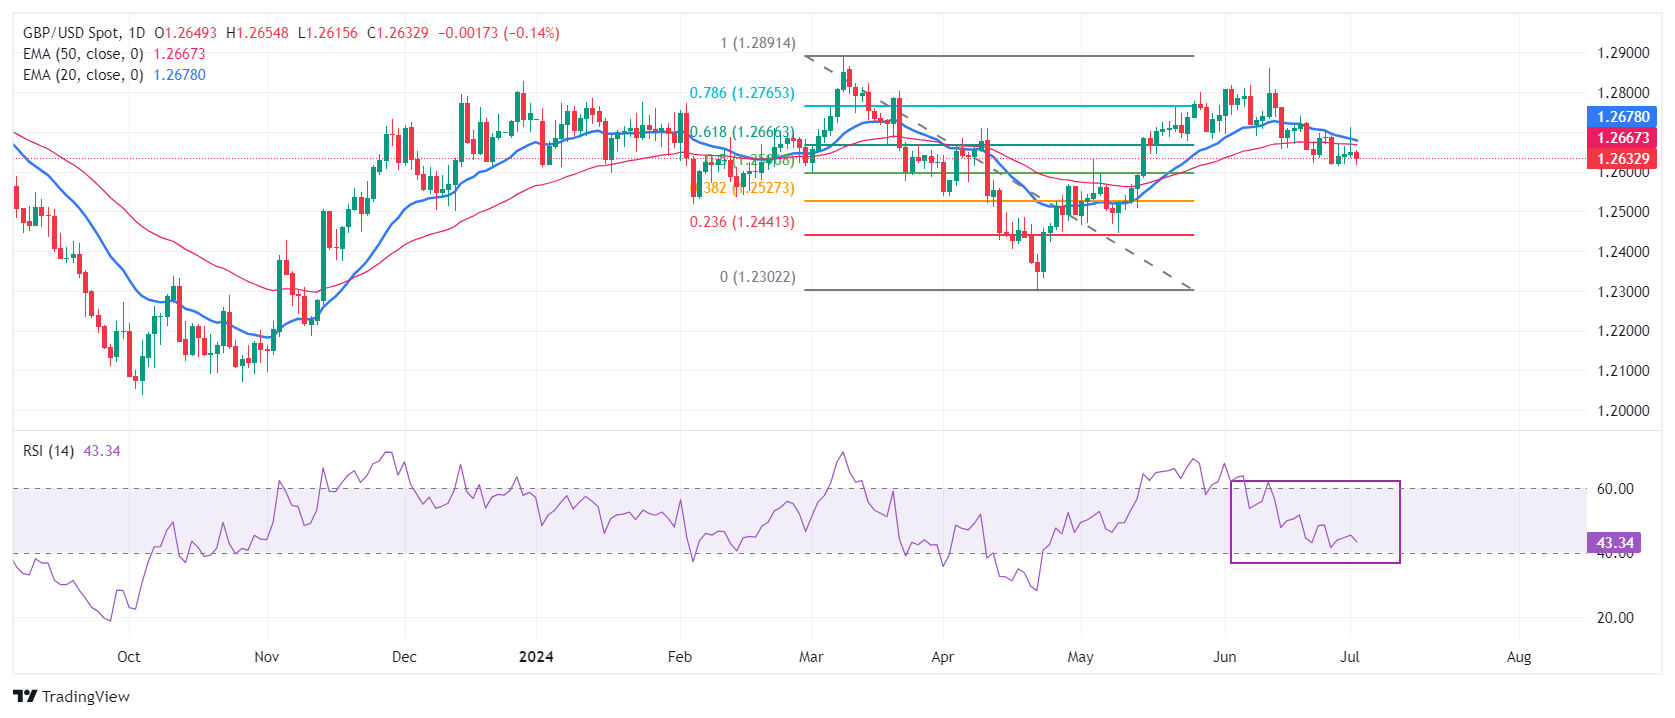
The Pound Sterling slumps against the US Dollar after a short-lived pullback to near the round-level resistance of 1.2700. The GBP/USD pair fails to sustain above the 61.8% Fibonacci retracement support at 1.2667, plotted from the March 8 high of 1.2900 to the April 22 low at 1.2300.
The Cable falls below the 20-day and 50-day Exponential Moving Averages (EMAs) near 1.2675 and 1.2666, respectively, suggesting that the near-term outlook is bearish.
The 14-day Relative Strength Index (RSI) oscillates in the 40.00-60.00 range, indicating indecisiveness among market participants.
Pound Sterling FAQs
The Pound Sterling (GBP) is the oldest currency in the world (886 AD) and the official currency of the United Kingdom. It is the fourth most traded unit for foreign exchange (FX) in the world, accounting for 12% of all transactions, averaging $630 billion a day, according to 2022 data. Its key trading pairs are GBP/USD, aka ‘Cable’, which accounts for 11% of FX, GBP/JPY, or the ‘Dragon’ as it is known by traders (3%), and EUR/GBP (2%). The Pound Sterling is issued by the Bank of England (BoE).
The single most important factor influencing the value of the Pound Sterling is monetary policy decided by the Bank of England. The BoE bases its decisions on whether it has achieved its primary goal of “price stability” – a steady inflation rate of around 2%. Its primary tool for achieving this is the adjustment of interest rates. When inflation is too high, the BoE will try to rein it in by raising interest rates, making it more expensive for people and businesses to access credit. This is generally positive for GBP, as higher interest rates make the UK a more attractive place for global investors to park their money. When inflation falls too low it is a sign economic growth is slowing. In this scenario, the BoE will consider lowering interest rates to cheapen credit so businesses will borrow more to invest in growth-generating projects.
Data releases gauge the health of the economy and can impact the value of the Pound Sterling. Indicators such as GDP, Manufacturing and Services PMIs, and employment can all influence the direction of the GBP. A strong economy is good for Sterling. Not only does it attract more foreign investment but it may encourage the BoE to put up interest rates, which will directly strengthen GBP. Otherwise, if economic data is weak, the Pound Sterling is likely to fall.
Another significant data release for the Pound Sterling is the Trade Balance. This indicator measures the difference between what a country earns from its exports and what it spends on imports over a given period. If a country produces highly sought-after exports, its currency will benefit purely from the extra demand created from foreign buyers seeking to purchase these goods. Therefore, a positive net Trade Balance strengthens a currency and vice versa for a negative balance.
- Fed Chairman Powell and ECB President Lagarde will discuss monetary policy at the ECB Forum on Central Banking.
- Comments on monetary policy divergence between the Fed and the ECB could trigger a market reaction.
- Investors see a less than 40% probability of the Fed leaving the interest rate unchanged in September.
Jerome Powell, Chairman of the Federal Reserve System (Fed), and Christine Lagarde, European Central Bank (ECB) President, will attend a monetary policy panel at the 2024 ECB Forum on Central Banking in Sintra on Tuesday, July 2. The panel will be moderated by CNBC Anchor Sara Eisen.
Fed and ECB policy divergence
The Fed left its policy rate unchanged at the range of 5.25%-5.5% following the June policy meeting, and it’s widely expected to stand pat on policy in July. In the post-meeting press conference, Chairman Powell noted that they need to see more good data to bolster their confidence on inflation moving toward the 2% target before considering a policy pivot.
On the other hand, the ECB announced on June 6 that it lowered key rates by 25 basis points, citing improving dynamics of underlying inflation and the strength of the monetary policy transmission.
Both central banks, however, noted that they will remain data-dependent and take policy decisions on a meeting-by-meeting basis.
The latest decisions by the Fed and the ECB point to diverging monetary policy. Investors will scrutinize comments on interest rate outlook, inflation expectations and growth prospects to see whether the policy gap could widen in the near-to-medium term.
Fed FAQs
Monetary policy in the US is shaped by the Federal Reserve (Fed). The Fed has two mandates: to achieve price stability and foster full employment. Its primary tool to achieve these goals is by adjusting interest rates. When prices are rising too quickly and inflation is above the Fed’s 2% target, it raises interest rates, increasing borrowing costs throughout the economy. This results in a stronger US Dollar (USD) as it makes the US a more attractive place for international investors to park their money. When inflation falls below 2% or the Unemployment Rate is too high, the Fed may lower interest rates to encourage borrowing, which weighs on the Greenback.
The Federal Reserve (Fed) holds eight policy meetings a year, where the Federal Open Market Committee (FOMC) assesses economic conditions and makes monetary policy decisions. The FOMC is attended by twelve Fed officials – the seven members of the Board of Governors, the president of the Federal Reserve Bank of New York, and four of the remaining eleven regional Reserve Bank presidents, who serve one-year terms on a rotating basis.
In extreme situations, the Federal Reserve may resort to a policy named Quantitative Easing (QE). QE is the process by which the Fed substantially increases the flow of credit in a stuck financial system. It is a non-standard policy measure used during crises or when inflation is extremely low. It was the Fed’s weapon of choice during the Great Financial Crisis in 2008. It involves the Fed printing more Dollars and using them to buy high grade bonds from financial institutions. QE usually weakens the US Dollar.
Quantitative tightening (QT) is the reverse process of QE, whereby the Federal Reserve stops buying bonds from financial institutions and does not reinvest the principal from the bonds it holds maturing, to purchase new bonds. It is usually positive for the value of the US Dollar.
ECB FAQs
The European Central Bank (ECB) in Frankfurt, Germany, is the reserve bank for the Eurozone. The ECB sets interest rates and manages monetary policy for the region. The ECB primary mandate is to maintain price stability, which means keeping inflation at around 2%. Its primary tool for achieving this is by raising or lowering interest rates. Relatively high interest rates will usually result in a stronger Euro and vice versa. The ECB Governing Council makes monetary policy decisions at meetings held eight times a year. Decisions are made by heads of the Eurozone national banks and six permanent members, including the President of the ECB, Christine Lagarde.
In extreme situations, the European Central Bank can enact a policy tool called Quantitative Easing. QE is the process by which the ECB prints Euros and uses them to buy assets – usually government or corporate bonds – from banks and other financial institutions. QE usually results in a weaker Euro. QE is a last resort when simply lowering interest rates is unlikely to achieve the objective of price stability. The ECB used it during the Great Financial Crisis in 2009-11, in 2015 when inflation remained stubbornly low, as well as during the covid pandemic.
Quantitative tightening (QT) is the reverse of QE. It is undertaken after QE when an economic recovery is underway and inflation starts rising. Whilst in QE the European Central Bank (ECB) purchases government and corporate bonds from financial institutions to provide them with liquidity, in QT the ECB stops buying more bonds, and stops reinvesting the principal maturing on the bonds it already holds. It is usually positive (or bullish) for the Euro.
Chance for USD to edge above 7.3100, but it is unlikely to be able to maintain a foothold above this level. If it breaks above 7.3100, the next significant resistance at 7.3400 may come into view, UOB Group analysts note.
The next resistance at 7.3400 may come into view
24-HOUR VIEW: “We noted yesterday that ‘the price action is likely part of a range trading phase,’ and we expected USD to trade between 7.2930 and 7.3060. USD then traded in a narrower range than expected (7.2965/7.3060). There has been a slight increase in upward momentum, and there is a chance for USD to edge above 7.3100 today. Given the mild upward momentum, it is unlikely to be able to maintain a foothold above this level. The next resistance at 7.3200 is highly unlikely to come into view. Support levels are at 7.2980 and 7.2930.”
1-3 WEEKS VIEW: “In our most recent narrative from last Thursday (27 Jun, spot at 7.2990), we indicated that USD could break above 7.3100, but it is too early to tell if the next significant resistance at 7.3400 will come into view. There is no change in our view. Overall, only a breach of 7.2800 (no change in ‘strong support’ level) would mean that the advance in USD from the middle of the month has ended.”
The US Dollar (USD) strength remains intact. It could test the resistance at 162.00 before the risk of a pullback increases. If it breaks above 162.00, the next level to watch is 163.00, UOB Group FX strategists note.
Strong support moves to 160.30 from 159.80
24-HOUR VIEW: “We expected USD to trade with an upward bias yesterday. However, we indicated that ‘it is left to be seen if any advance can break above 161.50.’ We also indicated that ‘the next resistance at 162.00 is unlikely to come into view.’ USD subsequently rose, reaching a high of 161.73 before closing at 161.45 (+0.39%). Conditions are overbought, but as long as USD remains above 161.00 (minor support is at 161.30), it could test the resistance at 162.00 before the risk of a pullback increases. A sustained break above 162.00 appears unlikely today.”
1-3 WEEKS VIEW: “We have expected a higher USD since the middle of last month. In our update from yesterday (01 Jul, spot at 161.00), we indicated that ‘conditions remain oversold, but as long as 159.80 is not breached, USD is likely to continue to rise.’ We added, ‘the next resistance level above 161.50 is 162.00.’ We did not expect USD to overcome 161.50 so soon, as it rose to a high of 161.73. We continue to hold a positive USD view. If USD breaks above 162.00, the next level to watch is 163.00. On the downside, the ‘strong support’ level has moved higher to 160.30 from 159.80.”
Silver prices (XAG/USD) fell on Tuesday, according to FXStreet data. Silver trades at $29.37 per troy ounce, down 0.30% from the $29.46 it cost on Monday.
Silver prices have increased by 23.42% since the beginning of the year.
| Unit measure | Silver Price Today in USD |
|---|---|
| Troy Ounce | 29.37 |
| 1 Gram | 0.94 |
The Gold/Silver ratio, which shows the number of ounces of Silver needed to equal the value of one ounce of Gold, stood at 79.39 on Tuesday, up from 79.17 on Monday.
Silver FAQs
Silver is a precious metal highly traded among investors. It has been historically used as a store of value and a medium of exchange. Although less popular than Gold, traders may turn to Silver to diversify their investment portfolio, for its intrinsic value or as a potential hedge during high-inflation periods. Investors can buy physical Silver, in coins or in bars, or trade it through vehicles such as Exchange Traded Funds, which track its price on international markets.
Silver prices can move due to a wide range of factors. Geopolitical instability or fears of a deep recession can make Silver price escalate due to its safe-haven status, although to a lesser extent than Gold's. As a yieldless asset, Silver tends to rise with lower interest rates. Its moves also depend on how the US Dollar (USD) behaves as the asset is priced in dollars (XAG/USD). A strong Dollar tends to keep the price of Silver at bay, whereas a weaker Dollar is likely to propel prices up. Other factors such as investment demand, mining supply – Silver is much more abundant than Gold – and recycling rates can also affect prices.
Silver is widely used in industry, particularly in sectors such as electronics or solar energy, as it has one of the highest electric conductivity of all metals – more than Copper and Gold. A surge in demand can increase prices, while a decline tends to lower them. Dynamics in the US, Chinese and Indian economies can also contribute to price swings: for the US and particularly China, their big industrial sectors use Silver in various processes; in India, consumers’ demand for the precious metal for jewellery also plays a key role in setting prices.
Silver prices tend to follow Gold's moves. When Gold prices rise, Silver typically follows suit, as their status as safe-haven assets is similar. The Gold/Silver ratio, which shows the number of ounces of Silver needed to equal the value of one ounce of Gold, may help to determine the relative valuation between both metals. Some investors may consider a high ratio as an indicator that Silver is undervalued, or Gold is overvalued. On the contrary, a low ratio might suggest that Gold is undervalued relative to Silver.
(An automation tool was used in creating this post.)
- Silver price depreciates as US Dollar improves due to higher yields.
- The non-yielding Silver may rebound as recent US inflation data raised the expectations of the Fed reducing rates in 2024.
- Demand uncertainties in China, the largest consumer of Silver, might add to the pressure on prices.
Silver price (XAG/USD) halts its three-day winning streak, hovering around $29.30 per troy ounce during the European trading hours on Tuesday. The price of Silver faces the challenge of an improved US Dollar (USD), which could be attributed to the higher UST yields. Traders await Tuesday’s speech by Federal Reserve Chairman Jerome Powell to assess the monetary policy outlook.
The price of the grey metal may regain its ground as the recent US inflation data raised the expectations of the Federal Reserve (Fed) reducing interest rates in 2024. Lower interest rates could spark the demand of non-yielding assets like Silver.
On Friday, the US Bureau of Economic Analysis reported that recent US inflation eased to its lowest annual rate in over three years. The US Personal Consumption Expenditures (PCE) Price Index increased by 2.6% year-over-year in May, down from 2.7% in April. Meanwhile, Core PCE inflation rose by 2.6% year-over-year in May, down from 2.8% in April.
However, Federal Reserve Bank of San Francisco President Mary Daly remarked on Friday, "If inflation stays sticky or comes down slowly, rates would need to be higher for longer," according to Reuters.
Demand uncertainties in China might contribute to the pressure on Silver prices after an official report indicated a second consecutive month of manufacturing downturn in June. China's National Bureau of Statistics (NBS) reported that the Manufacturing PMI remained at 49.5.
Silver FAQs
Silver is a precious metal highly traded among investors. It has been historically used as a store of value and a medium of exchange. Although less popular than Gold, traders may turn to Silver to diversify their investment portfolio, for its intrinsic value or as a potential hedge during high-inflation periods. Investors can buy physical Silver, in coins or in bars, or trade it through vehicles such as Exchange Traded Funds, which track its price on international markets.
Silver prices can move due to a wide range of factors. Geopolitical instability or fears of a deep recession can make Silver price escalate due to its safe-haven status, although to a lesser extent than Gold's. As a yieldless asset, Silver tends to rise with lower interest rates. Its moves also depend on how the US Dollar (USD) behaves as the asset is priced in dollars (XAG/USD). A strong Dollar tends to keep the price of Silver at bay, whereas a weaker Dollar is likely to propel prices up. Other factors such as investment demand, mining supply – Silver is much more abundant than Gold – and recycling rates can also affect prices.
Silver is widely used in industry, particularly in sectors such as electronics or solar energy, as it has one of the highest electric conductivity of all metals – more than Copper and Gold. A surge in demand can increase prices, while a decline tends to lower them. Dynamics in the US, Chinese and Indian economies can also contribute to price swings: for the US and particularly China, their big industrial sectors use Silver in various processes; in India, consumers’ demand for the precious metal for jewellery also plays a key role in setting prices.
Silver prices tend to follow Gold's moves. When Gold prices rise, Silver typically follows suit, as their status as safe-haven assets is similar. The Gold/Silver ratio, which shows the number of ounces of Silver needed to equal the value of one ounce of Gold, may help to determine the relative valuation between both metals. Some investors may consider a high ratio as an indicator that Silver is undervalued, or Gold is overvalued. On the contrary, a low ratio might suggest that Gold is undervalued relative to Silver.
The New Zealand Dollar (NZD) could pullback further, but slowdown in momentum suggests the major support at 0.6040 could be out of reach, UOB Group analysts note.
A break above 0.6135 to turn momentum upwards
24-HOUR VIEW: “We expected NZD to trade in a sideways range of 0.6080/0.6120 yesterday. However, the price action did not quite pan out as we expected. NZD rose to 0.6110 before staging a surprisingly sharp pullback to a low of 0.6066. NZD closed at 0.6075 (-0.25%). Today, NZD could continue to pullback. Given the current mild downward momentum, any decline is unlikely to reach the major support at 0.6040. Resistance levels are at 0.6085 and 0.6105.”
1-3 WEEKS VIEW: “Our update from yesterday (01 Jul, spot at 0.6095) still stands. As highlighted, while there is still room for NZD to continue to weaken, the slowdown in momentum suggests 0.6040 could be out of reach this time. Conversely, if NZD breaks above 0.6135 (no change in ‘strong resistance’ level), it would mean that the weakness in NZD that started in the middle of last month has ended.”
The Eurozone Harmonized Index of Consumer Prices (HICP) rose 2.5% in the year through June, a tad slower than a 2.6% growth registered in May, the official data released by Eurostat showed Tuesday. The market forecast was for a 2.5% increase in the reported period.
The Core HICP inflation dipped to 2.8% YoY in the same period, against May’s 2.9% increase while meeting the estimated 2.8% print.
On a monthly basis, the bloc’s HICP rose 0.2% in June vs. a 0.2% increase in May. The core HICP inflation came in at 0.3% MoM in the same period, compared with a 0.4% growth seen previously.
The European Central Bank’s (ECB) inflation target is 2.0%. The old continent’s HICP inflation data have a significant impact on the market’s pricing of the ECB's second interest rate cut.
Key details from the Eurozone inflation report (via Eurostat)
“Looking at the main components of euro area inflation, services is expected to have the highest annual rate in June (4.1%, stable compared with May), followed by food, alcohol & tobacco (2.5%, compared with 2.6% in May), non-energy industrial goods (0.7%, stable compared with May) and energy (0.2%, compared with 0.3% in May).”
EUR/USD reaction to the Eurozone inflation report
The Euro remains unfazed by the mixed Eurozone inflation data. EUR/USD is trading 0.18% lower on the day at 1.0171, as of writing.
(This story was corrected on Tuesday at 9:09 GMT to say that "the Eurozone Harmonized Index of Consumer Prices (HICP) rose 2.5% in the year through June, a tad slower than a 2.6% growth registered in May,"not higher than)
Euro PRICE Today
The table below shows the percentage change of Euro (EUR) against listed major currencies today. Euro was the weakest against the Canadian Dollar.
| USD | EUR | GBP | JPY | CAD | AUD | NZD | CHF | |
|---|---|---|---|---|---|---|---|---|
| USD | 0.21% | 0.15% | 0.08% | -0.04% | 0.15% | 0.33% | 0.17% | |
| EUR | -0.21% | -0.06% | -0.10% | -0.25% | -0.06% | 0.10% | -0.05% | |
| GBP | -0.15% | 0.06% | -0.04% | -0.17% | -0.02% | 0.17% | 0.00% | |
| JPY | -0.08% | 0.10% | 0.04% | -0.13% | 0.07% | 0.22% | 0.06% | |
| CAD | 0.04% | 0.25% | 0.17% | 0.13% | 0.19% | 0.37% | 0.20% | |
| AUD | -0.15% | 0.06% | 0.02% | -0.07% | -0.19% | 0.17% | 0.00% | |
| NZD | -0.33% | -0.10% | -0.17% | -0.22% | -0.37% | -0.17% | -0.17% | |
| CHF | -0.17% | 0.05% | -0.00% | -0.06% | -0.20% | -0.00% | 0.17% |
The heat map shows percentage changes of major currencies against each other. The base currency is picked from the left column, while the quote currency is picked from the top row. For example, if you pick the Euro from the left column and move along the horizontal line to the US Dollar, the percentage change displayed in the box will represent EUR (base)/USD (quote).
The Australian Dollar (AUD) is likely to trade sideways between 0.6630 and 0.6685 or to edge higher. The likelihood of it breaking clearly above the major resistance zone of 0.6705/0.67816 is low for now, UOB Group analysts note.
AUD moves sideways with an upward mood
24-HOUR VIEW: “After AUD rose sharply last Friday, we indicated yesterday that ‘the sharp rise appears to be overextended, and AUD is unlikely to advance much further.’ We expected AUD to trade sideways between 0.6630 and 0.6685. AUD then traded in a range of 0.6645/0.6689, closing at 0.6661 (-0.14%). There has been no increase in either upward or downward momentum. Today, we continue to expect AUD to trade sideways between 0.6630 and 0.6685.”
1-3 WEEKS VIEW: “We highlighted yesterday (01 Jul, spot at 0.6670) that ‘there has been a slight increase in upward momentum, but not enough to suggest the start of a sustained advance.’ We also highlighted that ‘as long as AUD remains above 0.6610, it is likely to edge higher, but the likelihood of it breaking clearly above the major resistance zone of 0.6705/0.6715 is low for now.’ We continue to hold the same view.”
The Pound Sterling (GBP) is expected to trade in a sideways range of 1.2615/1.2680. Current price movements are likely part of a consolidation, UOB Group FX strategists suggest.
Consolidation phase looms over the markets
24-HOUR VIEW: “Yesterday, we expected GBP to trade in a sideways range of 1.2625/1.2675. However, GBP spiked briefly to 1.2710 and then pulled back to close largely unchanged at 1.2651 (+0.04%). The brief advance did not result in any increase in upward momentum. We continue to expect GBP to trade sideways, likely in a range of 1.2615/1.2680.”
1-3 WEEKS VIEW: “We have held a negative view in GBP for about 2 weeks now. Yesterday (01 Jul, spot at 1.2645), we highlighted that ‘momentum is beginning to fade.’ We added, ‘if GBP breaks above 1.2700, it would mean that GBP is not weakening further.’ In NY trade, GBP spiked briefly above 1.2700, reaching a high of 1.2710. The breach of our ‘strong resistance’ level of 1.2700 indicates that GBP is not weakening further. The current price movements are likely part of a consolidation phase. For now, GBP is likely to trade between 1.2600 and 1.2720.”
“We can cut rates further if things go as expected,” European Central Bank (ECB) policymaker Boštjan Vasle said on Tuesday.
Additional takeaways
But we need more data to confirm inflation trajectory.
Must be careful not to declare victory too soon.
Labour market is very important for next steps.
Labour market is still tight, causing wage pressure.
European Central Bank (ECB) policymaker Mario Centeno said on Tuesday that “every meeting is open for us to make a decision.”
Further comments
As confidence builds, ECB can look at every meeting in making a decision.
There is confidence that inflation will hit 2% target next year.
Our baseline projections have proved to be quite solid.
We must be prudent on rates.
Still hesitant on growth assessment.
Monetary policy must aid with economic recovery.
Market reaction
EUR/USD is consolidating the latest leg lower to near 1.0710, losing 0.20% on the day, as of writing.
The Euro (EUR) is likely to trade in a sideways range of 1.0710/1.0760, UOB Group analysts note.
EUR/USD goes sidelined
24-HOUR VIEW: “While we expected EUR to edge higher yesterday, we were of the view that ‘any advance is unlikely to break above 1.0760.’ EUR rose more than expected to 1.0776 before pulling back. The pullback in overbought conditions suggests EUR is unlikely to rise further. Today, we expect EUR to trade in a sideways range of 1.0710/1.0760.”
1-3 WEEKS VIEW: “We continue to hold the same view as yesterday (01 Jul, spot at 1.0735). As highlighted, EUR is likely to trade in a range for now, probably between 1.0680 and 1.0785. Note that EUR rose towards the top of the expected range, reaching a high of 1.0776 in London trade before pulling back.”
European Central Bank (ECB) policymaker Madis Muller said on Tuesday that “we can probably cut rates again before year-end.”
Additional quotes
But should not rush in doing so.
We can cut more if baseline projections hold.
Must be patient with further rate cuts.
There is a risk of underestimating inflation stickiness.
Market reaction
EUR/USD was last trading at 1.0716, down 0.20% so far.
- WTI price extends gains due to increased expectations for higher US Oil demand during the summer travel season.
- American Automobile Association projects a 5.2% increase in travel, with car travel alone rising by 4.8% this year.
- Oil prices may gain ground as recent US inflation data raised the expectations of the Fed reducing rates in 2024.
West Texas Intermediate (WTI) crude Oil price extends gains for the second consecutive day on Tuesday, trading around the two-month high near $83.10 per barrel. Crude Oil prices appreciate due to heightened expectations for rising fuel demand from the summer travel season.
US Oil demand is expected to increase as the summer travel season peaks with the Independence Day holiday this week. According to the American Automobile Association (AAA), travel during this period is projected to be 5.2% higher than in 2023, with car travel alone rising by 4.8% compared to the previous year, Reuters reports.
Additionally, the recent US inflation data raised the expectations of the Federal Reserve (Fed) reducing interest rates in 2024. Lower interest rates could boost the economic growth of the United States (US), the world’s biggest Oil consumer, hence supporting the WTI price.
On Friday, the US Bureau of Economic Analysis reported that recent US inflation eased to its lowest annual rate in over three years. The US Personal Consumption Expenditures (PCE) Price Index increased by 2.6% year-over-year in May, down from 2.7% in April. Meanwhile, Core PCE inflation rose by 2.6% year-over-year in May, down from 2.8% in April.
In Japan, a fire broke out early Tuesday afternoon at Idemitsu Kosan's Chiba refinery, the country's second-largest Oil refiner. The refinery, located near Tokyo, operates a 190,000 barrels per day crude distillation unit (CDU).
WTI Oil FAQs
WTI Oil is a type of Crude Oil sold on international markets. The WTI stands for West Texas Intermediate, one of three major types including Brent and Dubai Crude. WTI is also referred to as “light” and “sweet” because of its relatively low gravity and sulfur content respectively. It is considered a high quality Oil that is easily refined. It is sourced in the United States and distributed via the Cushing hub, which is considered “The Pipeline Crossroads of the World”. It is a benchmark for the Oil market and WTI price is frequently quoted in the media.
Like all assets, supply and demand are the key drivers of WTI Oil price. As such, global growth can be a driver of increased demand and vice versa for weak global growth. Political instability, wars, and sanctions can disrupt supply and impact prices. The decisions of OPEC, a group of major Oil-producing countries, is another key driver of price. The value of the US Dollar influences the price of WTI Crude Oil, since Oil is predominantly traded in US Dollars, thus a weaker US Dollar can make Oil more affordable and vice versa.
The weekly Oil inventory reports published by the American Petroleum Institute (API) and the Energy Information Agency (EIA) impact the price of WTI Oil. Changes in inventories reflect fluctuating supply and demand. If the data shows a drop in inventories it can indicate increased demand, pushing up Oil price. Higher inventories can reflect increased supply, pushing down prices. API’s report is published every Tuesday and EIA’s the day after. Their results are usually similar, falling within 1% of each other 75% of the time. The EIA data is considered more reliable, since it is a government agency.
OPEC (Organization of the Petroleum Exporting Countries) is a group of 13 Oil-producing nations who collectively decide production quotas for member countries at twice-yearly meetings. Their decisions often impact WTI Oil prices. When OPEC decides to lower quotas, it can tighten supply, pushing up Oil prices. When OPEC increases production, it has the opposite effect. OPEC+ refers to an expanded group that includes ten extra non-OPEC members, the most notable of which is Russia.
- Gold is trading in a narrow range as the outlook for a key driver – US interest rates – remains opaque.
- The Fed continues to weigh up the pros and cons of cutting interest rates, a potentially positive event for Gold.
- Multiple geopolitical factors suggest a broadly bullish backdrop for the precious metal.
Gold (XAU/USD) continues trading in a familiar range within the $2,320-$2,330s, just below the 50-day Simple Moving Average (SMA) on Tuesday, amid Futures’ traders “short-covering”, as well as “bargain hunting” by longer-term investors, according to Kitco’s Jim Wyckoff. This could be an accumulation phase as investors position for another rally in Gold given multiple global factors continue to support the secular long view.
Unresolved geopolitical conflicts in the Middle East and Ukraine, a lurch right politically in Europe, Trump, and growing fracture lines along ideological, political, and economic grounds between the East and West – exemplified by the expansion of the BRICS trading confederation – are increasingly posing a threat to the smooth running of global free trade. As a safe-haven in times of crisis and probably the only viable alternative to the dominance of the US Dollar, Gold steps forward as a leading actor on the new world order’s stage.
Gold bulls reigned back by Fed coyness
Gold is trapped in a range as the US Federal Reserve (Fed) remains reluctant to commit to a date for when it will begin cutting interest rates. Gold is a non-interest-paying asset, so there is an opportunity cost to holding it. This opportunity cost continues to remain high as long as the Fed waits. When the Fed does finally start cutting interest rates, however, it will provide a positive back wind for Gold.
Although the Fed’s preferred gauge of inflation, the US Personal Consumption Expenditures (PCE) Price Index, continued to fall in line with expectations in May, reaching 2.6% year-over-year (YoY) – another step closer to the Fed’s 2.0% target – Fed officials speaking after the event still remained coy about committing to cuts.
Richmond Fed President Thomas Barkin talked of “lags” in monetary tightening playing out and cautioned that "services and shelter price-setters still have room to push prices higher." Prior to him, San Francisco Fed President Mary Daly told CNBC that cooling inflation showed that the monetary policy was working as it should, but that it was still too early to tell when it would be appropriate to cut interest rates.
Now traders are awaiting more commentary from Chairman of the Fed Jerome Powell on Tuesday, whilst US jobs data including JOLTS Job Openings and then the Nonfarm Payrolls release on Friday could all color the outlook for interest rates and impact Gold.
US ISM Manufacturing Purchasing Managers Index (PMI) data out on Monday came out below expectations, but this seemed to have little impact on Gold, which continued rallying. Nor did the rise in US Treasury yields, which was put down to the increased likelihood of Donald Trump winning the next presidential election in November, seem to impact Gold. Normally, it would be expected to be negative. Although this might be because of the geopolitical risk Trump carries which is a counterbalancing positive factor for safe-haven Gold.
Market-based bets on when the Federal Reserve could cut interest rates are perhaps more optimistic, continuing to flag a high probability of the Fed cutting interest rates at the September meeting. According to the CME FedWatch tool, which calculates chances using 30-day Fed Funds futures prices, the probability of a cut in (or before) September has popped back up to 65%, from 63% on Monday. It appears to be stabilizing around the mid-60s.
Technical Analysis: Gold meanders below restrictive 50-day SMA
Gold edges lower as it trades along the underside of the 50-day SMA on Tuesday.
Last week, XAU/USD broke above a trendline connecting the “Head” and “Right Shoulder” of a now invalidated Head and Shoulders (H&S) pattern that formed during April, May, and June in the daily chart.
XAU/USD Daily Chart
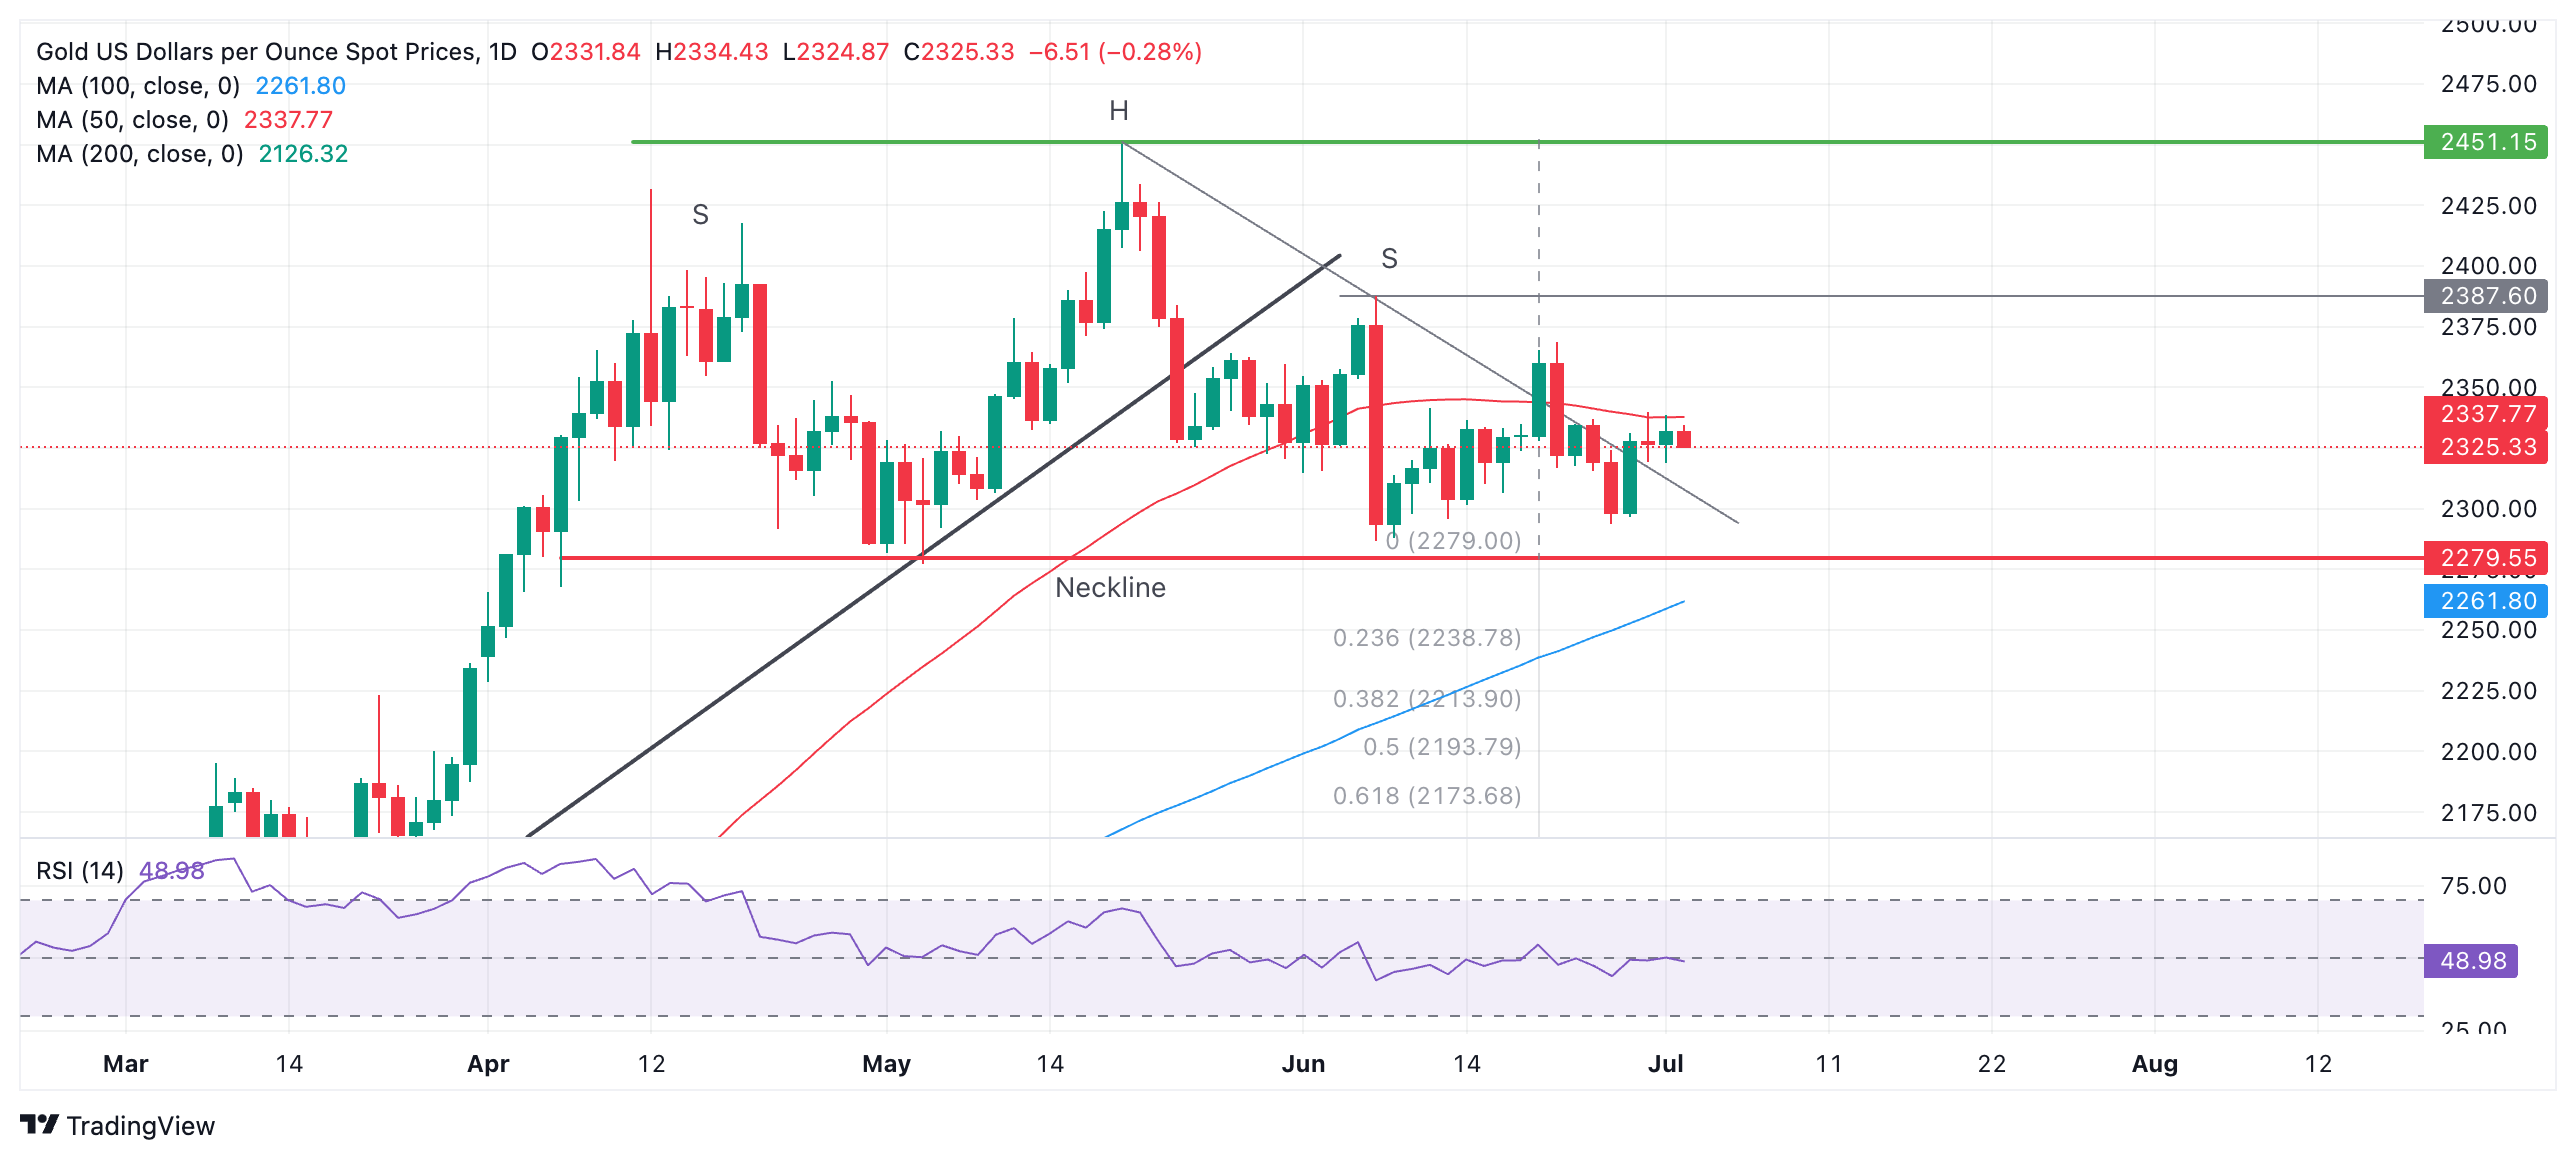
Whilst it is still possible a more complex bearish “multi-shouldered” topping pattern may still be forming, the odds are lower since the trendline break.
Gold could rise to the $2,369 level (the June 21 high) if it breaks above $2,340. The next target above that would be $2,388, the June 7 high.
Alternatively, assuming the compromised topping pattern’s neckline at $2,279 is broken, a reversal lower may still follow, with a conservative target at $2,171, the 0.618 ratio of the height of the pattern extrapolated lower.
The trend is now sideways in both the short and medium term. In the long term, Gold remains in an uptrend.
- EUR/USD corrects to near 1.0720 as the US Dollar recovers despite weak US Manufacturing PMI data.
- The Euro remains on tenterhooks ahead of the preliminary Eurozone HICP report for June.
- Investors await Fed Powell’s speech for fresh guidance on interest rates.
EUR/USD edges lower but holds the crucial support of 1.0700 in Tuesday’s European session, correcting down from a more than two-week high near 1.0770 recorded on Monday. The major currency pair is expected to remain volatile as investors shift focus to the preliminary Eurozone Harmonized Index of Consumer Prices (HICP) data for June, which will be published at 09:00 GMT.
The inflation report is expected to show that HICP decelerated to 2.5% year-on-year from May’s reading of 2.6%. In the same period, the core HICP, which excludes volatile components like food, energy, alcohol, and tobacco, is estimated to have grown at a slower pace of 2.8% from the prior release of 2.9%. The scenario in which price pressures decline, at an expected or at a higher pace, will boost expectations of the European Central Bank’s (ECB) subsequent interest rate cuts.
On Monday, the preliminary German HICP report for June showed that price pressures softened more than expected, opening the door for the ECB to make back-to-back rate cuts. However, policymakers have refrained from providing a specific rate-cut path as they worry that an aggressive policy-easing campaign could revamp price pressures again.
Also, ECB President Christine Lagarde said at the ECB Forum on Central Banking on Monday, "It will take time for us to gather sufficient data to be certain that the risks of above-target inflation have passed." Lagarde added, "The strong labor market means that we can take time to gather new information," Reuters reported.
Apart from the Eurozone’s inflation data, France’s second-round runoffs scheduled on July 7 will also keep the Euro on its toes. As per the exit polls for the first round of France's parliamentary elections, Marine Le Pen's far-right National Rally (RN) is in a comfortable position but with a smaller margin than projected.
Daily digest market movers: EUR/USD remains uncertain as US Dollar bounces back
- EUR/USD falls slightly as the US Dollar (USD) rebounds despite the United States (US) ISM Manufacturing Purchasing Managers’ Index (PMI) report for June showing that factory activities unexpectedly declined. Data also indicate that inflationary pressures in the manufacturing sector, measured by the ISM Manufacturing Prices Paid Index, grew at a significantly slower pace than expected.
- The US Dollar Index (DXY), which tracks the Greenback’s value against six major currencies, recovers sharply to near 106.00. Meanwhile, investors look for more cues about when the Federal Reserve (Fed) will start reducing interest rates this year. For that, investors will focus on Fed Chair Jerome Powell’s speech, scheduled at 13:30 GMT.
- Currently, financial markets expect the Fed to start reducing interest rates from the September meeting. Two rate cuts this year, against only one cut projected by Fed policymakers in their latest dot plot, are expected.
- Apart from Fed Powell’s speech, investors will also focus on the JOLTS Job Openings data for May, which will be published at 14:00 GMT. Economists expect that employers posted 7.9 million job vacancies, slightly lower than April’s reading of 8.06 million.
Technical Analysis: EUR/USD holds key support of 1.0700
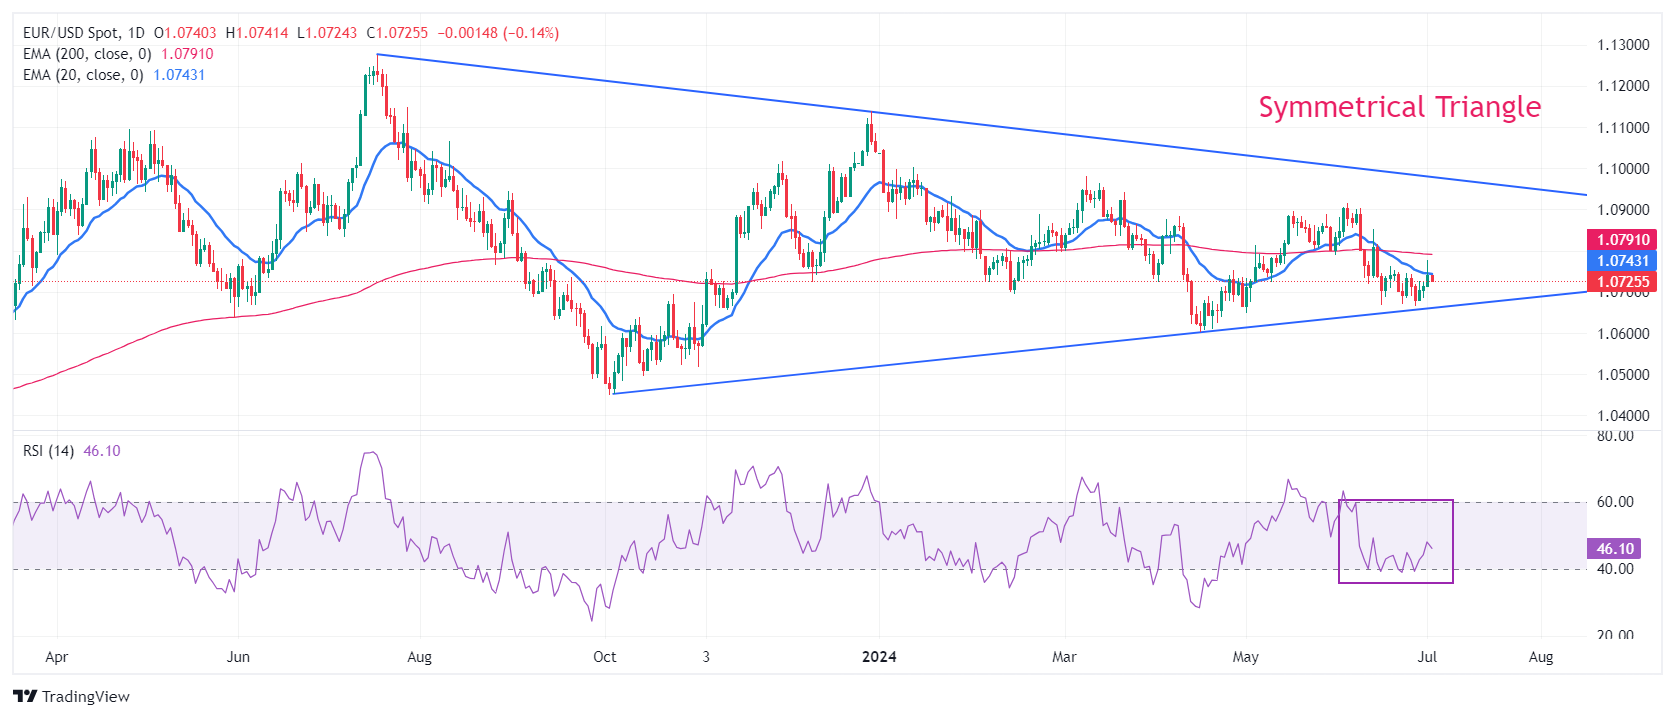
EUR/USD drops to near 1.0720 after failing to hold above the 20-day Exponential Moving Average (EMA), which trades around 1.0740. The major currency pair rebounded last week after discovering strong buying interest near the upward-sloping border of the Symmetrical Triangle formation on a daily timeframe near 1.0666, which is marked from 3 October 2023 low at 1.0448. The downward-sloping border of the above-mentioned chart pattern is plotted from 18 July 2023 high at 1.1276. The Symmetrical Triangle formation exhibits a sharp volatility contraction, which indicates low volume and narrow ticks.
The major currency pair remains below the 200-day Exponential Moving Average (EMA) near 1.0790, suggesting that the overall trend is bearish.
The 14-period Relative Strength Index (RSI) oscillates in the 40.00-60.00 range, suggesting indecisiveness among market participants.
Euro FAQs
The Euro is the currency for the 20 European Union countries that belong to the Eurozone. It is the second most heavily traded currency in the world behind the US Dollar. In 2022, it accounted for 31% of all foreign exchange transactions, with an average daily turnover of over $2.2 trillion a day. EUR/USD is the most heavily traded currency pair in the world, accounting for an estimated 30% off all transactions, followed by EUR/JPY (4%), EUR/GBP (3%) and EUR/AUD (2%).
The European Central Bank (ECB) in Frankfurt, Germany, is the reserve bank for the Eurozone. The ECB sets interest rates and manages monetary policy. The ECB’s primary mandate is to maintain price stability, which means either controlling inflation or stimulating growth. Its primary tool is the raising or lowering of interest rates. Relatively high interest rates – or the expectation of higher rates – will usually benefit the Euro and vice versa. The ECB Governing Council makes monetary policy decisions at meetings held eight times a year. Decisions are made by heads of the Eurozone national banks and six permanent members, including the President of the ECB, Christine Lagarde.
Eurozone inflation data, measured by the Harmonized Index of Consumer Prices (HICP), is an important econometric for the Euro. If inflation rises more than expected, especially if above the ECB’s 2% target, it obliges the ECB to raise interest rates to bring it back under control. Relatively high interest rates compared to its counterparts will usually benefit the Euro, as it makes the region more attractive as a place for global investors to park their money.
Data releases gauge the health of the economy and can impact on the Euro. Indicators such as GDP, Manufacturing and Services PMIs, employment, and consumer sentiment surveys can all influence the direction of the single currency. A strong economy is good for the Euro. Not only does it attract more foreign investment but it may encourage the ECB to put up interest rates, which will directly strengthen the Euro. Otherwise, if economic data is weak, the Euro is likely to fall. Economic data for the four largest economies in the euro area (Germany, France, Italy and Spain) are especially significant, as they account for 75% of the Eurozone’s economy.
Another significant data release for the Euro is the Trade Balance. This indicator measures the difference between what a country earns from its exports and what it spends on imports over a given period. If a country produces highly sought after exports then its currency will gain in value purely from the extra demand created from foreign buyers seeking to purchase these goods. Therefore, a positive net Trade Balance strengthens a currency and vice versa for a negative balance.
Federal Reserve (Fed) Bank of Chicago President Austan Goolsbee told Bloomberg TV on Tuesday that the improved monthly inflation readings feel like they are on a path to 2%, per Reuters.
Key takeaways
"Still grappling with housing inflation."
"There are some warning signs in the job market."
"Restrictive rates for too long could be a problem."
Market reaction
The US Dollar (USD) preserves its strength following these comments. At the time of press, the USD Index, which tracks the USD's valuation against a basket of six major currencies, was up 0.2% on the day at 106.03.
- GBP/JPY corrects from a 16-year high of 204.75 marked on Monday.
- BRC Shop Price Index, an indicator of inflationary pressures in the UK, rose by 0.2% YoY in June, below the prior 0.6% increase.
- The Japanese Yen may receive support from the verbal intervention by Japanese authorities.
GBP/JPY halts its winning streak that began on June 17, trading around 204.00 during the early European session on Tuesday. The GBP/JPY cross reached a level of 204.75 on Monday, the highest since August 2008.
This downturn can be attributed to the softer data released by the British Retail Consortium (BRC) on Tuesday. The BRC Shop Price Index (SPI) increased by 0.2% year-over-year in June, compared to the previous 0.6% increase. Changes in the SPI are closely monitored as an indicator of inflationary pressures in the United Kingdom (UK).
Additionally, the Bank of England's (BoE) dovish pause in June has increased expectations for a rate cut at the August monetary policy meeting, potentially weakening the British Pound (GBP) and affecting the GBP/JPY cross.
GBP traders will be watching the upcoming general election on Thursday. According to the latest exit polls, the Opposition Labour Party is anticipated to prevail over the Conservative Party led by UK Prime Minister Rishi Sunak.
On the JPY’s front, the verbal intervention by Japanese authorities might support the Japanese Yen and limit the upside of the GBP/JPY cross. Japanese Finance Minister Shunichi Suzuki stated on Tuesday that he is "closely watching FX moves with vigilance." Suzuki refrained from commenting on specific forex levels, noting that there is no change in the government's stance on foreign exchange, according to Reuters.
According to the latest Reuters survey conducted from June 25 to July 1, the Bank of Japan is expected to reduce its monthly bond purchases by roughly $100 billion (¥16.00 trillion) in the first year under a quantitative tightening (QT) plan set for release this month.
Interest rates FAQs
Interest rates are charged by financial institutions on loans to borrowers and are paid as interest to savers and depositors. They are influenced by base lending rates, which are set by central banks in response to changes in the economy. Central banks normally have a mandate to ensure price stability, which in most cases means targeting a core inflation rate of around 2%. If inflation falls below target the central bank may cut base lending rates, with a view to stimulating lending and boosting the economy. If inflation rises substantially above 2% it normally results in the central bank raising base lending rates in an attempt to lower inflation.
Higher interest rates generally help strengthen a country’s currency as they make it a more attractive place for global investors to park their money.
Higher interest rates overall weigh on the price of Gold because they increase the opportunity cost of holding Gold instead of investing in an interest-bearing asset or placing cash in the bank. If interest rates are high that usually pushes up the price of the US Dollar (USD), and since Gold is priced in Dollars, this has the effect of lowering the price of Gold.
The Fed funds rate is the overnight rate at which US banks lend to each other. It is the oft-quoted headline rate set by the Federal Reserve at its FOMC meetings. It is set as a range, for example 4.75%-5.00%, though the upper limit (in that case 5.00%) is the quoted figure. Market expectations for future Fed funds rate are tracked by the CME FedWatch tool, which shapes how many financial markets behave in anticipation of future Federal Reserve monetary policy decisions.
European Central Bank (ECB) Vice President Luis de Guindos said on Tuesday that “we are not following a pre-determined path on interest rates.”
Additional quotes
Uncertainty remains high.
We have to be very prudent.
Inflation will have its ups and downs this year.
Economy is to be stronger in 2H than it was in 1H.
Market reaction
At the time of writing, EUR/USD is dropping 0.18% on the day to trade near 1.0720.
- USD/CAD holds positive ground around 1.3745 in Tuesday’s early European session.
- The Fed’s cautious stance continues to underpin the Greenback, creating a tailwind for the pair.
- Canada’s June S&P Global Manufacturing PMI data and Fed’s Chair Powell speech will be the highlights on Tuesday.
The USD/CAD pair trades on a stronger note near 1.3745 during the early European session on Tuesday. The uptick of the pair is supported by the firmer Greenback and higher US Treasury bond yields. Later in the day, the Canadian S&P Global Manufacturing Purchasing Managers Index (PMI) for June is due, which is estimated to improve to 50.2 from 49.3 in May. Also, Federal Reserve (Fed) Chairman Jerome Powell's speech will be closely watched.
The weaker-than-expected US ISM Manufacturing PMI for June supported the case that the Fed will cut interest rates in September. Traders are now pricing in nearly 68% odds that the Fed will cut rate in September, up more than 20 percentage points from a month ago, according to the CME FedWatch tool. San Francisco Fed President Mary Daly stated that the US central bank remains data-dependent and didn't give an estimation of a policy path forward. The cautious tone of the Fed officials continues to underpin the US Dollar (USD) in the near term despite a series of weaker US economic data.
The Bank of Canada (BoC) cut interest rates to 4.75% on June 5, making it the first G7 nation to loosen monetary policy in the current cycle. During the press conference, the BoC governor Tiff Macklem said Canada was in a position to cut rates, but there are limits to how far the BoC can diverge from the Fed, and they are not close to those limits.
“This is indeed likely to be the first of a series of cuts, although that series is not going to be a straight line down by any means. The Bank's tone is a bit more dovish than expected, but each and every cut this year will require evidence that inflation is calming,” said Douglas Porter, chief economist at BMO Economics.
Canadian Dollar FAQs
The key factors driving the Canadian Dollar (CAD) are the level of interest rates set by the Bank of Canada (BoC), the price of Oil, Canada’s largest export, the health of its economy, inflation and the Trade Balance, which is the difference between the value of Canada’s exports versus its imports. Other factors include market sentiment – whether investors are taking on more risky assets (risk-on) or seeking safe-havens (risk-off) – with risk-on being CAD-positive. As its largest trading partner, the health of the US economy is also a key factor influencing the Canadian Dollar.
The Bank of Canada (BoC) has a significant influence on the Canadian Dollar by setting the level of interest rates that banks can lend to one another. This influences the level of interest rates for everyone. The main goal of the BoC is to maintain inflation at 1-3% by adjusting interest rates up or down. Relatively higher interest rates tend to be positive for the CAD. The Bank of Canada can also use quantitative easing and tightening to influence credit conditions, with the former CAD-negative and the latter CAD-positive.
The price of Oil is a key factor impacting the value of the Canadian Dollar. Petroleum is Canada’s biggest export, so Oil price tends to have an immediate impact on the CAD value. Generally, if Oil price rises CAD also goes up, as aggregate demand for the currency increases. The opposite is the case if the price of Oil falls. Higher Oil prices also tend to result in a greater likelihood of a positive Trade Balance, which is also supportive of the CAD.
While inflation had always traditionally been thought of as a negative factor for a currency since it lowers the value of money, the opposite has actually been the case in modern times with the relaxation of cross-border capital controls. Higher inflation tends to lead central banks to put up interest rates which attracts more capital inflows from global investors seeking a lucrative place to keep their money. This increases demand for the local currency, which in Canada’s case is the Canadian Dollar.
Macroeconomic data releases gauge the health of the economy and can have an impact on the Canadian Dollar. Indicators such as GDP, Manufacturing and Services PMIs, employment, and consumer sentiment surveys can all influence the direction of the CAD. A strong economy is good for the Canadian Dollar. Not only does it attract more foreign investment but it may encourage the Bank of Canada to put up interest rates, leading to a stronger currency. If economic data is weak, however, the CAD is likely to fall.
European Central Bank (ECB) Chief Economist Philip Lane said on Tuesday that “June inflation data seems in line with our assessment.”
Further comments
Services inflation remains essential.
Need to take a little bit of time to assess inflation.
Here is what you need to know on Tuesday, July 2:
Following Monday's choppy action, major currency pairs seem to have stabilized early Tuesday. Eurostat will release Harmonized Index of Consumer Prices for June in the European session. Later in the day, European Central Bank (ECB) President Christine Lagarde and Federal Reserve (Fed) Chairman Jerome Powell will speak on the policy outlook at the ECB Forum on Central Banking in Sintra. The US economic calendar will also feature JOLTS Job Openings data for May.
The US Dollar (USD) started the week on a weak note but managed to stage a rebound later in the American session. Despite the disappointing ISM Manufacturing PMI data for June, the USD benefited from rising US Treasury bond yields and the USD Index closed the day virtually unchanged. In the European morning on Tuesday, the index stays in a consolidation phase slightly below 106.00 and the benchmark 10-year US Treasury bond yield holds steady at around 4.45%. Meanwhile, US stock index futures trade marginally lower on the day.
US Dollar PRICE This week
The table below shows the percentage change of US Dollar (USD) against listed major currencies this week. US Dollar was the strongest against the New Zealand Dollar.
| USD | EUR | GBP | JPY | CAD | AUD | NZD | CHF | |
|---|---|---|---|---|---|---|---|---|
| USD | -0.13% | 0.10% | 0.58% | 0.53% | 0.45% | 0.74% | 0.64% | |
| EUR | 0.13% | 0.00% | 0.42% | 0.35% | 0.47% | 0.56% | 0.46% | |
| GBP | -0.10% | -0.00% | 0.39% | 0.35% | 0.47% | 0.56% | 0.46% | |
| JPY | -0.58% | -0.42% | -0.39% | -0.06% | -0.07% | 0.15% | 0.08% | |
| CAD | -0.53% | -0.35% | -0.35% | 0.06% | -0.03% | 0.21% | 0.11% | |
| AUD | -0.45% | -0.47% | -0.47% | 0.07% | 0.03% | 0.09% | 0.05% | |
| NZD | -0.74% | -0.56% | -0.56% | -0.15% | -0.21% | -0.09% | -0.08% | |
| CHF | -0.64% | -0.46% | -0.46% | -0.08% | -0.11% | -0.05% | 0.08% |
The heat map shows percentage changes of major currencies against each other. The base currency is picked from the left column, while the quote currency is picked from the top row. For example, if you pick the US Dollar from the left column and move along the horizontal line to the Japanese Yen, the percentage change displayed in the box will represent USD (base)/JPY (quote).
Earlier in the day, the Minutes of the Reserve Bank of Australia’s (RBA) June monetary policy meeting showed that policymakers thought that another rate hike might be needed if they judged that the policy was not sufficiently restrictive. The publication further noted that the board saw the case for holding rates steady was stronger than for hiking. After closing in negative territory on Monday, AUD/USD continued to stretch lower during the Asian trading hours on Tuesday and the pair was last seen trading below 0.6650.
USD/JPY closed the first trading day of the week little changed as investors refrained from taking large positions. The pair trades marginally higher on the day above 161.50 in the European morning on Tuesday.
After spiking above 1.2700 in the American session on Monday, GBP/USD reversed its direction and erased its daily gains to close at 1.2650. The pair struggles to regain its traction and trades below this level to start the European session.
EUR/USD opened with a bullish gap on Monday and touched its highest level in nearly three weeks above 1.0770. The pair, however, lost its bullish momentum in the American session and finished the day with small gains. Early Tuesday, EUR/USD stays below 1.0750.
Gold failed to make a decisive move in either direction on Monday. XAU/USD extends its sideways grind at around $2,330 during the European trading hours on Tuesday.
Central banks FAQs
Central Banks have a key mandate which is making sure that there is price stability in a country or region. Economies are constantly facing inflation or deflation when prices for certain goods and services are fluctuating. Constant rising prices for the same goods means inflation, constant lowered prices for the same goods means deflation. It is the task of the central bank to keep the demand in line by tweaking its policy rate. For the biggest central banks like the US Federal Reserve (Fed), the European Central Bank (ECB) or the Bank of England (BoE), the mandate is to keep inflation close to 2%.
A central bank has one important tool at its disposal to get inflation higher or lower, and that is by tweaking its benchmark policy rate, commonly known as interest rate. On pre-communicated moments, the central bank will issue a statement with its policy rate and provide additional reasoning on why it is either remaining or changing (cutting or hiking) it. Local banks will adjust their savings and lending rates accordingly, which in turn will make it either harder or easier for people to earn on their savings or for companies to take out loans and make investments in their businesses. When the central bank hikes interest rates substantially, this is called monetary tightening. When it is cutting its benchmark rate, it is called monetary easing.
A central bank is often politically independent. Members of the central bank policy board are passing through a series of panels and hearings before being appointed to a policy board seat. Each member in that board often has a certain conviction on how the central bank should control inflation and the subsequent monetary policy. Members that want a very loose monetary policy, with low rates and cheap lending, to boost the economy substantially while being content to see inflation slightly above 2%, are called ‘doves’. Members that rather want to see higher rates to reward savings and want to keep a lit on inflation at all time are called ‘hawks’ and will not rest until inflation is at or just below 2%.
Normally, there is a chairman or president who leads each meeting, needs to create a consensus between the hawks or doves and has his or her final say when it would come down to a vote split to avoid a 50-50 tie on whether the current policy should be adjusted. The chairman will deliver speeches which often can be followed live, where the current monetary stance and outlook is being communicated. A central bank will try to push forward its monetary policy without triggering violent swings in rates, equities, or its currency. All members of the central bank will channel their stance toward the markets in advance of a policy meeting event. A few days before a policy meeting takes place until the new policy has been communicated, members are forbidden to talk publicly. This is called the blackout period.
- EUR/GBP gains momentum near 0.8490 in Tuesday’s early European session.
- The Euro gains ground after results from the first round of French elections.
- Traders will keep an eye on the UK Parliamentary elections on Thursday.
The EUR/GBP cross trades in positive territory for the fifth consecutive day around 0.8490 during the early European session on Tuesday. The Euro (EUR) edges higher after results from the first round of French elections suggested the far right would beat President Emmanuel Macron but fall short of winning an outright majority in parliament. Investors will closely watch the preliminary Eurozone Harmonized Index of Consumer Prices (HICP) data for June, which is due on Tuesday.
Marine Le Pen’s far-right National Rally (RN) party won 33.15% in the first round of France’s parliamentary elections on Sunday, according to final results published Monday by France’s Interior Ministry. Meanwhile, French President Emmanuel Macron’s centrist alliance suffered staggering losses, coming third with 20.76% of the vote. The left-wing coalition of the New Popular Front (NFP) made a strong showing with 27.99% of the vote.
However, the RN might fall short of the 289 seats needed for an absolute majority, which lifts the shared currency against the Pound Sterling (GBP). BBVA's chief strategist Alejandro Cuadrado commented "In the event of Marine Le Pen's National Rally (RN) winning an absolute majority, the EUR could face additional short-term headwinds.”
On the other hand, the GBP weakens as investors remain uncertain about the timeline that the Bank of England (BoE) will start cutting interest rates. Also, market players turn cautious ahead of the UK elections outcome on Thursday. The opposition Labor Party is expected to win from UK Prime Minister Rishi Sunak-led Conservative Party, according to the latest exit polls.
Euro FAQs
The Euro is the currency for the 20 European Union countries that belong to the Eurozone. It is the second most heavily traded currency in the world behind the US Dollar. In 2022, it accounted for 31% of all foreign exchange transactions, with an average daily turnover of over $2.2 trillion a day. EUR/USD is the most heavily traded currency pair in the world, accounting for an estimated 30% off all transactions, followed by EUR/JPY (4%), EUR/GBP (3%) and EUR/AUD (2%).
The European Central Bank (ECB) in Frankfurt, Germany, is the reserve bank for the Eurozone. The ECB sets interest rates and manages monetary policy. The ECB’s primary mandate is to maintain price stability, which means either controlling inflation or stimulating growth. Its primary tool is the raising or lowering of interest rates. Relatively high interest rates – or the expectation of higher rates – will usually benefit the Euro and vice versa. The ECB Governing Council makes monetary policy decisions at meetings held eight times a year. Decisions are made by heads of the Eurozone national banks and six permanent members, including the President of the ECB, Christine Lagarde.
Eurozone inflation data, measured by the Harmonized Index of Consumer Prices (HICP), is an important econometric for the Euro. If inflation rises more than expected, especially if above the ECB’s 2% target, it obliges the ECB to raise interest rates to bring it back under control. Relatively high interest rates compared to its counterparts will usually benefit the Euro, as it makes the region more attractive as a place for global investors to park their money.
Data releases gauge the health of the economy and can impact on the Euro. Indicators such as GDP, Manufacturing and Services PMIs, employment, and consumer sentiment surveys can all influence the direction of the single currency. A strong economy is good for the Euro. Not only does it attract more foreign investment but it may encourage the ECB to put up interest rates, which will directly strengthen the Euro. Otherwise, if economic data is weak, the Euro is likely to fall. Economic data for the four largest economies in the euro area (Germany, France, Italy and Spain) are especially significant, as they account for 75% of the Eurozone’s economy.
Another significant data release for the Euro is the Trade Balance. This indicator measures the difference between what a country earns from its exports and what it spends on imports over a given period. If a country produces highly sought after exports then its currency will gain in value purely from the extra demand created from foreign buyers seeking to purchase these goods. Therefore, a positive net Trade Balance strengthens a currency and vice versa for a negative balance.
Gold prices remained broadly unchanged in India on Tuesday, according to data compiled by FXStreet.
The price for Gold stood at 6,258.07 Indian Rupees (INR) per gram, broadly stable compared with the INR 6,261.56 it cost on Monday.
The price for Gold was broadly steady at INR 72,992.90 per tola from INR 73,033.62 per tola a day earlier.
| Unit measure | Gold Price in INR |
|---|---|
| 1 Gram | 6,258.07 |
| 10 Grams | 62,580.70 |
| Tola | 72,992.90 |
| Troy Ounce | 194,647.90 |
FXStreet calculates Gold prices in India by adapting international prices (USD/INR) to the local currency and measurement units. Prices are updated daily based on the market rates taken at the time of publication. Prices are just for reference and local rates could diverge slightly.
Gold FAQs
Gold has played a key role in human’s history as it has been widely used as a store of value and medium of exchange. Currently, apart from its shine and usage for jewelry, the precious metal is widely seen as a safe-haven asset, meaning that it is considered a good investment during turbulent times. Gold is also widely seen as a hedge against inflation and against depreciating currencies as it doesn’t rely on any specific issuer or government.
Central banks are the biggest Gold holders. In their aim to support their currencies in turbulent times, central banks tend to diversify their reserves and buy Gold to improve the perceived strength of the economy and the currency. High Gold reserves can be a source of trust for a country’s solvency. Central banks added 1,136 tonnes of Gold worth around $70 billion to their reserves in 2022, according to data from the World Gold Council. This is the highest yearly purchase since records began. Central banks from emerging economies such as China, India and Turkey are quickly increasing their Gold reserves.
Gold has an inverse correlation with the US Dollar and US Treasuries, which are both major reserve and safe-haven assets. When the Dollar depreciates, Gold tends to rise, enabling investors and central banks to diversify their assets in turbulent times. Gold is also inversely correlated with risk assets. A rally in the stock market tends to weaken Gold price, while sell-offs in riskier markets tend to favor the precious metal.
The price can move due to a wide range of factors. Geopolitical instability or fears of a deep recession can quickly make Gold price escalate due to its safe-haven status. As a yield-less asset, Gold tends to rise with lower interest rates, while higher cost of money usually weighs down on the yellow metal. Still, most moves depend on how the US Dollar (USD) behaves as the asset is priced in dollars (XAU/USD). A strong Dollar tends to keep the price of Gold controlled, whereas a weaker Dollar is likely to push Gold prices up.
(An automation tool was used in creating this post.)
FX option expiries for July 2 NY cut at 10:00 Eastern Time, via DTCC, can be found below
- EUR/USD: EUR amounts
- 1.0600 932m
- 1.0700 861m
- AUD/USD: AUD amounts
- 0.6700 541m
- USD/CAD: USD amounts
- 1.3630 592m
- 1.3635 580m
European Central Bank (ECB) policymaker Pierre Wunsch said in a Reuters interview that “barring major negative surprises, ECB has room for a second rate cut.”
Additional quotes
"A small deviation from the projections would not change this view dramatically."
“Subsequent moves should only come once ECB has confidence that inflation is moving towards 2%.”
Market reaction
As of writing, EUR/USD is losing 0.09% on the day to trade near 1.0730, awaiting the Eurozone preliminary inflation readings for a fresh impetus.
ECB FAQs
The European Central Bank (ECB) in Frankfurt, Germany, is the reserve bank for the Eurozone. The ECB sets interest rates and manages monetary policy for the region. The ECB primary mandate is to maintain price stability, which means keeping inflation at around 2%. Its primary tool for achieving this is by raising or lowering interest rates. Relatively high interest rates will usually result in a stronger Euro and vice versa. The ECB Governing Council makes monetary policy decisions at meetings held eight times a year. Decisions are made by heads of the Eurozone national banks and six permanent members, including the President of the ECB, Christine Lagarde.
In extreme situations, the European Central Bank can enact a policy tool called Quantitative Easing. QE is the process by which the ECB prints Euros and uses them to buy assets – usually government or corporate bonds – from banks and other financial institutions. QE usually results in a weaker Euro. QE is a last resort when simply lowering interest rates is unlikely to achieve the objective of price stability. The ECB used it during the Great Financial Crisis in 2009-11, in 2015 when inflation remained stubbornly low, as well as during the covid pandemic.
Quantitative tightening (QT) is the reverse of QE. It is undertaken after QE when an economic recovery is underway and inflation starts rising. Whilst in QE the European Central Bank (ECB) purchases government and corporate bonds from financial institutions to provide them with liquidity, in QT the ECB stops buying more bonds, and stops reinvesting the principal maturing on the bonds it already holds. It is usually positive (or bullish) for the Euro.
- NZD/USD meets with a fresh supply on Tuesday amid some follow-through USD buying.
- Bets for an early RBNZ rate cut and China’s economic woes contribute to the downfall.
- Traders now look forward to Fed Chair Jerome Powell’s speech for short-term impetus.
The NZD/USD pair comes under some renewed selling pressure during the Asian session on Tuesday and momentarily slides below mid-0.6000s for the first time since mid-May. Spot prices now seem to have confirmed a breakdown through the 50-day Simple Moving Average (SMA) and seem vulnerable to prolong a three-week-old downtrend amid some follow-through US Dollar (USD) buying.
Concerns that a Trump presidency would be more inflationary than a Biden administration pushed the yield on the benchmark 10-year government bond to its highest level in a month on Monday. This, in turn, assists the USD to build on the overnight solid rebound from a multi-day low. The New Zealand Dollar (NZD), on the other hand, is weighed down by expectations that the Reserve Bank of New Zealand (RBNZ) will cut rates earlier than projected.
Apart from this, China's economic woes further contribute to driving flows away from antipodean currencies, including the Kiwi. The USD bulls, meanwhile, might hold back from placing aggressive bets and prefer to wait for more cues about the Federal Reserve's (Fed) further policy decisions amid rising bets for an imminent start of the rate-cutting cycle in September. Hence, the focus will remain glued to Fed Chair Jerome Powell's speech later today.
Apart from this, Tuesday's US economic docket – featuring JOLTS Job Openings data – might influence the USD price dynamics and provide some impetus to the NZD/USD pair. The focus will then shift to the FOMC meeting minutes on Wednesday and the release of the closely-watched US monthly employment details – popularly known as the Nonfarm Payrolls (NFP) report – on Friday. This, in turn, will determine the near-term trajectory for the buck and the currency pair.
Fed FAQs
Monetary policy in the US is shaped by the Federal Reserve (Fed). The Fed has two mandates: to achieve price stability and foster full employment. Its primary tool to achieve these goals is by adjusting interest rates. When prices are rising too quickly and inflation is above the Fed’s 2% target, it raises interest rates, increasing borrowing costs throughout the economy. This results in a stronger US Dollar (USD) as it makes the US a more attractive place for international investors to park their money. When inflation falls below 2% or the Unemployment Rate is too high, the Fed may lower interest rates to encourage borrowing, which weighs on the Greenback.
The Federal Reserve (Fed) holds eight policy meetings a year, where the Federal Open Market Committee (FOMC) assesses economic conditions and makes monetary policy decisions. The FOMC is attended by twelve Fed officials – the seven members of the Board of Governors, the president of the Federal Reserve Bank of New York, and four of the remaining eleven regional Reserve Bank presidents, who serve one-year terms on a rotating basis.
In extreme situations, the Federal Reserve may resort to a policy named Quantitative Easing (QE). QE is the process by which the Fed substantially increases the flow of credit in a stuck financial system. It is a non-standard policy measure used during crises or when inflation is extremely low. It was the Fed’s weapon of choice during the Great Financial Crisis in 2008. It involves the Fed printing more Dollars and using them to buy high grade bonds from financial institutions. QE usually weakens the US Dollar.
Quantitative tightening (QT) is the reverse process of QE, whereby the Federal Reserve stops buying bonds from financial institutions and does not reinvest the principal from the bonds it holds maturing, to purchase new bonds. It is usually positive for the value of the US Dollar.
- USD/CHF jumps to the highest level since May 31 around 0.9040 in Tuesday’s early European session.
- Recent US ISM PMI data showed a contraction in US manufacturing sector activity for June.
- The safe-haven flows amid political uncertainty and Middle East geopolitical tensions might underpin the CHF.
The USD/CHF pair gains traction near 0.9040, the highest level since May 31 during the early European session on Tuesday. The strength of the Greenback and higher US bond yields provide some support for the pair. Investors await the speech by Federal Reserve (Fed) Chairman Jerome Powell on Tuesday for fresh impetus.
The recent weaker-than-expected US economic data triggered the expectations that the US Federal Reserve (Fed) will cut interest rates in September and December. The US Manufacturing Purchasing Managers Index (PMI) came in below the market consensus, dropping to 48.5 from 48.7 in May, the Institute for Supply Management (ISM) revealed on Monday. Traders have priced in nearly 59.5% odds of 25 basis points (bps) of a Fed rate cut in September, up from 58.2% last Friday, according to the CME FedWatch Tool.
However, the Fed's cautious stance continues to lend strength to the Greenback and US Treasury yields. San Francisco Fed President Mary Daly emphasized on Friday that "If inflation stays sticky or comes down slowly, rates would need to be higher for longer.”
On the Swiss front, market players will keep an eye on the Swiss Consumer Price Index (CPI) data for June, which is due on Thursday. This report could offer some hints about the rate-cutting cycle from the SNB in the September meeting. Apart from this, the political uncertainty and geopolitical tensions in the Middle East might boost safe haven assets like the Swiss Franc (CHF). This, in turn, might cap the upside for the pair.
SNB FAQs
The Swiss National Bank (SNB) is the country’s central bank. As an independent central bank, its mandate is to ensure price stability in the medium and long term. To ensure price stability, the SNB aims to maintain appropriate monetary conditions, which are determined by the interest rate level and exchange rates. For the SNB, price stability means a rise in the Swiss Consumer Price Index (CPI) of less than 2% per year.
The Swiss National Bank (SNB) Governing Board decides the appropriate level of its policy rate according to its price stability objective. When inflation is above target or forecasted to be above target in the foreseeable future, the bank will attempt to tame excessive price growth by raising its policy rate. Higher interest rates are generally positive for the Swiss Franc (CHF) as they lead to higher yields, making the country a more attractive place for investors. On the contrary, lower interest rates tend to weaken CHF.
Yes. The Swiss National Bank (SNB) has regularly intervened in the foreign exchange market in order to avoid the Swiss Franc (CHF) appreciating too much against other currencies. A strong CHF hurts the competitiveness of the country’s powerful export sector. Between 2011 and 2015, the SNB implemented a peg to the Euro to limit the CHF advance against it. The bank intervenes in the market using its hefty foreign exchange reserves, usually by buying foreign currencies such as the US Dollar or the Euro. During episodes of high inflation, particularly due to energy, the SNB refrains from intervening markets as a strong CHF makes energy imports cheaper, cushioning the price shock for Swiss households and businesses.
The SNB meets once a quarter – in March, June, September and December – to conduct its monetary policy assessment. Each of these assessments results in a monetary policy decision and the publication of a medium-term inflation forecast.
- EUR/USD may test the lower level of the range at 1.0670.
- The 14-day RSI suggests the confirmation of the bearish bias for the pair.
- The pair could find an immediate barrier at the 50-day EMA at 1.0769.
EUR/USD halts its three-day winning streak, trading around 1.0730 during the Asian hours on Monday. A technical analysis of the daily chart indicates a bearish bias, with the pair consolidating within a descending channel.
The 14-day Relative Strength Index (RSI) remains slightly below the 50 level, suggesting the EUR/USD pair trading within a consolidative range between 1.0780-1.0670. If the RSI improves to the 50 level, it would weaken the bearish momentum for the pair and help to break above the range.
The EUR/USD pair may test the lower level of the range at 1.0670, which also acts as a throwback support. A break below this level would reinforce the bearish bias, potentially pushing the pair toward the lower boundary of the descending channel near 1.0610.
On the upside, the EUR/USD pair may encounter resistance at the 50-day Exponential Moving Average (EMA) situated at 1.0769. Beyond that, there is a convergence of resistance factors: the upper level of the range and the upper boundary of the descending channel, both around the level of 1.0780.
EUR/USD: Daily Chart
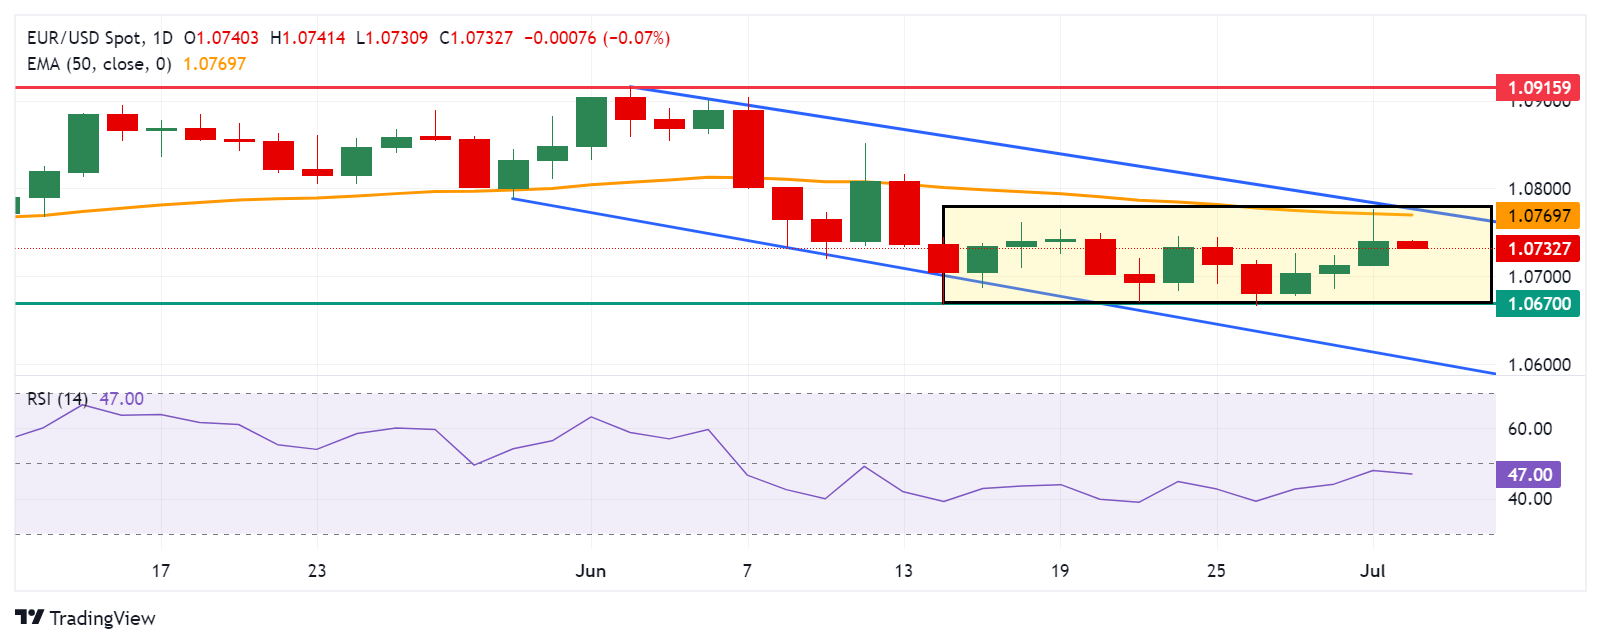
Euro FAQs
The Euro is the currency for the 20 European Union countries that belong to the Eurozone. It is the second most heavily traded currency in the world behind the US Dollar. In 2022, it accounted for 31% of all foreign exchange transactions, with an average daily turnover of over $2.2 trillion a day. EUR/USD is the most heavily traded currency pair in the world, accounting for an estimated 30% off all transactions, followed by EUR/JPY (4%), EUR/GBP (3%) and EUR/AUD (2%).
The European Central Bank (ECB) in Frankfurt, Germany, is the reserve bank for the Eurozone. The ECB sets interest rates and manages monetary policy. The ECB’s primary mandate is to maintain price stability, which means either controlling inflation or stimulating growth. Its primary tool is the raising or lowering of interest rates. Relatively high interest rates – or the expectation of higher rates – will usually benefit the Euro and vice versa. The ECB Governing Council makes monetary policy decisions at meetings held eight times a year. Decisions are made by heads of the Eurozone national banks and six permanent members, including the President of the ECB, Christine Lagarde.
Eurozone inflation data, measured by the Harmonized Index of Consumer Prices (HICP), is an important econometric for the Euro. If inflation rises more than expected, especially if above the ECB’s 2% target, it obliges the ECB to raise interest rates to bring it back under control. Relatively high interest rates compared to its counterparts will usually benefit the Euro, as it makes the region more attractive as a place for global investors to park their money.
Data releases gauge the health of the economy and can impact on the Euro. Indicators such as GDP, Manufacturing and Services PMIs, employment, and consumer sentiment surveys can all influence the direction of the single currency. A strong economy is good for the Euro. Not only does it attract more foreign investment but it may encourage the ECB to put up interest rates, which will directly strengthen the Euro. Otherwise, if economic data is weak, the Euro is likely to fall. Economic data for the four largest economies in the euro area (Germany, France, Italy and Spain) are especially significant, as they account for 75% of the Eurozone’s economy.
Another significant data release for the Euro is the Trade Balance. This indicator measures the difference between what a country earns from its exports and what it spends on imports over a given period. If a country produces highly sought after exports then its currency will gain in value purely from the extra demand created from foreign buyers seeking to purchase these goods. Therefore, a positive net Trade Balance strengthens a currency and vice versa for a negative balance.
- Silver drifts lower during the Asian session on Tuesday and snaps a three-day winning streak.
- The mixed technical setup warrants some caution before placing aggressive directional bets.
- A sustained strength beyond the $30.00 mark is needed to negate any near-term negative bias.
Silver (XAG/USD) struggles to capitalize on its modest gains registered over the past three days and attracts some sellers during the Asian session on Tuesday. The white metal currently trades around the $29.35-$29.30 area, down 0.45% for the day, and for now, seems to have stalled the recent recovery from its lowest level since mid-May touched last Wednesday.
From a technical perspective, last week's breakdown through the 50-day Simple Moving Average (SMA) was seen as a fresh trigger for bearish traders. That said, the subsequent bounce from the 61.8% Fibonacci retracement level of the $26.02-$32.51 rally and neutral oscillators on the daily chart warrant some caution before positioning for further losses.
In the meantime, the $29.55-$29.60 area is likely to act as an immediate hurdle ahead of the 38.2% Fibo. level, around the $30.00 psychological mark. A sustained strength beyond the latter will negate any near-term negative bias and lift the XAG/USD to the $31.00 neighborhood with some intermediate resistance near the $30.30-$30.35 supply zone.
On the flip side, the $29.00 round figure is likely to protect the immediate downside ahead of the $28.60-$28.55 region, or the 61.8% Fibo. level. A convincing break below has the potential to drag the XAG/USD towards the $28.00 mark. The downfall could extend further towards the $27.40-$27.30 confluence – comprising 78.6% Fibo. and the 100-day SMA.
Silver daily chart
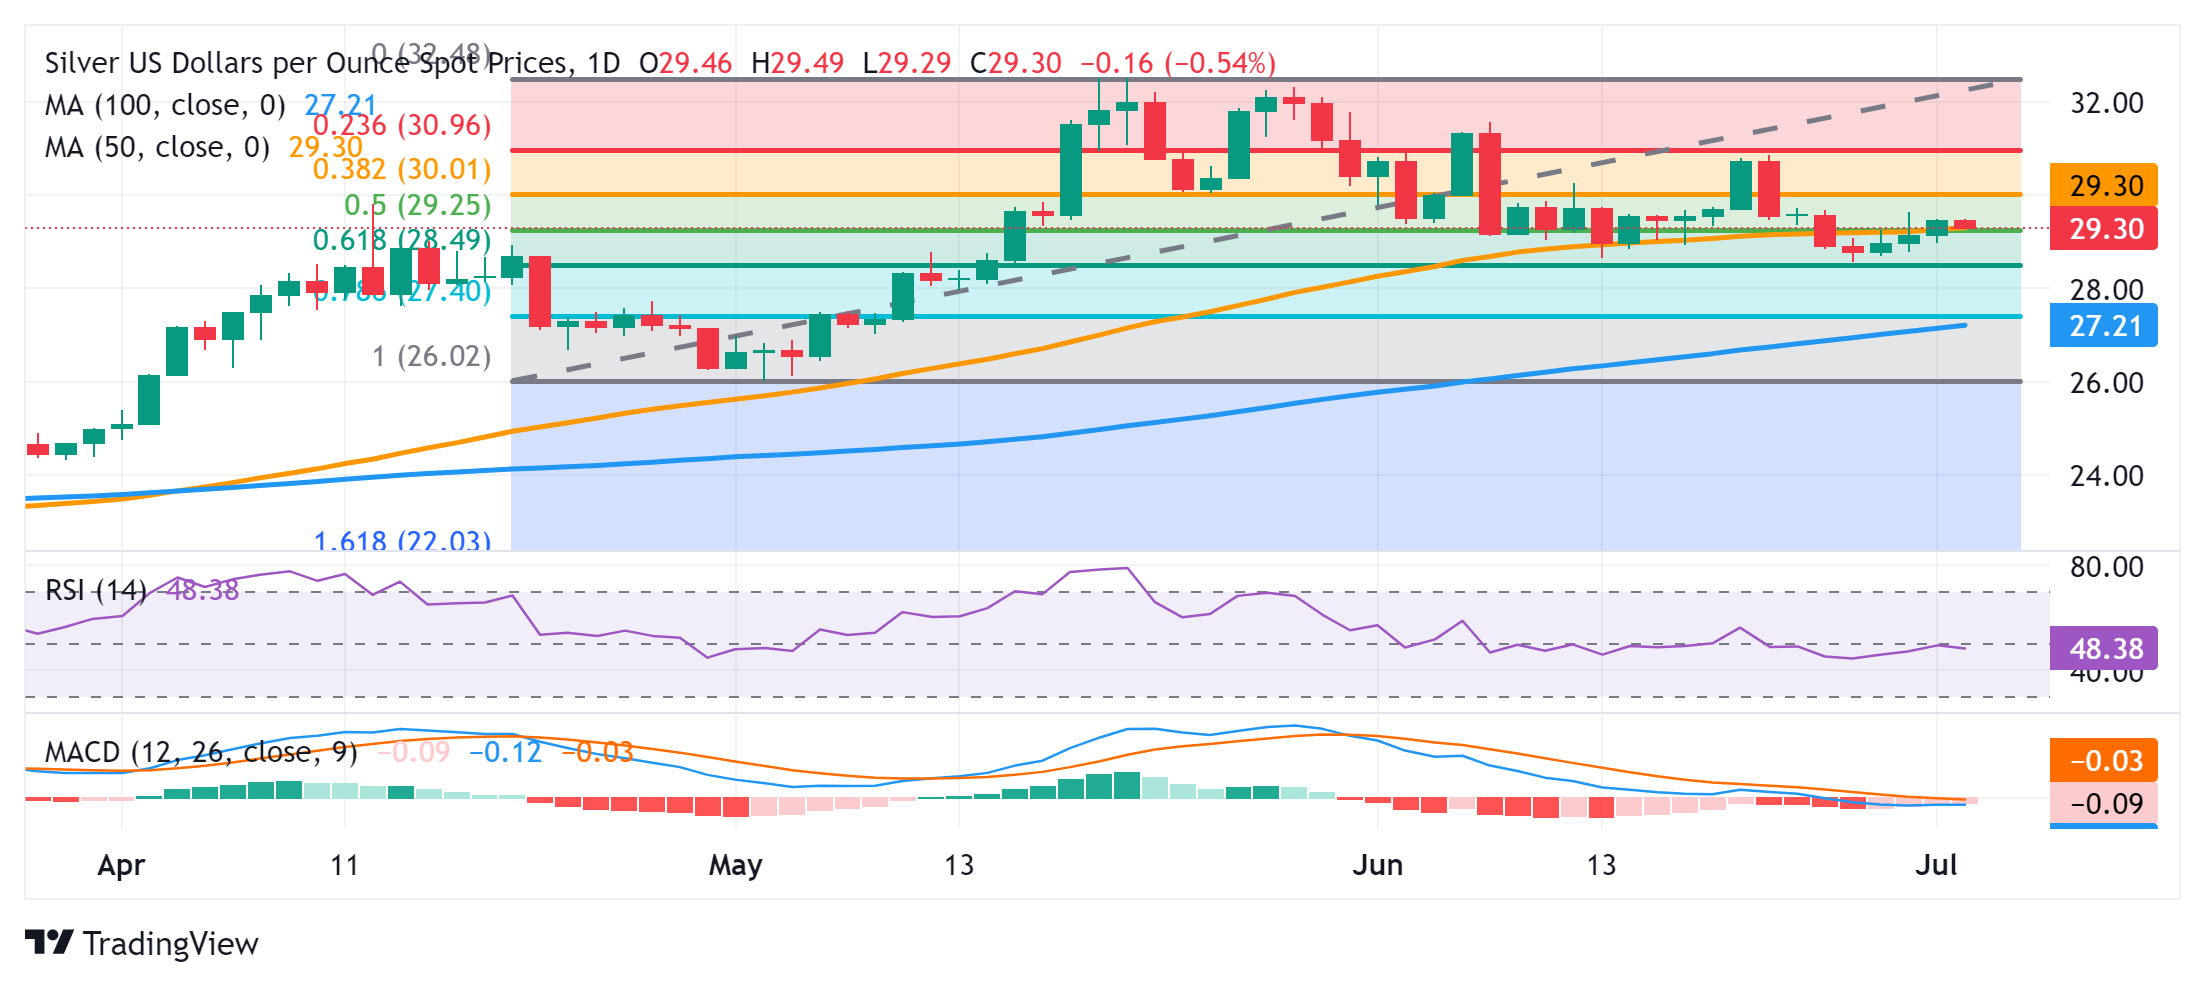
Silver FAQs
Silver is a precious metal highly traded among investors. It has been historically used as a store of value and a medium of exchange. Although less popular than Gold, traders may turn to Silver to diversify their investment portfolio, for its intrinsic value or as a potential hedge during high-inflation periods. Investors can buy physical Silver, in coins or in bars, or trade it through vehicles such as Exchange Traded Funds, which track its price on international markets.
Silver prices can move due to a wide range of factors. Geopolitical instability or fears of a deep recession can make Silver price escalate due to its safe-haven status, although to a lesser extent than Gold's. As a yieldless asset, Silver tends to rise with lower interest rates. Its moves also depend on how the US Dollar (USD) behaves as the asset is priced in dollars (XAG/USD). A strong Dollar tends to keep the price of Silver at bay, whereas a weaker Dollar is likely to propel prices up. Other factors such as investment demand, mining supply – Silver is much more abundant than Gold – and recycling rates can also affect prices.
Silver is widely used in industry, particularly in sectors such as electronics or solar energy, as it has one of the highest electric conductivity of all metals – more than Copper and Gold. A surge in demand can increase prices, while a decline tends to lower them. Dynamics in the US, Chinese and Indian economies can also contribute to price swings: for the US and particularly China, their big industrial sectors use Silver in various processes; in India, consumers’ demand for the precious metal for jewellery also plays a key role in setting prices.
Silver prices tend to follow Gold's moves. When Gold prices rise, Silver typically follows suit, as their status as safe-haven assets is similar. The Gold/Silver ratio, which shows the number of ounces of Silver needed to equal the value of one ounce of Gold, may help to determine the relative valuation between both metals. Some investors may consider a high ratio as an indicator that Silver is undervalued, or Gold is overvalued. On the contrary, a low ratio might suggest that Gold is undervalued relative to Silver.
- AUD/JPY pulls back from its highest level since 2007 touched on Monday.
- The less hawkish RBA minutes prompts bulls to take profits off the table.
- The technical setup makes it prudent to wait for a near-term consolidation.
The AUD/JPY cross drifts lower during the Asian session on Tuesday and moves away from its highest level since 2007, around the 107.80-107.85 region touched the previous day. Spot prices currently trade around the 107.25 region, though any meaningful corrective decline still seems elusive.
The Australian Dollar (AUD) is pressured by the less hawkish Reserve Bank of Australia (RBA) meeting minutes, which pointed to the risk of a sharp slowdown in the labour market. Apart from this, China's economic woes further undermine the China-proxy Aussie and exert downward pressure on the AUD/JPY cross. Meanwhile, the Bank of Japan (BoJ), so far, has failed to provide any cues about the timing of the next rate increase, which continues to weigh on the Japanese Yen (JPY) and should lend some support to spot prices.
From a technical perspective, the intraday downtick could be solely attributed to some profit-taking amid extremely overbought oscillators on the daily chart. Any subsequent decline, however, is likely to find decent support and attract fresh buyers near the 107.00 round-figure mark. This, in turn, could limit the downside for the AUD/JPY cross near the 106.60 support, which now seems to act as a pivotal point. A convincing break below the latter might prompt some long-unwinding trade and drag spot prices to the 106.00 mark.
On the flip side, the 107.80-107.85 region, or the multi-year peak touched on Monday, now seems to act as an immediate hurdle ahead of the 108.00 mark. Some follow-through buying will be seen as a fresh trigger for bullish traders and pave the way for an extension of the recent strong move-up witnessed over the past two months or so. That said, the technical setup makes it prudent to wait for some near-term consolidation or some meaningful corrective decline before positioning for any further near-term appreciating move.
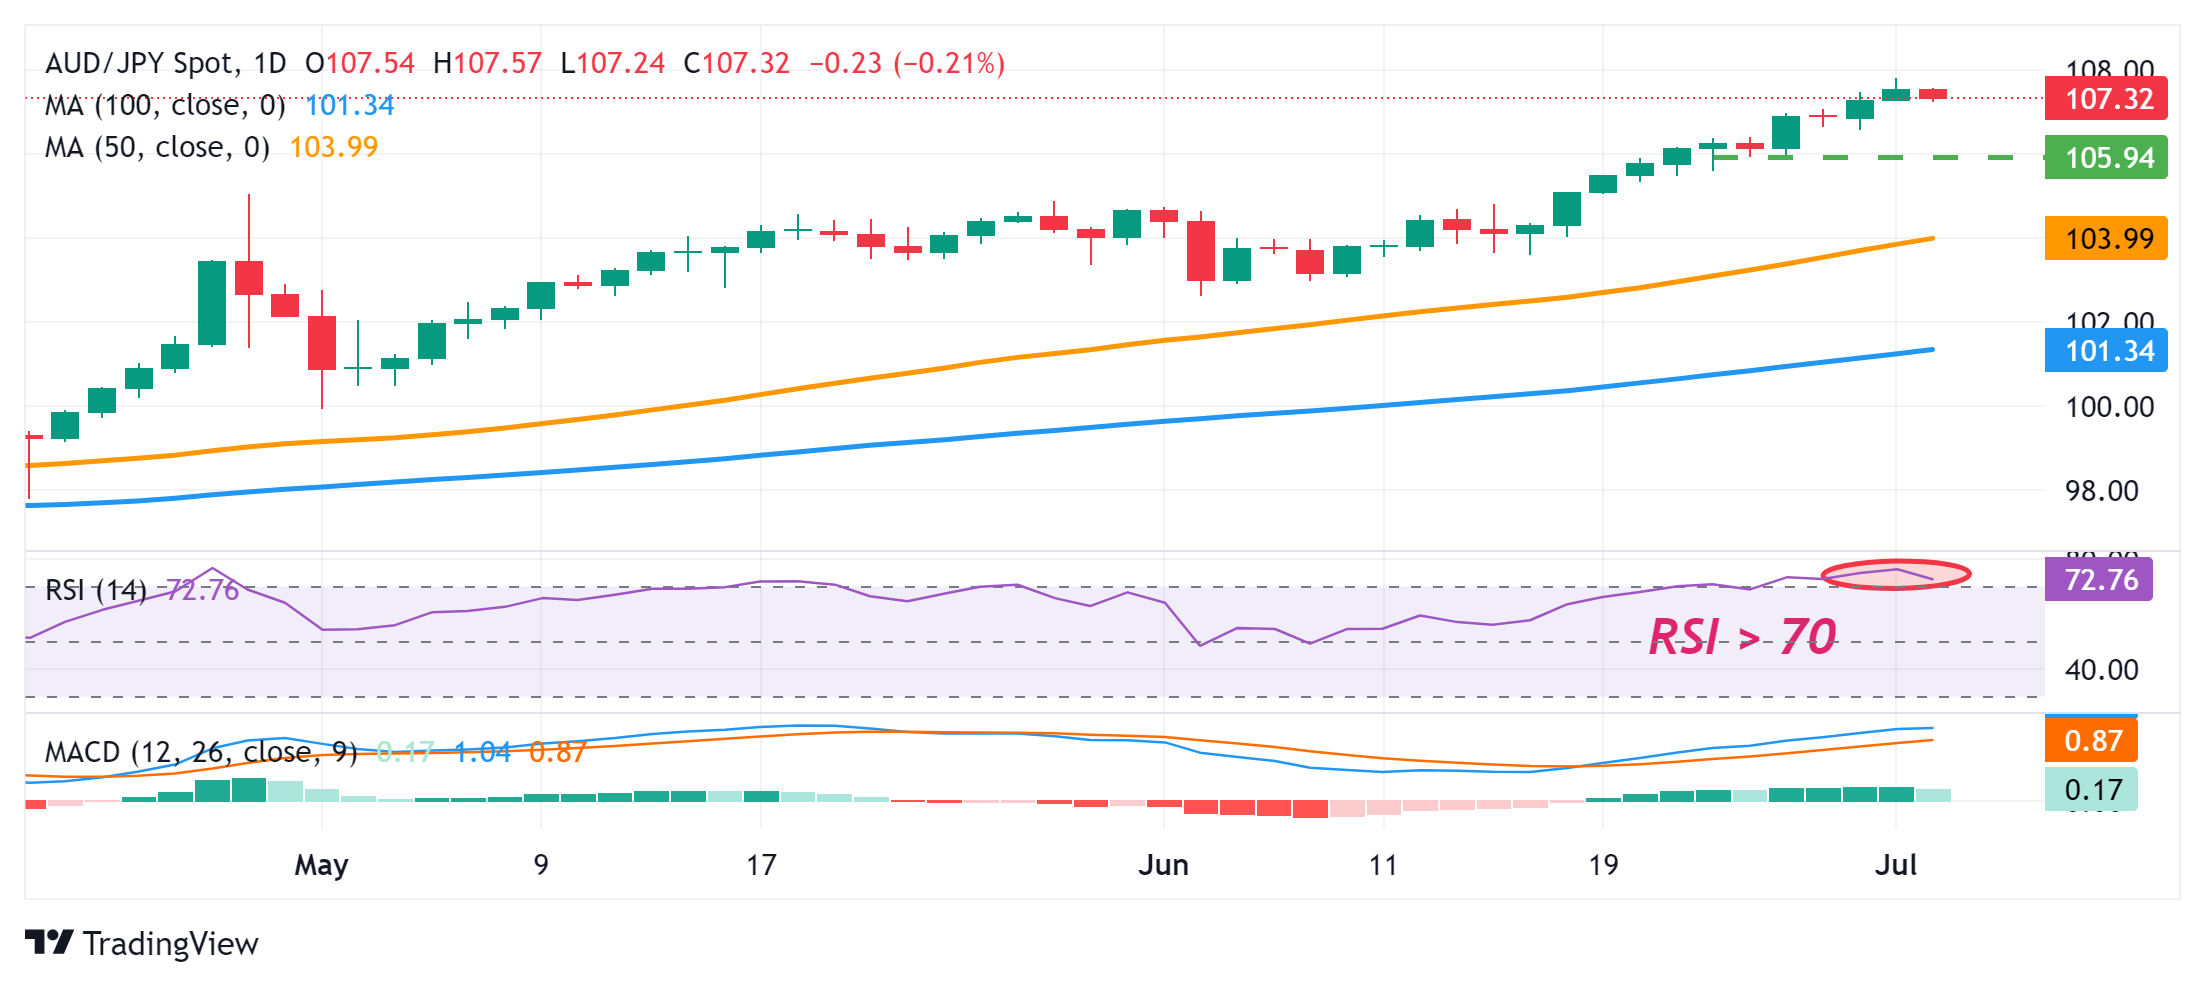
RBA FAQs
The Reserve Bank of Australia (RBA) sets interest rates and manages monetary policy for Australia. Decisions are made by a board of governors at 11 meetings a year and ad hoc emergency meetings as required. The RBA’s primary mandate is to maintain price stability, which means an inflation rate of 2-3%, but also “..to contribute to the stability of the currency, full employment, and the economic prosperity and welfare of the Australian people.” Its main tool for achieving this is by raising or lowering interest rates. Relatively high interest rates will strengthen the Australian Dollar (AUD) and vice versa. Other RBA tools include quantitative easing and tightening.
While inflation had always traditionally been thought of as a negative factor for currencies since it lowers the value of money in general, the opposite has actually been the case in modern times with the relaxation of cross-border capital controls. Moderately higher inflation now tends to lead central banks to put up their interest rates, which in turn has the effect of attracting more capital inflows from global investors seeking a lucrative place to keep their money. This increases demand for the local currency, which in the case of Australia is the Aussie Dollar.
Macroeconomic data gauges the health of an economy and can have an impact on the value of its currency. Investors prefer to invest their capital in economies that are safe and growing rather than precarious and shrinking. Greater capital inflows increase the aggregate demand and value of the domestic currency. Classic indicators, such as GDP, Manufacturing and Services PMIs, employment, and consumer sentiment surveys can influence AUD. A strong economy may encourage the Reserve Bank of Australia to put up interest rates, also supporting AUD.
Quantitative Easing (QE) is a tool used in extreme situations when lowering interest rates is not enough to restore the flow of credit in the economy. QE is the process by which the Reserve Bank of Australia (RBA) prints Australian Dollars (AUD) for the purpose of buying assets – usually government or corporate bonds – from financial institutions, thereby providing them with much-needed liquidity. QE usually results in a weaker AUD.
Quantitative tightening (QT) is the reverse of QE. It is undertaken after QE when an economic recovery is underway and inflation starts rising. Whilst in QE the Reserve Bank of Australia (RBA) purchases government and corporate bonds from financial institutions to provide them with liquidity, in QT the RBA stops buying more assets, and stops reinvesting the principal maturing on the bonds it already holds. It would be positive (or bullish) for the Australian Dollar.
- The USD/JPY pair trades around a fresh high of 161.73 since 1986, recorded on Monday.
- Japanese Finance Minister Shunichi Suzuki noted that there is no change in the government's stance on foreign exchange.
- The US Dollar improves due to higher yields amid heightened expectations of the Fed rate cuts in 2024.
The Japanese Yen (JPY) extends losses on Tuesday, which could be attributed to the improved US Dollar (USD). The USD/JPY pair trades near its fresh low of 161.73 since 1986. However, the verbal intervention by Japanese authorities may limit the downside of the JPY.
Japanese Finance Minister Shunichi Suzuki stated on Tuesday that he is "closely watching FX moves with vigilance." Suzuki refrained from commenting on specific forex levels, noting that there is no change in the government's stance on foreign exchange, according to Reuters.
The US Dollar (USD) halted its three-day losing streak as US Treasury yields rose due to heightened expectations of the Federal Reserve (Fed) reducing interest rates in 2024. Traders await a speech by Federal Reserve Chairman Jerome Powell on Tuesday.
Daily Digest Market Movers: Japanese Yen declines as US Dollar gains ground
- On Monday, OCBC strategists Frances Cheung and Christopher Wong noted that “USD/JPY continued to trade near recent highs. This is also near the highest level since 1986. There are expectations that Japanese authorities could soon intervene. While the level of JPY is one factor to consider, officials also focus on the pace of depreciation as the intent of intervention is to curb excessive volatility.”
- The US Manufacturing Purchasing Managers Index (PMI) unexpectedly dropped to 48.5 in June from 48.7 in May, missing the forecast of 49.1. This reading indicates a third consecutive month of declining manufacturing activity and marks the lowest level since February, according to data released on Monday.
- Japan’s Tankan Large Manufacturing Index rose to 13 in the second quarter from the previous reading of 11. The index hit the highest level in two years amid an improving economic outlook. Meanwhile, Japan’s Jibun Bank Manufacturing PMI for June was revised slightly lower to 50 from a preliminary reading of 50.1 but remained expansionary for the second straight month.
- On Friday, the Federal Reserve Bank of San Francisco President Mary Daly said that monetary policy is working. Still, it’s too early to tell when it will be appropriate to cut the interest rate. Daly stated, "If inflation stays sticky or comes down slowly, rates would need to be higher for longer,” per Reuters.
- On Friday, the US Bureau of Economic Analysis reported that US inflation eased to its lowest annual rate in over three years. The US Personal Consumption Expenditures (PCE) Price Index increased by 2.6% year-over-year in May, down from 2.7% in April, meeting market expectations. Core PCE inflation also rose by 2.6% year-over-year in May, down from 2.8% in April, aligning with estimates.
Technical Analysis: USD/JPY remains above 161.50
USD/JPY trades around 161.60 on Tuesday. The analysis of the daily chart shows a bullish bias, with the pair hovering near the upper boundary of an ascending channel pattern. However, caution is warranted as the 14-day Relative Strength Index (RSI) is above 70, signaling that the asset is overbought. This suggests a potential correction could be forthcoming in the near term.
If the USD/JPY pair surpasses the upper boundary of the ascending channel at around 161.70, it will reinforce bullish sentiment, possibly pushing the pair toward the psychological resistance level of 162.00.
On the downside, immediate support is observed at the nine-day Exponential Moving Average (EMA) located at 160.38. A breach below this level could increase downward pressure on USD/JPY, potentially driving it towards the lower boundary of the ascending channel around 158.50. A further decline below this channel support could lead to a test of June's low at 154.55.
USD/JPY: Daily Chart
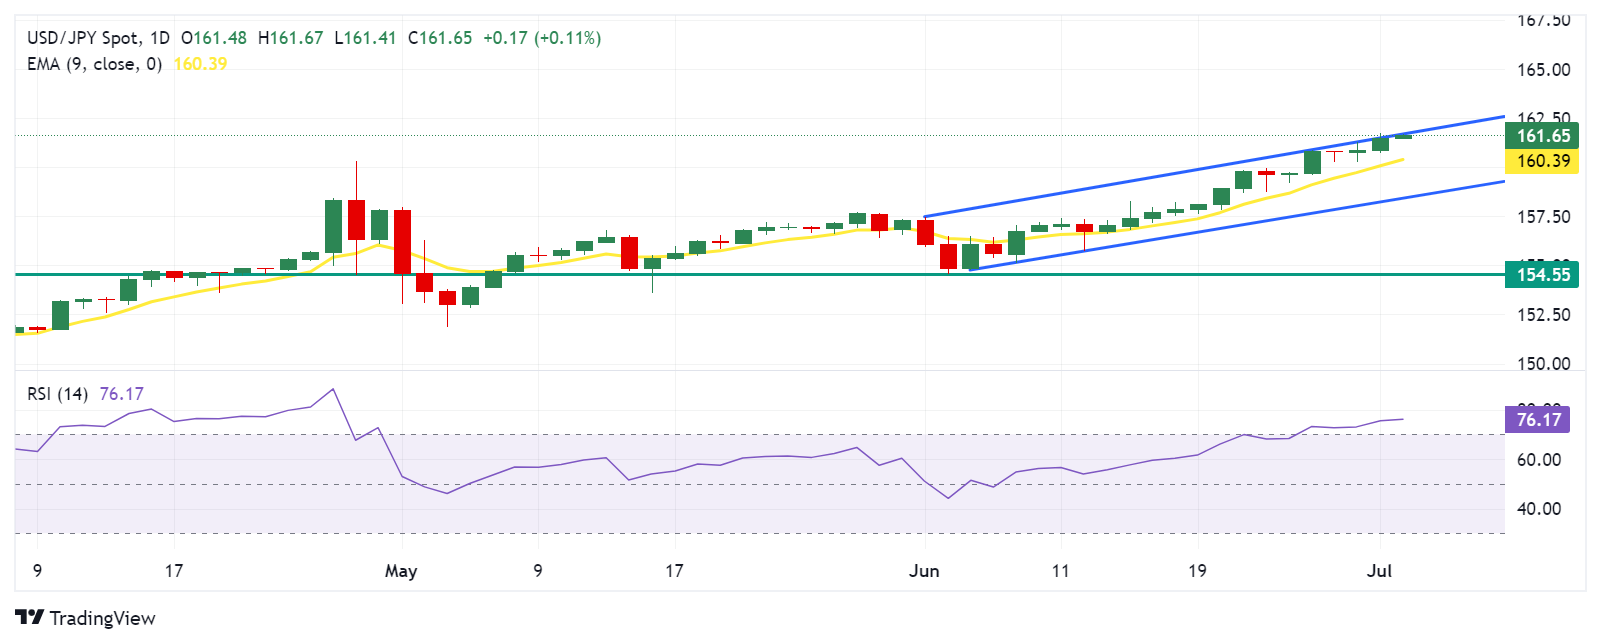
Japanese Yen PRICE Today
The table below shows the percentage change of Japanese Yen (JPY) against listed major currencies today. Japanese Yen was the weakest against the US Dollar.
| USD | EUR | GBP | JPY | CAD | AUD | NZD | CHF | |
|---|---|---|---|---|---|---|---|---|
| USD | 0.07% | 0.12% | 0.11% | 0.13% | 0.34% | 0.45% | 0.13% | |
| EUR | -0.07% | 0.04% | 0.07% | 0.06% | 0.24% | 0.36% | 0.06% | |
| GBP | -0.12% | -0.04% | 0.02% | 0.02% | 0.18% | 0.32% | 0.00% | |
| JPY | -0.11% | -0.07% | -0.02% | -0.01% | 0.22% | 0.30% | -0.01% | |
| CAD | -0.13% | -0.06% | -0.02% | 0.00% | 0.21% | 0.32% | -0.01% | |
| AUD | -0.34% | -0.24% | -0.18% | -0.22% | -0.21% | 0.11% | -0.21% | |
| NZD | -0.45% | -0.36% | -0.32% | -0.30% | -0.32% | -0.11% | -0.32% | |
| CHF | -0.13% | -0.06% | -0.00% | 0.00% | 0.00% | 0.21% | 0.32% |
The heat map shows percentage changes of major currencies against each other. The base currency is picked from the left column, while the quote currency is picked from the top row. For example, if you pick the Japanese Yen from the left column and move along the horizontal line to the US Dollar, the percentage change displayed in the box will represent JPY (base)/USD (quote).
Japanese Yen FAQs
The Japanese Yen (JPY) is one of the world’s most traded currencies. Its value is broadly determined by the performance of the Japanese economy, but more specifically by the Bank of Japan’s policy, the differential between Japanese and US bond yields, or risk sentiment among traders, among other factors.
One of the Bank of Japan’s mandates is currency control, so its moves are key for the Yen. The BoJ has directly intervened in currency markets sometimes, generally to lower the value of the Yen, although it refrains from doing it often due to political concerns of its main trading partners. The current BoJ ultra-loose monetary policy, based on massive stimulus to the economy, has caused the Yen to depreciate against its main currency peers. This process has exacerbated more recently due to an increasing policy divergence between the Bank of Japan and other main central banks, which have opted to increase interest rates sharply to fight decades-high levels of inflation.
The BoJ’s stance of sticking to ultra-loose monetary policy has led to a widening policy divergence with other central banks, particularly with the US Federal Reserve. This supports a widening of the differential between the 10-year US and Japanese bonds, which favors the US Dollar against the Japanese Yen.
The Japanese Yen is often seen as a safe-haven investment. This means that in times of market stress, investors are more likely to put their money in the Japanese currency due to its supposed reliability and stability. Turbulent times are likely to strengthen the Yen’s value against other currencies seen as more risky to invest in.
- The Indian Rupee trades in negative territory in Tuesday’s Asian session.
- Higher US bond yields and further gains in crude oil prices weigh on the local currency.
- The Federal Reserve’s (Fed) Chairman Jerome Powell's speech on Tuesday will be closely watched.
The Indian Rupee (INR) weakens on Tuesday amid the renewed US Dollar (USD) demand and higher US bond yields. Meanwhile, the further rise of crude oil prices amid fears of Middle East geopolitical risks exerts some selling pressure on the INR as India is the world’s third-largest oil consumer after the United States (US) and China.
Nonetheless, the optimism in the Indian economic outlook and portfolio inflows, including the country's sovereign bonds on account of their inclusion in the JPMorgan emerging market debt index, might lift the local currency and cap the pair’s upside. Investors will closely watch the speech by Federal Reserve (Fed) Chairman Jerome Powell on Tuesday for fresh impetus. On Wednesday, the attention will shift to India’s HSBC Services Purchasing Managers Index (PMI) for June. Any signs of further expansion in the Indian services sector might boost the Indian Rupee and create a headwind for the pair.
Daily Digest Market Movers: Indian Rupee edges lower amid higher crude oil prices and US bond yields
- India’s HSBC Manufacturing PMI rose to 58.3 in June from the previous reading of 57.5, weaker than the expectation of 58.5.
- Indian Manufacturing PMI growth was boosted by a record-high rate of job creation. The employment rate was supported by buoyant demand conditions that fueled expansions in new orders, output levels, and procurement activities across the sector.
- Foreign investors bought 16.54 billion rupees ($198.4 million) in Indian bonds under the Fully Accessible Route, lower than the market expected.
- US Manufacturing PMI for June declined to 48.5 from 48.7 in May. This figure came in weaker than the estimation of 49.1, the Institute for Supply Management (ISM) reported Monday.
- Financial markets are now pricing in nearly 59.5% chance of 25 basis points (bps) of Fed rate cut in September, up from 58.2% last Friday, according to CME FedWatch Tool.
Technical analysis: USD/INR might face consolidation or downside in the near term
The Indian Rupee trades weaker on the day. The USD/INR pair remains stuck within the familiar trading range on the daily chart. The bullish trend of the pair remains intact above the key 100-day Exponential Moving Average (EMA). However, further consolidation or downside cannot be ruled out as the 14-day Relative Strength Index (RSI) holds in bearish territory below the 50-midline.
Consistent trading above 83.65, a high of June 26, may take USD/INR back to the all-time high of 83.75. An upside breakout might extend its upswing to the 84.00 psychological level.
On the downside, any follow-through selling below the 100-day EMA of 83.35 might drag the pair lower to the 83.00 round figure. A breach of this level will see a drop to 82.82, a low of January 12.
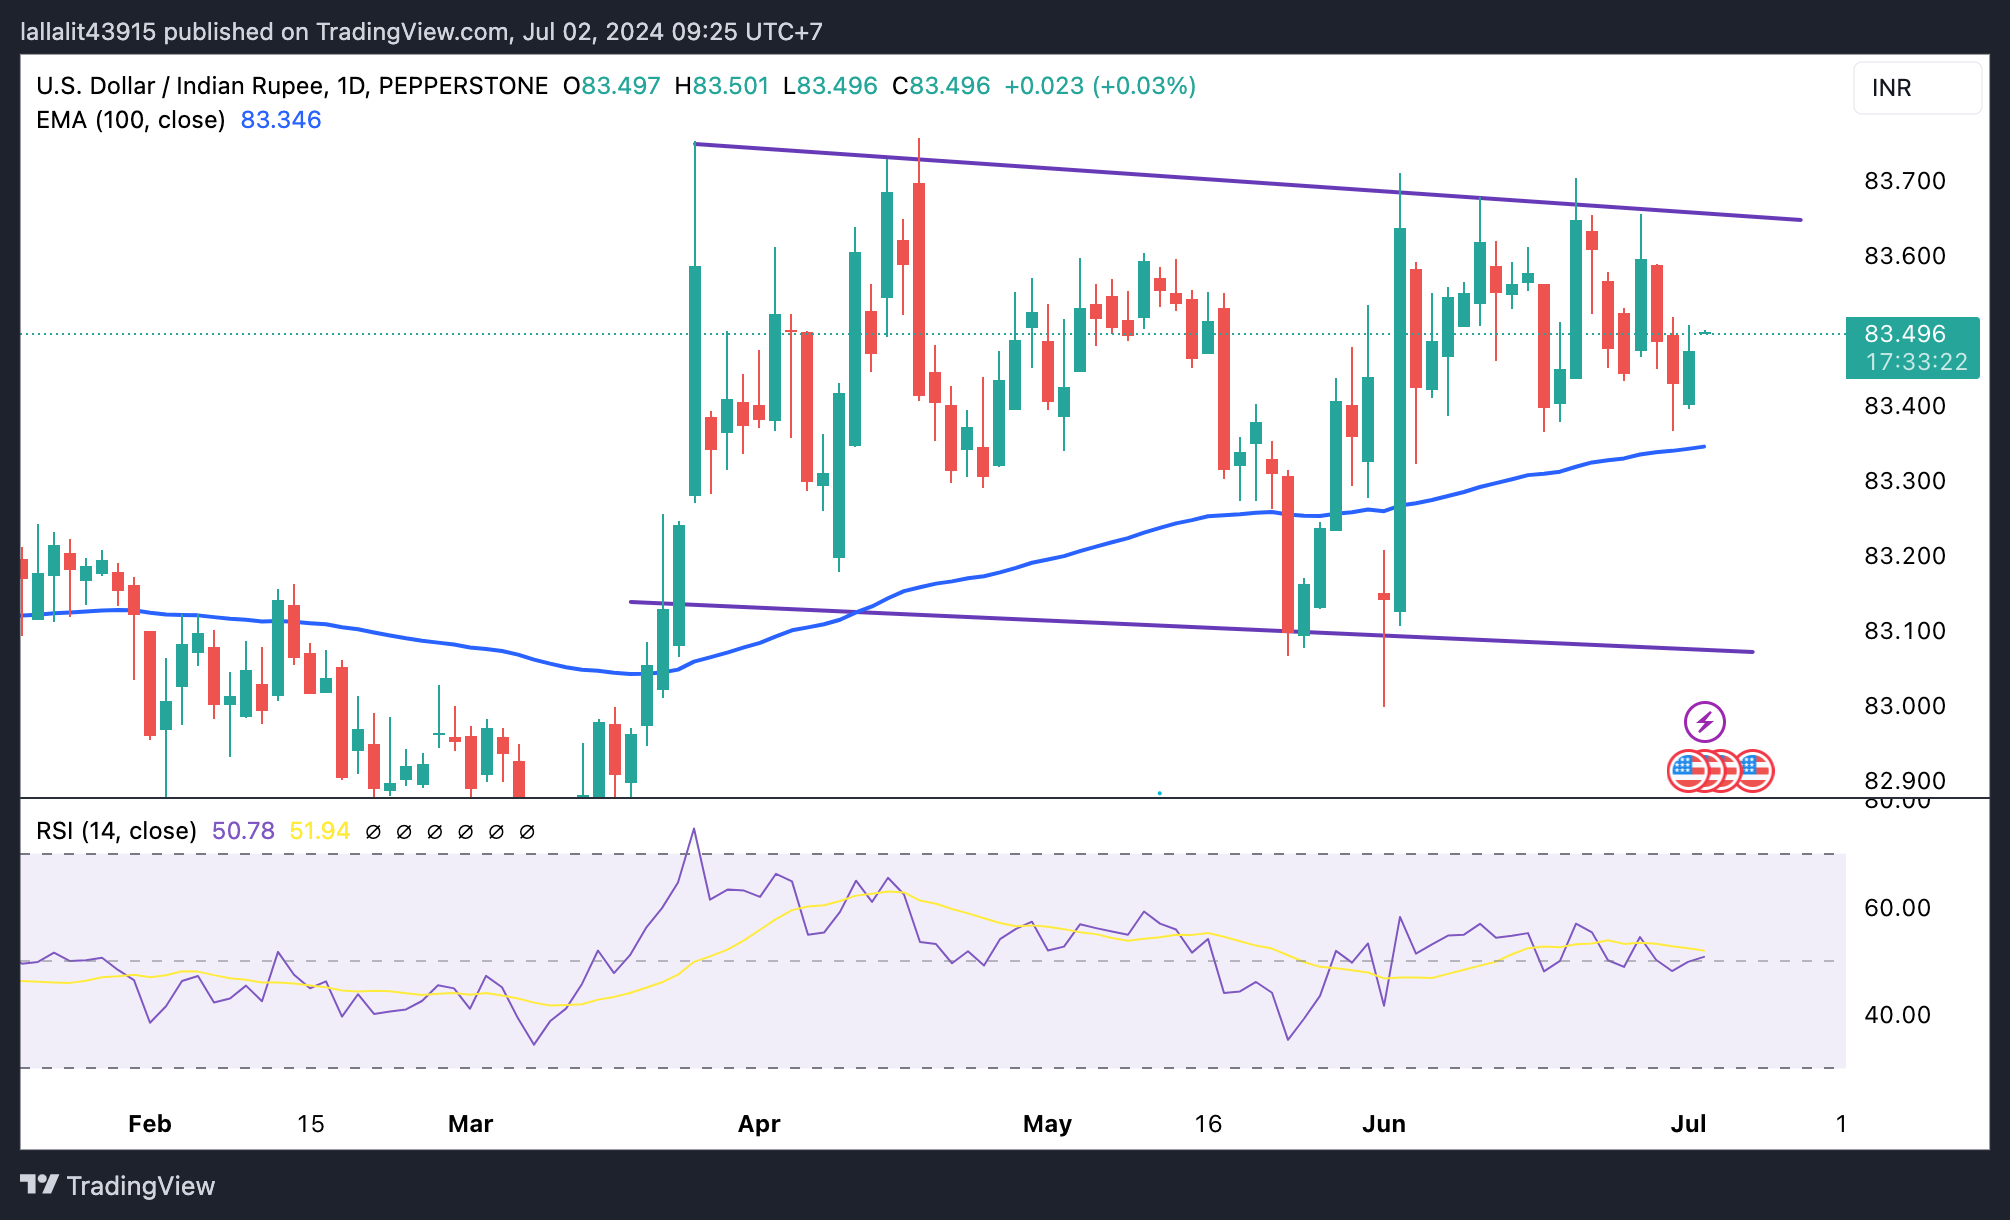
US Dollar price today
The table below shows the percentage change of US Dollar (USD) against listed major currencies today. US Dollar was the strongest against the New Zealand Dollar.
| USD | EUR | GBP | CAD | AUD | JPY | NZD | CHF | |
| USD | 0.03% | 0.06% | 0.08% | 0.16% | 0.06% | 0.18% | 0.04% | |
| EUR | -0.03% | 0.01% | 0.04% | 0.13% | 0.01% | 0.15% | 0.01% | |
| GBP | -0.05% | -0.01% | 0.02% | 0.12% | -0.01% | 0.14% | -0.01% | |
| CAD | -0.06% | -0.03% | -0.01% | 0.09% | -0.02% | 0.12% | -0.02% | |
| AUD | -0.17% | -0.13% | -0.11% | -0.10% | -0.12% | 0.01% | -0.14% | |
| JPY | -0.05% | -0.02% | 0.01% | 0.02% | 0.11% | 0.13% | 0.00% | |
| NZD | -0.18% | -0.15% | -0.13% | -0.11% | -0.01% | -0.14% | -0.14% | |
| CHF | -0.05% | -0.01% | 0.00% | 0.03% | 0.13% | 0.00% | 0.14% |
The heat map shows percentage changes of major currencies against each other. The base currency is picked from the left column, while the quote currency is picked from the top row. For example, if you pick the Euro from the left column and move along the horizontal line to the Japanese Yen, the percentage change displayed in the box will represent EUR (base)/JPY (quote).
Indian Rupee FAQs
The Indian Rupee (INR) is one of the most sensitive currencies to external factors. The price of Crude Oil (the country is highly dependent on imported Oil), the value of the US Dollar – most trade is conducted in USD – and the level of foreign investment, are all influential. Direct intervention by the Reserve Bank of India (RBI) in FX markets to keep the exchange rate stable, as well as the level of interest rates set by the RBI, are further major influencing factors on the Rupee.
The Reserve Bank of India (RBI) actively intervenes in forex markets to maintain a stable exchange rate, to help facilitate trade. In addition, the RBI tries to maintain the inflation rate at its 4% target by adjusting interest rates. Higher interest rates usually strengthen the Rupee. This is due to the role of the ‘carry trade’ in which investors borrow in countries with lower interest rates so as to place their money in countries’ offering relatively higher interest rates and profit from the difference.
Macroeconomic factors that influence the value of the Rupee include inflation, interest rates, the economic growth rate (GDP), the balance of trade, and inflows from foreign investment. A higher growth rate can lead to more overseas investment, pushing up demand for the Rupee. A less negative balance of trade will eventually lead to a stronger Rupee. Higher interest rates, especially real rates (interest rates less inflation) are also positive for the Rupee. A risk-on environment can lead to greater inflows of Foreign Direct and Indirect Investment (FDI and FII), which also benefit the Rupee.
Higher inflation, particularly, if it is comparatively higher than India’s peers, is generally negative for the currency as it reflects devaluation through oversupply. Inflation also increases the cost of exports, leading to more Rupees being sold to purchase foreign imports, which is Rupee-negative. At the same time, higher inflation usually leads to the Reserve Bank of India (RBI) raising interest rates and this can be positive for the Rupee, due to increased demand from international investors. The opposite effect is true of lower inflation.
- GBP/USD continues with its struggle to gain any meaningful traction on Tuesday.
- Bets for a BoE rate cut in August act as a headwind amid modest USD strength.
- Traders also prefer to wait on the sidelines ahead of the UK election on Thursday.
The GBP/USD pair extends its sideways consolidative price move during the Asian session on Tuesday and remains confined in a familiar range held over the past two weeks or so. Spot prices currently trade around the 1.2655-1.2645 confluence region – comprising 50-day and 100-day Simple Moving Averages (SMAs) – amid the anxiety surrounding the upcoming UK general elections on Thursday.
In the meantime, the Bank of England's (BoE) dovish pause in June, which lifted bets for a rate cut at the August monetary policy meeting, continues to undermine the British Pound (GBP). The US Dollar (USD), on the other hand, builds on the overnight solid bounce from a multi-day low and further seems to act as a headwind for the GBP/USD pair. The yield on the benchmark 10-year government bond shot to its highest level in a month on Monday amid concerns that the imposition of aggressive tariffs by the Trump administration could fuel inflation and trigger higher interest rates.
Apart from this, This, along with a softer tone around the US equity futures, lends some support to the safe-haven Greenback. That said, growing acceptance that the Federal Reserve (Fed) will begin its rate-cutting cycle in September keeps a lid on any further upside for the US bond yields. The expectations were reaffirmed by the US ISM PMI on Monday, which showed the US manufacturing sector contracted for the third straight month in June. This, along with signs that inflation in the US is subsiding, should allow the US central bank to start lowering borrowing costs.
Traders might also prefer to wait for more cues about the Fed's rate-cut path before positioning for the next leg of a directional move. Hence, the focus will remain glued to Fed Chair Jerome Powell's speech later this Tuesday and FOMC meeting minutes on Wednesday. Apart from this, the US monthly employment details, popularly known as the Nonfarm Payrolls (NFP) report, due for release on Friday, will play a key role in influencing the near-term USD price dynamics.
Pound Sterling FAQs
The Pound Sterling (GBP) is the oldest currency in the world (886 AD) and the official currency of the United Kingdom. It is the fourth most traded unit for foreign exchange (FX) in the world, accounting for 12% of all transactions, averaging $630 billion a day, according to 2022 data. Its key trading pairs are GBP/USD, aka ‘Cable’, which accounts for 11% of FX, GBP/JPY, or the ‘Dragon’ as it is known by traders (3%), and EUR/GBP (2%). The Pound Sterling is issued by the Bank of England (BoE).
The single most important factor influencing the value of the Pound Sterling is monetary policy decided by the Bank of England. The BoE bases its decisions on whether it has achieved its primary goal of “price stability” – a steady inflation rate of around 2%. Its primary tool for achieving this is the adjustment of interest rates. When inflation is too high, the BoE will try to rein it in by raising interest rates, making it more expensive for people and businesses to access credit. This is generally positive for GBP, as higher interest rates make the UK a more attractive place for global investors to park their money. When inflation falls too low it is a sign economic growth is slowing. In this scenario, the BoE will consider lowering interest rates to cheapen credit so businesses will borrow more to invest in growth-generating projects.
Data releases gauge the health of the economy and can impact the value of the Pound Sterling. Indicators such as GDP, Manufacturing and Services PMIs, and employment can all influence the direction of the GBP. A strong economy is good for Sterling. Not only does it attract more foreign investment but it may encourage the BoE to put up interest rates, which will directly strengthen GBP. Otherwise, if economic data is weak, the Pound Sterling is likely to fall.
Another significant data release for the Pound Sterling is the Trade Balance. This indicator measures the difference between what a country earns from its exports and what it spends on imports over a given period. If a country produces highly sought-after exports, its currency will benefit purely from the extra demand created from foreign buyers seeking to purchase these goods. Therefore, a positive net Trade Balance strengthens a currency and vice versa for a negative balance.
| Raw materials | Closed | Change, % |
|---|---|---|
| Silver | 29.441 | 1.21 |
| Gold | 233.167 | 0.37 |
| Palladium | 980.61 | 1.6 |
Japanese Finance Minister Shunixhi Suzuki said on Tuesday that he is “closely watching FX moves with vigilance.”
Additional quotes
Won't comment on forex levels.
No change in the government's stance on foreign exchange.
The market has been driven by various factors, including sentiment, speculation.
Closely watching FX moves with vigilance.
Not in a position to comment when asked about the effectiveness of verbal intervention.
Market reaction
As of writing, USD/JPY is holding higher ground near 161.60. adding 0.08% on the day.
- The Australian Dollar loses ground as the RBA Index of Commodity Prices fell by 4.1% YoY in June.
- RBA Minutes emphasizes the need to remain vigilant as data suggested an upside risk for May's CPI.
- The US Dollar appreciates due to the higher US Treasury yields amid heightened expectations of the Fed reducing rates in 2024.
The Australian Dollar (AUD) extends its losses for the second successive day on Tuesday. This downturn could be attributed to the Reserve Bank of Australia's (RBA) Index of Commodity Prices, which fell by 4.1% year-on-year in June, following an upwardly revised 6.0% decline in the previous month. The June decline marks the mildest deflation in sixteen consecutive months.
The Minutes of the Reserve Bank of Australia’s (RBA) June monetary policy meeting, released Tuesday, indicated that the "board judged the case for holding rates steady stronger than hiking." The board emphasized the need to remain vigilant to upside risks to inflation, noting that data suggested an upside risk for May's Consumer Price Index (CPI).
The US Dollar (USD) appreciates due to the advance in the US Treasury yields. This could be attributed to the heightened expectations of the US Federal Reserve’s (Fed) deducting interest rates in 2024. The speech by Federal Reserve (Fed) Chairman Jerome Powell will be in the spotlight on Tuesday.
Daily Digest Market Movers: Australian Dollar declines due to softer Index of Commodity Prices
- The Melbourne Institute's Monthly Inflation Gauge has heightened concerns that the RBA might raise interest rates again in August. The gauge increased by 0.3% in June, maintaining the same pace as in May, marking the fourth consecutive month of rises and remaining at the highest since January.
- The Judo Bank Australia Manufacturing PMI dropped for the fifth consecutive month to 47.2 in June from 49.7 in May. This decline is the fastest deterioration since May 2020.
- The US Manufacturing Purchasing Managers Index (PMI) for June fell to 48.5, down from 48.7 in May. This figure was weaker than the expected 49.1, as reported on Monday.
- Chinese President Xi Jinping, as reported by Chinese state media on Monday, emphasized that fostering a healthy and stable development of China-Australia relations serves the fundamental and long-term interests of both countries and their peoples. Xi expressed readiness to collaborate with Australia in advancing toward a more mature, stable, and productive comprehensive strategic partnership between the two nations.
- On Friday, the Federal Reserve Bank of San Francisco President Mary Daly said that monetary policy is working. Still, it’s too early to tell when it will be appropriate to cut the interest rate. Daly stated, "If inflation stays sticky or comes down slowly, rates would need to be higher for longer,” per Reuters.
- The Reserve Bank of Australia’s (RBA) Deputy Governor Andrew Hauser. Hauser said it would be a “bad mistake” to formulate policy in response to a single inflation report. He emphasized that there is still a suite of economic data to come that will require detailed analysis, per Bloomberg.
Technical Analysis: Australian Dollar hovers around 0.6650
The Australian Dollar trades around 0.6640 on Tuesday. The analysis of the daily chart shows a neutral bias for the AUD/USD pair, which is consolidating within a rectangle formation. The 14-day Relative Strength Index (RSI) is at 50, also indicating neutral momentum. Future movements may provide a clearer directional trend.
The AUD/USD pair may face resistance near the upper boundary of the rectangle formation at around 0.6690, followed by the psychological level of 0.6700. Additional resistance is located at 0.6714, the highest level since January.
On the downside, the AUD/USD pair could find support near the 50-day Exponential Moving Average (EMA) at 0.6622. A break below this level could lead the pair to test the lower boundary of the rectangle formation near 0.6585.
AUD/USD: Daily Chart
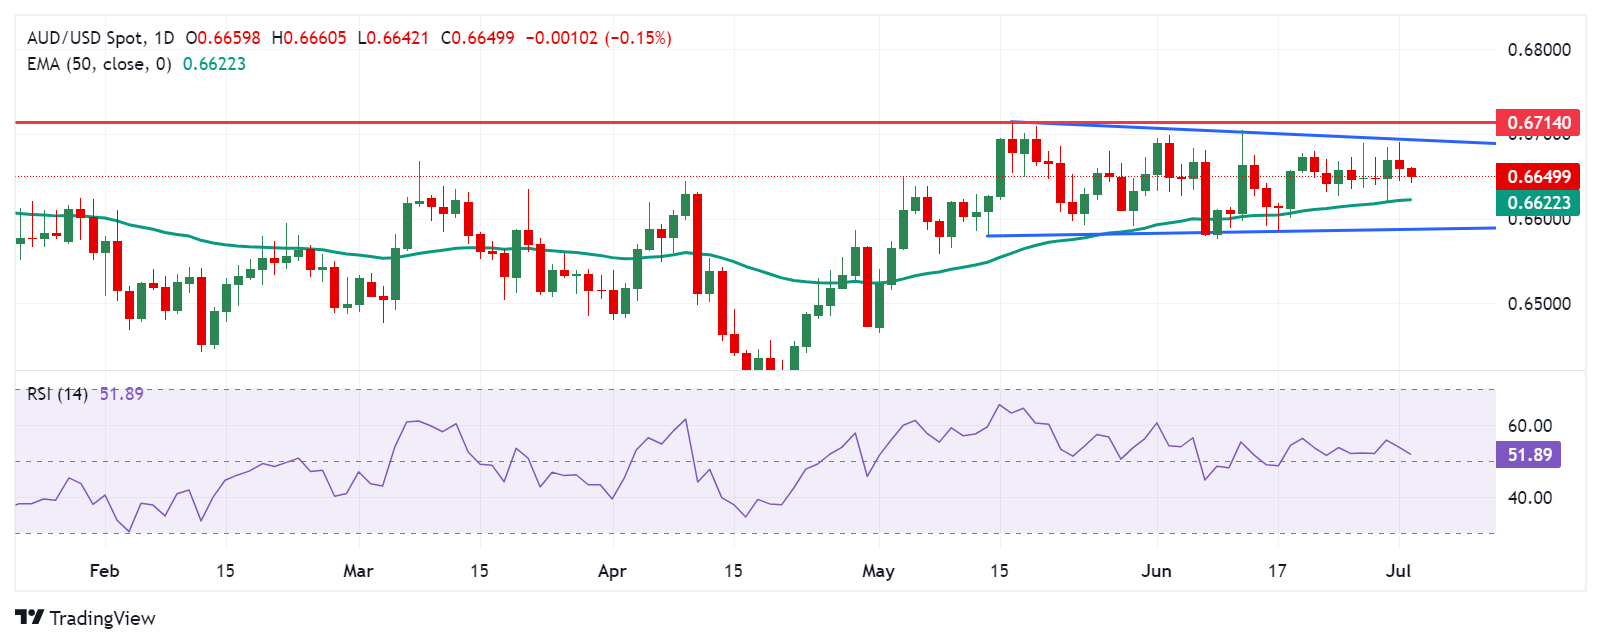
Australian Dollar PRICE Today
The table below shows the percentage change of Australian Dollar (AUD) against listed major currencies today. Australian Dollar was the weakest against the US Dollar.
| USD | EUR | GBP | JPY | CAD | AUD | NZD | CHF | |
|---|---|---|---|---|---|---|---|---|
| USD | 0.05% | 0.07% | 0.10% | 0.04% | 0.16% | 0.27% | 0.09% | |
| EUR | -0.05% | 0.02% | 0.07% | -0.02% | 0.11% | 0.20% | 0.04% | |
| GBP | -0.07% | -0.02% | 0.04% | -0.02% | 0.08% | 0.19% | 0.01% | |
| JPY | -0.10% | -0.07% | -0.04% | -0.07% | 0.07% | 0.14% | -0.02% | |
| CAD | -0.04% | 0.02% | 0.02% | 0.07% | 0.13% | 0.23% | 0.05% | |
| AUD | -0.16% | -0.11% | -0.08% | -0.07% | -0.13% | 0.10% | -0.08% | |
| NZD | -0.27% | -0.20% | -0.19% | -0.14% | -0.23% | -0.10% | -0.18% | |
| CHF | -0.09% | -0.04% | -0.01% | 0.02% | -0.05% | 0.08% | 0.18% |
The heat map shows percentage changes of major currencies against each other. The base currency is picked from the left column, while the quote currency is picked from the top row. For example, if you pick the Australian Dollar from the left column and move along the horizontal line to the US Dollar, the percentage change displayed in the box will represent AUD (base)/USD (quote).
Australian Dollar FAQs
One of the most significant factors for the Australian Dollar (AUD) is the level of interest rates set by the Reserve Bank of Australia (RBA). Because Australia is a resource-rich country another key driver is the price of its biggest export, Iron Ore. The health of the Chinese economy, its largest trading partner, is a factor, as well as inflation in Australia, its growth rate and Trade Balance. Market sentiment – whether investors are taking on more risky assets (risk-on) or seeking safe-havens (risk-off) – is also a factor, with risk-on positive for AUD.
The Reserve Bank of Australia (RBA) influences the Australian Dollar (AUD) by setting the level of interest rates that Australian banks can lend to each other. This influences the level of interest rates in the economy as a whole. The main goal of the RBA is to maintain a stable inflation rate of 2-3% by adjusting interest rates up or down. Relatively high interest rates compared to other major central banks support the AUD, and the opposite for relatively low. The RBA can also use quantitative easing and tightening to influence credit conditions, with the former AUD-negative and the latter AUD-positive.
China is Australia’s largest trading partner so the health of the Chinese economy is a major influence on the value of the Australian Dollar (AUD). When the Chinese economy is doing well it purchases more raw materials, goods and services from Australia, lifting demand for the AUD, and pushing up its value. The opposite is the case when the Chinese economy is not growing as fast as expected. Positive or negative surprises in Chinese growth data, therefore, often have a direct impact on the Australian Dollar and its pairs.
Iron Ore is Australia’s largest export, accounting for $118 billion a year according to data from 2021, with China as its primary destination. The price of Iron Ore, therefore, can be a driver of the Australian Dollar. Generally, if the price of Iron Ore rises, AUD also goes up, as aggregate demand for the currency increases. The opposite is the case if the price of Iron Ore falls. Higher Iron Ore prices also tend to result in a greater likelihood of a positive Trade Balance for Australia, which is also positive of the AUD.
The Trade Balance, which is the difference between what a country earns from its exports versus what it pays for its imports, is another factor that can influence the value of the Australian Dollar. If Australia produces highly sought after exports, then its currency will gain in value purely from the surplus demand created from foreign buyers seeking to purchase its exports versus what it spends to purchase imports. Therefore, a positive net Trade Balance strengthens the AUD, with the opposite effect if the Trade Balance is negative.
- Gold price struggles to capitalize on Monday’s gains amid some follow-through USD buying.
- Rising bets for a September Fed rate cut move should help limit the downside for the metal.
- Fed Chair Powell’s speech eyed for some impetus ahead of FOMC minutes on Wednesday.
Gold price (XAU/USD) attracted some dip-buyers near the $2,319-2,318 region and ended in the green at the start of a new week amid bets for a September interest rate cut by the Federal Reserve (Fed). The expectations were reaffirmed by data showing that the US manufacturing sector contracted for the third straight month in June and prices paid by factories for inputs dropped to a six-month low. This adds to signs that inflation is subsiding, which should allow the US central bank to start lowering borrowing costs. Apart from this, China's economic woes, persistent geopolitical tensions and political uncertainty in the US and Europe, offered some support to the safe-haven precious metal.
That said, a solid US Dollar (USD) recovery from a multi-day low keeps a lid on any further gains for the Gold price. Concerns that a Trump presidency would be more inflationary than a Biden administration triggered a selloff in the US fixed-income market on Monday. This, in turn, pushed the yield on the benchmark 10-year government bond to its highest level in a month, which is seen as acting as a tailwind for the USD and capping the commodity. Traders also seem reluctant and prefer to wait for more cues about the Fed's policy path before placing directional bets. Hence, the focus remains glued to Fed Chair Jerome Powell's speech later today and the FOMC minutes on Wednesday.
Daily Digest Market Movers: Gold price struggles to lure buyers despite rising Fed rate cut bets
Softer US macro data released on Monday reinforced expectations that the Federal Reserve will cut interest rates in September and again in December, prompting some intraday short-covering around the Gold price.
The Institute for Supply Management (ISM) said its Manufacturing PMI remained in contraction territory for the second straight month and edged lower from 48.7 to 48.5 in June, missing consensus estimates.
Additional details of the report showed that the Employment Index declined to 49.3 from 51.1 in May and the Prices Paid Index – the inflation component – retreated from 57 to 52.1 during the reported month.
This comes on top of the US PCE Price Index on Friday, which showed that inflation in May slowed to its lowest annual rate in more than three years and lifted bets for an imminent start of the Fed's rate-cutting cycle.
The US Treasuries sold off amid increasing odds of Donald Trump being elected as US President again later this year, which prompted some US Dollar short-covering and capped the upside for the XAU/USD.
Investors now look forward to Fed Chair Jerome Powell's speech later this Tuesday for some meaningful impetus ahead of the FOMC minutes on Wednesday and the US Nonfarm Payrolls report on Friday.
Meanwhile, Tuesday's US economic docket features the release of JOLTS Job Openings data, which might influence the USD price dynamics and further contribute to producing short-term trading opportunities.
Technical Analysis: Gold price continues to face resistance near 50-day SMA pivotal resistance
From a technical perspective, the Gold price, so far, has been struggling to make it through the 50-day Simple Moving Average (SMA) pivotal resistance. The said barrier is currently pegged near the $2,337-2,338 region and should act as a key pivotal point. A sustained strength beyond should pave the way for a move towards the next relevant hurdle near the $2,360-2,365 supply zone. Some follow-through buying should allow bulls to reclaim the $2,400 round-figure mark and aim towards challenging the all-time peak, around the $2,450 area touched in May.
On the flip side, weakness below the $2,319-2,318 area, or the overnight swing low, could find some support near the $2,300 mark ahead of the $2,285 horizontal zone. Failure to defend the said support levels will be seen as a fresh trigger for bearish traders and drag the Gold price to the 100-day SMA, currently near the $2,258 area. The downward trajectory could eventually drag the XAU/USD to the $2,225-2,220 region en route to the $2,200 round-figure mark.
Gold FAQs
Gold has played a key role in human’s history as it has been widely used as a store of value and medium of exchange. Currently, apart from its shine and usage for jewelry, the precious metal is widely seen as a safe-haven asset, meaning that it is considered a good investment during turbulent times. Gold is also widely seen as a hedge against inflation and against depreciating currencies as it doesn’t rely on any specific issuer or government.
Central banks are the biggest Gold holders. In their aim to support their currencies in turbulent times, central banks tend to diversify their reserves and buy Gold to improve the perceived strength of the economy and the currency. High Gold reserves can be a source of trust for a country’s solvency. Central banks added 1,136 tonnes of Gold worth around $70 billion to their reserves in 2022, according to data from the World Gold Council. This is the highest yearly purchase since records began. Central banks from emerging economies such as China, India and Turkey are quickly increasing their Gold reserves.
Gold has an inverse correlation with the US Dollar and US Treasuries, which are both major reserve and safe-haven assets. When the Dollar depreciates, Gold tends to rise, enabling investors and central banks to diversify their assets in turbulent times. Gold is also inversely correlated with risk assets. A rally in the stock market tends to weaken Gold price, while sell-offs in riskier markets tend to favor the precious metal.
The price can move due to a wide range of factors. Geopolitical instability or fears of a deep recession can quickly make Gold price escalate due to its safe-haven status. As a yield-less asset, Gold tends to rise with lower interest rates, while higher cost of money usually weighs down on the yellow metal. Still, most moves depend on how the US Dollar (USD) behaves as the asset is priced in dollars (XAU/USD). A strong Dollar tends to keep the price of Gold controlled, whereas a weaker Dollar is likely to push Gold prices up.
The Minutes of the Reserve Bank of Australia’s (RBA) June monetary policy meeting showed Tuesday that the “board judged the case for holding rates steady stronger than for hiking.”
Additional takeaways
Needed to be vigilant to upside risks to inflation, data suggested upside risk for May CPI.
Economic uncertainty meant it was difficult to rule in or out future changes in policy.
Recent data not sufficient to change outlook for inflation returning to target by 2026.
Judged still possible to bring inflation to target while keeping employment gains.
Board saw downside risks to the labor market, vacancy rates pointed to weakness.
Unemployment rate could rise quickly as it had done in the past.
Continued rapid rise in business insolvencies would be negative for jobs.
Wise to give little weight to upward revisions to household consumption.
Q1 GDP growth had been very weak, wage growth looked to have peaked.
Hike might be needed if board judged policy was not "sufficiently restrictive".
August forecast round would allow staff to carefully judge spare capacity in economy.
Judgements about spare capacity were very uncertain, should be treated with caution.
Inflation expectations still anchored, but market premia had drifted higher.
A material rise in inflation expectations could require significantly higher rates.
Market reaction
AUD/USD trimmed a part of its intraday losses and jumped to retest 0.6650 following the RBA Minutes release. The pair is currently trading 0.17% lower on the day at 0.6647.
Australian Dollar PRICE Today
The table below shows the percentage change of Australian Dollar (AUD) against listed major currencies today. Australian Dollar was the weakest against the US Dollar.
| USD | EUR | GBP | JPY | CAD | AUD | NZD | CHF | |
|---|---|---|---|---|---|---|---|---|
| USD | 0.05% | 0.06% | 0.10% | 0.04% | 0.15% | 0.31% | 0.10% | |
| EUR | -0.05% | 0.02% | 0.07% | -0.01% | 0.10% | 0.25% | 0.05% | |
| GBP | -0.06% | -0.02% | 0.04% | -0.02% | 0.06% | 0.24% | 0.02% | |
| JPY | -0.10% | -0.07% | -0.04% | -0.08% | 0.06% | 0.18% | -0.02% | |
| CAD | -0.04% | 0.01% | 0.02% | 0.08% | 0.12% | 0.28% | 0.05% | |
| AUD | -0.15% | -0.10% | -0.06% | -0.06% | -0.12% | 0.16% | -0.06% | |
| NZD | -0.31% | -0.25% | -0.24% | -0.18% | -0.28% | -0.16% | -0.22% | |
| CHF | -0.10% | -0.05% | -0.02% | 0.02% | -0.05% | 0.06% | 0.22% |
The heat map shows percentage changes of major currencies against each other. The base currency is picked from the left column, while the quote currency is picked from the top row. For example, if you pick the Australian Dollar from the left column and move along the horizontal line to the US Dollar, the percentage change displayed in the box will represent AUD (base)/USD (quote).
- WTI edges higher to $83.60 on Tuesday.
- The hope for a strong summer driving demand and oil supply concerns lift the black gold.
- A higher-for-longer rate narrative in the US might weigh on the WTI price.
West Texas Intermediate (WTI), the US crude oil benchmark, is trading around $83.60 on Tuesday. The rise of the WTI price is bolstered by renewed fears of Middle East geopolitical risks and expectations of rising summer fuel demand.
Oil traders have added long positions amid worries that tensions between Israel and the Iran-backed Hezbollah militia in Lebanon could spread and reduce global oil supplies. This, in turn, might lift the black gold in the near term. Additionally, the Atlantic weather season remains a concern, with Hurricane Beryl barreling through the Caribbean as a Category 4 storm, said Phil Flynn, senior market analyst at the Price Futures Group.
Apart from this, strong summer driving demand is likely to boost WTI prices for the time being. Last week, the Energy Information Administration (EIA) showed that both output and demand for main petroleum products reached a four-month high in April.
On the other hand, the higher-for-longer rates in the United States might weigh on the WTI price as it can slow economic growth and reduce oil demand. San Francisco Fed President Mary Daly said on Friday that monetary policy is working, but it’s too early to tell when it will be appropriate to cut the interest rate. Daly further stated, "If inflation stays sticky or comes down slowly, rates would need to be higher for longer.”
WTI Oil FAQs
WTI Oil is a type of Crude Oil sold on international markets. The WTI stands for West Texas Intermediate, one of three major types including Brent and Dubai Crude. WTI is also referred to as “light” and “sweet” because of its relatively low gravity and sulfur content respectively. It is considered a high quality Oil that is easily refined. It is sourced in the United States and distributed via the Cushing hub, which is considered “The Pipeline Crossroads of the World”. It is a benchmark for the Oil market and WTI price is frequently quoted in the media.
Like all assets, supply and demand are the key drivers of WTI Oil price. As such, global growth can be a driver of increased demand and vice versa for weak global growth. Political instability, wars, and sanctions can disrupt supply and impact prices. The decisions of OPEC, a group of major Oil-producing countries, is another key driver of price. The value of the US Dollar influences the price of WTI Crude Oil, since Oil is predominantly traded in US Dollars, thus a weaker US Dollar can make Oil more affordable and vice versa.
The weekly Oil inventory reports published by the American Petroleum Institute (API) and the Energy Information Agency (EIA) impact the price of WTI Oil. Changes in inventories reflect fluctuating supply and demand. If the data shows a drop in inventories it can indicate increased demand, pushing up Oil price. Higher inventories can reflect increased supply, pushing down prices. API’s report is published every Tuesday and EIA’s the day after. Their results are usually similar, falling within 1% of each other 75% of the time. The EIA data is considered more reliable, since it is a government agency.
OPEC (Organization of the Petroleum Exporting Countries) is a group of 13 Oil-producing nations who collectively decide production quotas for member countries at twice-yearly meetings. Their decisions often impact WTI Oil prices. When OPEC decides to lower quotas, it can tighten supply, pushing up Oil prices. When OPEC increases production, it has the opposite effect. OPEC+ refers to an expanded group that includes ten extra non-OPEC members, the most notable of which is Russia.
The People’s Bank of China (PBOC) set the USD/CNY central rate on Tuesday at 7.1291, as against the previous day's fix of 7.1265 and 7.2774 Reuters estimates.
- USD/CAD edges higher to 1.3735 in Tuesday’s early Asian session.
- The US ISM Manufacturing PMI dropped slightly in June, indicating an ongoing contraction.
- Higher crude oil prices might cap the downside for the commodity-linked Loonie.
The USD/CAD pair gains ground near 1.3735 during the early Asian session on Tuesday. The rebound of the pair is bolstered by the stronger US Dollar (USD) and higher US Treasury bond yields. Nonetheless, the upside of the pair might be limited as supply fears of crude oil in the second half of the year might lift the commodity-linked Loonie. The speech by Federal Reserve (Fed) Chairman Jerome Powell will be in the spotlight on Tuesday.
The cautious stance from Federal Reserve (Fed) officials is likely to underpin the Greenback in the near term. The Fed has kept its benchmark policy rate in the 5.25%-5.5% range since last July, and the policymakers stated that no rate cuts will be appropriate until they gain more confidence that inflation is on a sustainable path to the Fed 2% target.
San Francisco Fed President Mary Daly said on Friday that inflation remains too high, and she expected year-over-year inflation to potentially remain above 2% through the end of 2025. Meanwhile, Fed Governor Lisa Cook noted that she expected inflation to go "sideways" this year, and fall more sharply next year.
About the data, the US Manufacturing Purchasing Managers Index (PMI) for June declined to 48.5 from 48.7 in May. This figure came in weaker than the estimation of 49.1, the Institute for Supply Management (ISM) reported Monday.
On the Loonie front, the Canadian Dollar (CAD) edges lower despite the hotter-than-expected inflation data in May, raising doubts about rate cuts from the Bank of Canada's (BoC). The BoC governor Tiff Macklem warned that the pace of interest rate cuts will likely be “gradual” and each decision will depend on the economic data.
The downside of the Loonie might be capped amid the rise of crude oil prices. The renewed fears of wider Middle East geopolitical tensions and expectations of rising summer fuel demand continue to boost crude oil prices, which might support the commodity-linked CAD as Canada is the major crude oil exporter to the United States.
Canadian Dollar FAQs
The key factors driving the Canadian Dollar (CAD) are the level of interest rates set by the Bank of Canada (BoC), the price of Oil, Canada’s largest export, the health of its economy, inflation and the Trade Balance, which is the difference between the value of Canada’s exports versus its imports. Other factors include market sentiment – whether investors are taking on more risky assets (risk-on) or seeking safe-havens (risk-off) – with risk-on being CAD-positive. As its largest trading partner, the health of the US economy is also a key factor influencing the Canadian Dollar.
The Bank of Canada (BoC) has a significant influence on the Canadian Dollar by setting the level of interest rates that banks can lend to one another. This influences the level of interest rates for everyone. The main goal of the BoC is to maintain inflation at 1-3% by adjusting interest rates up or down. Relatively higher interest rates tend to be positive for the CAD. The Bank of Canada can also use quantitative easing and tightening to influence credit conditions, with the former CAD-negative and the latter CAD-positive.
The price of Oil is a key factor impacting the value of the Canadian Dollar. Petroleum is Canada’s biggest export, so Oil price tends to have an immediate impact on the CAD value. Generally, if Oil price rises CAD also goes up, as aggregate demand for the currency increases. The opposite is the case if the price of Oil falls. Higher Oil prices also tend to result in a greater likelihood of a positive Trade Balance, which is also supportive of the CAD.
While inflation had always traditionally been thought of as a negative factor for a currency since it lowers the value of money, the opposite has actually been the case in modern times with the relaxation of cross-border capital controls. Higher inflation tends to lead central banks to put up interest rates which attracts more capital inflows from global investors seeking a lucrative place to keep their money. This increases demand for the local currency, which in Canada’s case is the Canadian Dollar.
Macroeconomic data releases gauge the health of the economy and can have an impact on the Canadian Dollar. Indicators such as GDP, Manufacturing and Services PMIs, employment, and consumer sentiment surveys can all influence the direction of the CAD. A strong economy is good for the Canadian Dollar. Not only does it attract more foreign investment but it may encourage the Bank of Canada to put up interest rates, leading to a stronger currency. If economic data is weak, however, the CAD is likely to fall.
| Index | Change, points | Closed | Change, % |
|---|---|---|---|
| NIKKEI 225 | 47.98 | 39631.06 | 0.12 |
| KOSPI | 6.49 | 2804.31 | 0.23 |
| ASX 200 | -16.8 | 7750.7 | -0.22 |
| DAX | 55.21 | 18290.66 | 0.3 |
| CAC 40 | 81.73 | 7561.13 | 1.09 |
| Dow Jones | 50.66 | 39169.52 | 0.13 |
| S&P 500 | 14.61 | 5475.09 | 0.27 |
| NASDAQ Composite | 146.7 | 17879.3 | 0.83 |
| Pare | Closed | Change, % |
|---|---|---|
| AUDUSD | 0.66571 | -0.29 |
| EURJPY | 173.386 | 0.36 |
| EURUSD | 1.07378 | 0.02 |
| GBPJPY | 204.187 | 0.31 |
| GBPUSD | 1.26458 | -0.03 |
| NZDUSD | 0.6075 | -0.33 |
| USDCAD | 1.37337 | 0.48 |
| USDCHF | 0.90271 | 0.42 |
| USDJPY | 161.474 | 0.34 |


© 2000-2026. All rights reserved.
This site is managed by Teletrade D.J. LLC 2351 LLC 2022 (Euro House, Richmond Hill Road, Kingstown, VC0100, St. Vincent and the Grenadines).
The information on this website is for informational purposes only and does not constitute any investment advice.
The company does not serve or provide services to customers who are residents of the US, Canada, Iran, The Democratic People's Republic of Korea, Yemen and FATF blacklisted countries.
Making transactions on financial markets with marginal financial instruments opens up wide possibilities and allows investors who are willing to take risks to earn high profits, carrying a potentially high risk of losses at the same time. Therefore you should responsibly approach the issue of choosing the appropriate investment strategy, taking the available resources into account, before starting trading.
Use of the information: full or partial use of materials from this website must always be referenced to TeleTrade as the source of information. Use of the materials on the Internet must be accompanied by a hyperlink to teletrade.org. Automatic import of materials and information from this website is prohibited.
Please contact our PR department if you have any questions or need assistance at pr@teletrade.global.
transfers