- Analytics
- News and Tools
- Market News
CFD Markets News and Forecasts — 01-07-2024
- USD/JPY continued to trade near recent highs around 161.45 in Tuesday’s early Asian session.
- The US ISM Manufacturing PMI was weaker than expected, declining to 48.5 in June from 48.7 in May.
- The potential FX intervention from Japanese authorities might cap the pair’s upside.
The USD/JPY pair extends upside near 161.45 on Tuesday during the early Asian trading hours. The modest recovery of the Greenback provides some support to the pair. However, there are expectations that Japanese authorities could soon intervene in the foreign exchange market to prevent the Japanese Yen (JPY) from depreciating.
US manufacturing contracted for a third consecutive month in June amid subdued demand and higher interest rates. The US ISM Manufacturing Purchasing Managers Index (PMI) dropped to 48.5 in June from 48.7 in May. This figure came in below the market consensus of 49.1. Nonetheless, the hawkish comments from Fed officials continue to underpin the Greenback despite the weaker-than-expected US economic data.
On Friday, San Francisco Fed President Mary Daly said that monetary policy is working, but it’s too early to tell when it will be appropriate to cut the interest rate. Daly further stated that if inflation remains sticky or comes down slowly, interest rates would need to be higher for longer.
On the other hand, Japanese Finance Minister Shunichi Suzuki said that authorities are concerned about the impact of "rapid and one-sided" FX moves on the economy, adding that excessive volatility in the currency market is undesirable and that authorities will respond appropriately to such moves. This, in turn, might support the JPY in the near term and cap the upside for the pair. OCBC analysts said “USD/JPY continued to trade near recent highs. This is also near the highest level since 1986. There are expectations that Japanese authorities could soon intervene. While the level of JPY is one factor to consider, officials also focus on the pace of depreciation as the intent of intervention is to curb excessive volatility.”
Japanese Yen FAQs
The Japanese Yen (JPY) is one of the world’s most traded currencies. Its value is broadly determined by the performance of the Japanese economy, but more specifically by the Bank of Japan’s policy, the differential between Japanese and US bond yields, or risk sentiment among traders, among other factors.
One of the Bank of Japan’s mandates is currency control, so its moves are key for the Yen. The BoJ has directly intervened in currency markets sometimes, generally to lower the value of the Yen, although it refrains from doing it often due to political concerns of its main trading partners. The current BoJ ultra-loose monetary policy, based on massive stimulus to the economy, has caused the Yen to depreciate against its main currency peers. This process has exacerbated more recently due to an increasing policy divergence between the Bank of Japan and other main central banks, which have opted to increase interest rates sharply to fight decades-high levels of inflation.
The BoJ’s stance of sticking to ultra-loose monetary policy has led to a widening policy divergence with other central banks, particularly with the US Federal Reserve. This supports a widening of the differential between the 10-year US and Japanese bonds, which favors the US Dollar against the Japanese Yen.
The Japanese Yen is often seen as a safe-haven investment. This means that in times of market stress, investors are more likely to put their money in the Japanese currency due to its supposed reliability and stability. Turbulent times are likely to strengthen the Yen’s value against other currencies seen as more risky to invest in.
- EUR/USD briefly tested above 1.0770 on Monday before settling back.
- A packed economic data docket awaits the Fiber this week.
- EU HICP inflation, US NFP data looms ahead.
EUR/USD clipped into a fresh multi-week high above 1.0770 on Monday before getting forced back down by a broad-market reversal in investor sentiment. Bullish momentum was cut short after US activity figures flashed warning signs of a steepening economic downturn. Investors will be buckling down for the wait to key economic figures on both sides of the Atlantic throughout the week, culminating in a fresh print of US Nonfarm Payrolls (NFP) slated for Friday.
Forex Today: All the attention shifts to Powell and Lagarde
German Consumer Price Index (CPI) figures broadly missed the mark early Monday, with annualized German CPI easing to 2.2% in June, falling from the previous 2.4% and backsliding through the forecast 2.3%. US data also missed expectations on Monday; US ISM Manufacturing Purchasing Manager Index (PMI) figures declined in June, falling to 48.5 from 48.7 and entirely missing the forecast increase to 49.1. US ISM Manufacturing Prices Paid also declined sharply in June, falling to 52.1 from the previous 57.0, falling even further beyond the forecast decline to 55.9.
Economic Indicator
ISM Manufacturing PMI
The Institute for Supply Management (ISM) Manufacturing Purchasing Managers Index (PMI), released on a monthly basis, is a leading indicator gauging business activity in the US manufacturing sector. The indicator is obtained from a survey of manufacturing supply executives based on information they have collected within their respective organizations. Survey responses reflect the change, if any, in the current month compared to the previous month. A reading above 50 indicates that the manufacturing economy is generally expanding, a bullish sign for the US Dollar (USD). A reading below 50 signals that factory activity is generally declining, which is seen as bearish for USD.
Read more.Last release: Mon Jul 01, 2024 14:00
Frequency: Monthly
Actual: 48.5
Consensus: 49.1
Previous: 48.7
Source: Institute for Supply Management
The Institute for Supply Management’s (ISM) Manufacturing Purchasing Managers Index (PMI) provides a reliable outlook on the state of the US manufacturing sector. A reading above 50 suggests that the business activity expanded during the survey period and vice versa. PMIs are considered to be leading indicators and could signal a shift in the economic cycle. Stronger-than-expected prints usually have a positive impact on the USD. In addition to the headline PMI, the Employment Index and the Prices Paid Index numbers are watched closely as they shine a light on the labour market and inflation.
US markets were abruptly jolted into fresh risk concerns over the upcoming November presidential election. A recent public debate left the waters murky on who the clear frontrunner would be, and the US Supreme Court released a ruling on Monday stating that courts have limited capacity to levy criminal charges against sitting Presidents.
A fresh batch of key European data will drop on markets on Tuesday, with a slate of speeches from European Central Bank (ECB) policymakers including another appearance from ECB President Christine Lagarde. Pan-European Harmonized Index of Consumer Prices (HICP) inflation is expected to tick down slightly, with Core EU HICP inflation forecast to tick down to 2.8% YoY from the previous 2.9%. European Producer Price Index (PPI) inflation data is due Wednesday, followed by EU-wide Retail Sales figures early Friday.
On the US side, investors will be looking ahead to Tuesday’s appearance from Federal Reserve (Fed) Chairman Jerome Powell, followed by ADP Employment Change figures on Wednesday and Friday’s latest iteration of US Nonfarm Payrolls (NFP) and Average Hourly Earnings for June.
Euro PRICE This week
The table below shows the percentage change of Euro (EUR) against listed major currencies this week. Euro was the strongest against the New Zealand Dollar.
| USD | EUR | GBP | JPY | CAD | AUD | NZD | CHF | |
|---|---|---|---|---|---|---|---|---|
| USD | 0.04% | 0.03% | -0.02% | 0.02% | 0.09% | 0.16% | 0.06% | |
| EUR | -0.04% | -0.01% | -0.05% | -0.02% | 0.06% | 0.11% | 0.02% | |
| GBP | -0.03% | 0.00% | -0.04% | -0.00% | 0.04% | 0.11% | 0.02% | |
| JPY | 0.02% | 0.05% | 0.04% | 0.03% | 0.13% | 0.15% | 0.07% | |
| CAD | -0.02% | 0.02% | 0.00% | -0.03% | 0.08% | 0.13% | 0.04% | |
| AUD | -0.09% | -0.06% | -0.04% | -0.13% | -0.08% | 0.05% | -0.04% | |
| NZD | -0.16% | -0.11% | -0.11% | -0.15% | -0.13% | -0.05% | -0.09% | |
| CHF | -0.06% | -0.02% | -0.02% | -0.07% | -0.04% | 0.04% | 0.09% |
The heat map shows percentage changes of major currencies against each other. The base currency is picked from the left column, while the quote currency is picked from the top row. For example, if you pick the Euro from the left column and move along the horizontal line to the US Dollar, the percentage change displayed in the box will represent EUR (base)/USD (quote).
EUR/USD technical outlook
The Fiber kicked off the new trading week with a fresh push into 12-day peaks above 1.0770 before crumpling risk appetite dragged the pair back down to 1.0735. Intraday price action continues to lean into the midrange as EUR/USD grapples with the 200-hour Exponential Moving Average (EMA) at 1.0722.
EUR/USD found technical support from a demand zone priced in below 1.0680, but bullish momentum remains limited as technical indicators weigh bids down. Daily candlesticks remain pinned below the 200-day EMA at 1.0786, and Fiber remains trapped on the low end of a recent decline from June’s early bids above 1.0900.
EUR/USD hourly chart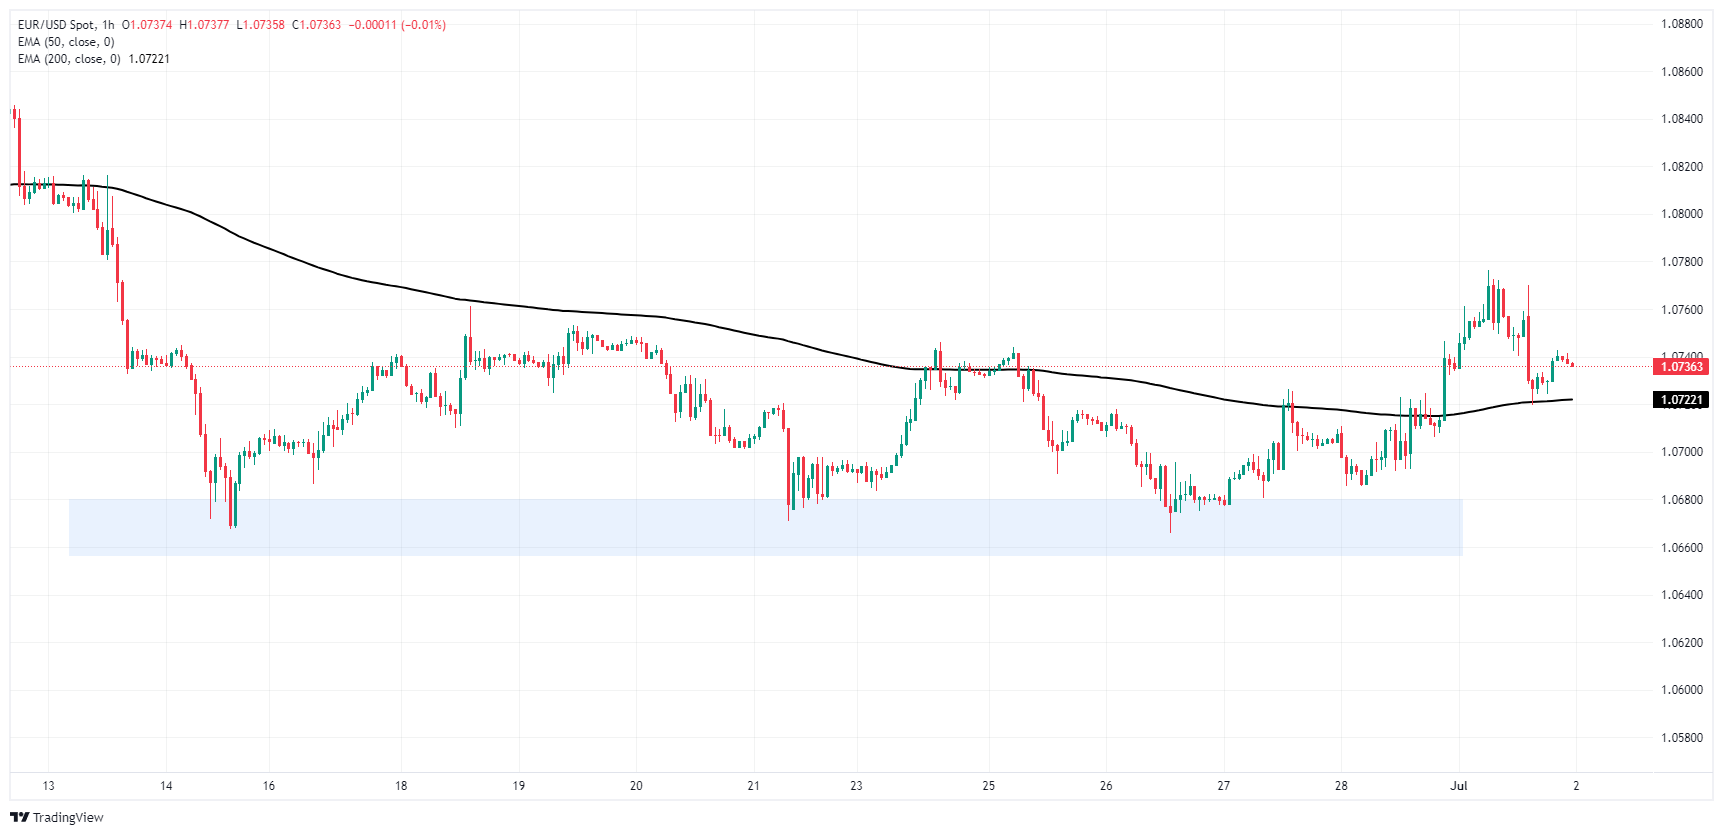
EUR/USD daily chart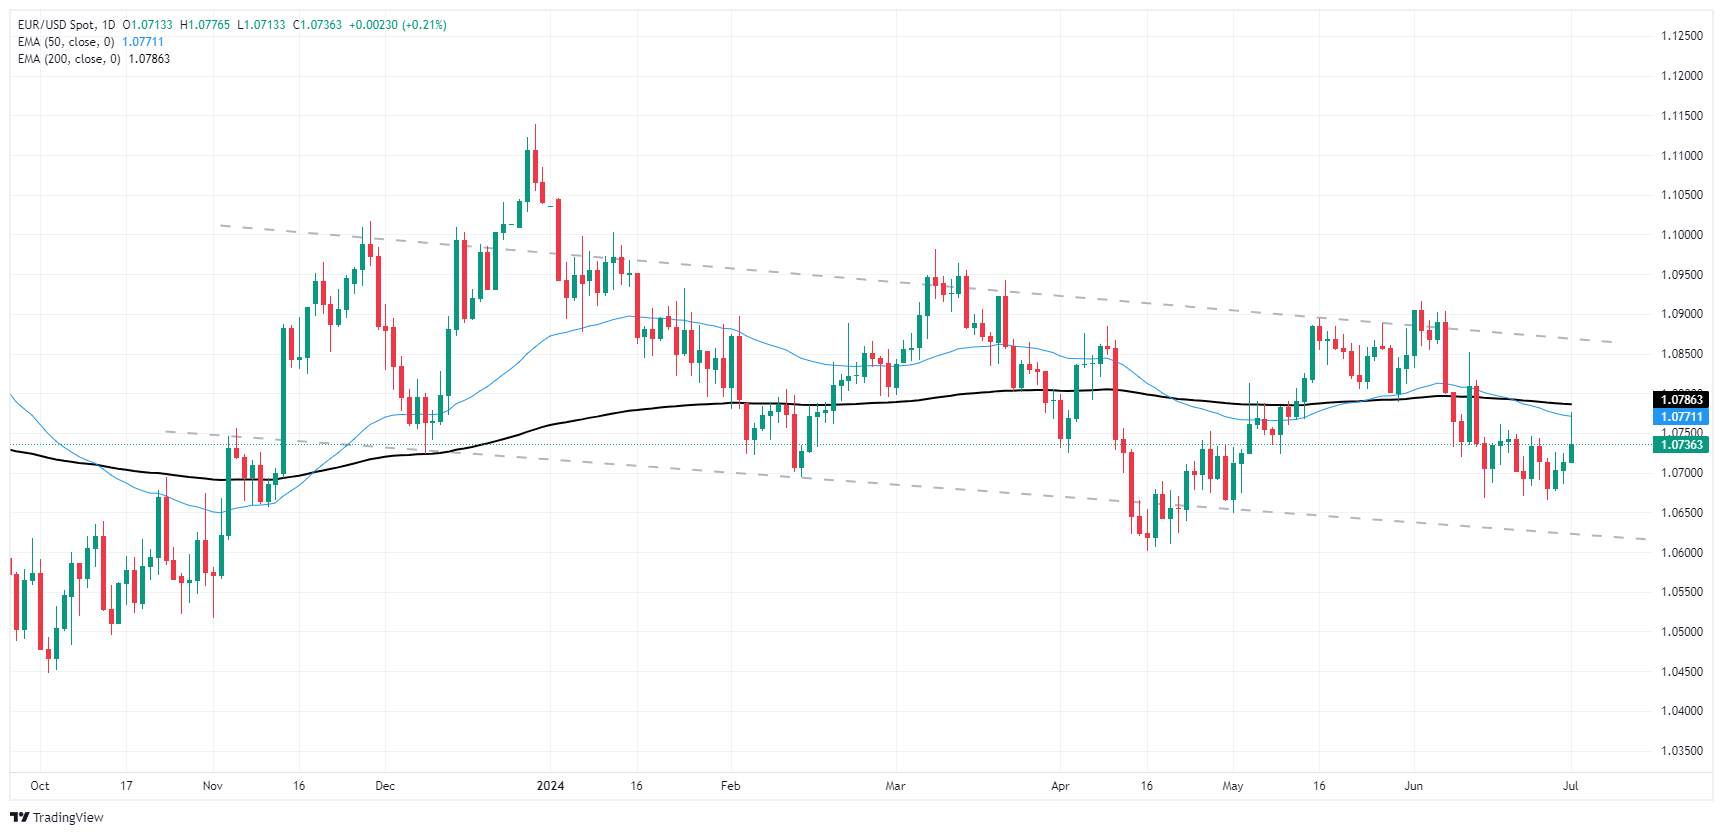
Euro FAQs
The Euro is the currency for the 20 European Union countries that belong to the Eurozone. It is the second most heavily traded currency in the world behind the US Dollar. In 2022, it accounted for 31% of all foreign exchange transactions, with an average daily turnover of over $2.2 trillion a day. EUR/USD is the most heavily traded currency pair in the world, accounting for an estimated 30% off all transactions, followed by EUR/JPY (4%), EUR/GBP (3%) and EUR/AUD (2%).
The European Central Bank (ECB) in Frankfurt, Germany, is the reserve bank for the Eurozone. The ECB sets interest rates and manages monetary policy. The ECB’s primary mandate is to maintain price stability, which means either controlling inflation or stimulating growth. Its primary tool is the raising or lowering of interest rates. Relatively high interest rates – or the expectation of higher rates – will usually benefit the Euro and vice versa. The ECB Governing Council makes monetary policy decisions at meetings held eight times a year. Decisions are made by heads of the Eurozone national banks and six permanent members, including the President of the ECB, Christine Lagarde.
Eurozone inflation data, measured by the Harmonized Index of Consumer Prices (HICP), is an important econometric for the Euro. If inflation rises more than expected, especially if above the ECB’s 2% target, it obliges the ECB to raise interest rates to bring it back under control. Relatively high interest rates compared to its counterparts will usually benefit the Euro, as it makes the region more attractive as a place for global investors to park their money.
Data releases gauge the health of the economy and can impact on the Euro. Indicators such as GDP, Manufacturing and Services PMIs, employment, and consumer sentiment surveys can all influence the direction of the single currency. A strong economy is good for the Euro. Not only does it attract more foreign investment but it may encourage the ECB to put up interest rates, which will directly strengthen the Euro. Otherwise, if economic data is weak, the Euro is likely to fall. Economic data for the four largest economies in the euro area (Germany, France, Italy and Spain) are especially significant, as they account for 75% of the Eurozone’s economy.
Another significant data release for the Euro is the Trade Balance. This indicator measures the difference between what a country earns from its exports and what it spends on imports over a given period. If a country produces highly sought after exports then its currency will gain in value purely from the extra demand created from foreign buyers seeking to purchase these goods. Therefore, a positive net Trade Balance strengthens a currency and vice versa for a negative balance.
Stats NZ noted another month-on-month decline in New Zealand building consents in May, with Building Permits falling -1.7% MoM, adding to the previous month's revised -2.1% decline.
Stats NZ highlighted that May's figure is a sharp -23% decline YoY, with 34.8K new Building Permits issued for the year ended May.
New Zealand Building Consents hit a record peak of 51K YoY in May 2022, and have done nothing but decline since. Stats NZ reported that all tracked multihome categories declined sharply over the annual period, with apartment buildings falling -52%.
Economic Indicator
Building Permits s.a. (MoM)
The Building Permits s.a. released by the Statistics New Zealand show the number of permits for new construction projects. It is considered as a leading indicator for the housing market. The more growing number of permits, the more positive (or bullish) for the NZD, while a low reading is seen as negative, or bearish.
Read more.Last release: Mon Jul 01, 2024 22:45
Frequency: Monthly
Actual: -1.7%
Consensus: -
Previous: -1.9%
Source: Stats NZ
About Stats NZ's Building Permits
The Building Permits s.a. released by the Statistics New Zealand show the number of permits for new construction projects. It is considered as a leading indicator for the housing market. The more growing number of permits, the more positive (or bullish) for the NZD, while a low reading is seen as negative, or bearish.
New Zealand Dollar FAQs
The New Zealand Dollar (NZD), also known as the Kiwi, is a well-known traded currency among investors. Its value is broadly determined by the health of the New Zealand economy and the country’s central bank policy. Still, there are some unique particularities that also can make NZD move. The performance of the Chinese economy tends to move the Kiwi because China is New Zealand’s biggest trading partner. Bad news for the Chinese economy likely means less New Zealand exports to the country, hitting the economy and thus its currency. Another factor moving NZD is dairy prices as the dairy industry is New Zealand’s main export. High dairy prices boost export income, contributing positively to the economy and thus to the NZD.
The Reserve Bank of New Zealand (RBNZ) aims to achieve and maintain an inflation rate between 1% and 3% over the medium term, with a focus to keep it near the 2% mid-point. To this end, the bank sets an appropriate level of interest rates. When inflation is too high, the RBNZ will increase interest rates to cool the economy, but the move will also make bond yields higher, increasing investors’ appeal to invest in the country and thus boosting NZD. On the contrary, lower interest rates tend to weaken NZD. The so-called rate differential, or how rates in New Zealand are or are expected to be compared to the ones set by the US Federal Reserve, can also play a key role in moving the NZD/USD pair.
Macroeconomic data releases in New Zealand are key to assess the state of the economy and can impact the New Zealand Dollar’s (NZD) valuation. A strong economy, based on high economic growth, low unemployment and high confidence is good for NZD. High economic growth attracts foreign investment and may encourage the Reserve Bank of New Zealand to increase interest rates, if this economic strength comes together with elevated inflation. Conversely, if economic data is weak, NZD is likely to depreciate.
The New Zealand Dollar (NZD) tends to strengthen during risk-on periods, or when investors perceive that broader market risks are low and are optimistic about growth. This tends to lead to a more favorable outlook for commodities and so-called ‘commodity currencies’ such as the Kiwi. Conversely, NZD tends to weaken at times of market turbulence or economic uncertainty as investors tend to sell higher-risk assets and flee to the more-stable safe havens.
- NZD/USD remains under some selling pressure around 0.6070 in Tuesday’s early Asian session.
- US manufacturing activity continued to decline in June.
- NZIER New Zealand Business Confidence extends decline in Q2.
The NZD/USD pair extends the decline near 0.6070 during the early Asian session on Tuesday. The renewed US Dollar (USD) demand and a further decline in New Zealand’s business activity outlook surveys drag the pair lower. Market players will keep an eye on Federal Reserve (Fed) Chairman Jerome Powell's speech on Tuesday for fresh impetus, followed by the Fed’s latest monetary policy minutes on Wednesday.
Growth in activity in the United States manufacturing sector continued to contract in June, according to the Institute for Supply Management (ISM) on Monday. The US ISM Manufacturing Purchasing Managers Index (PMI) declined to 48.5 in June from 48.7 in May, below the market expectation of 49.1.
The weaker-than-expected US Manufacturing PMI data, along with the US Personal Consumption Expenditures (PCE) Price Index data last week, have spurred speculation that the Fed would start an easing cycle this year, which might weigh on the Greenback. Traders are now pricing in nearly 59.5% chance of 25 basis points (bps) of Fed rate cut in September, up from 58.2% last Friday, according to CME FedWatch Tool.
On the Kiwi front, the latest data from the New Zealand Institute of Economic Research (NZIER) showed on Tuesday that the country’s Business Confidence deteriorated in the second quarter (Q2), falling 44% QoQ from the previous reading of a 25% fall. The downbeat reading undermines the New Zealand Dollar (NZD). Additionally, the expectation that the Reserve Bank of New Zealand (RBNZ) will cut rates earlier than projected exerts some selling pressure on the Kiwi.
New Zealand Dollar FAQs
The New Zealand Dollar (NZD), also known as the Kiwi, is a well-known traded currency among investors. Its value is broadly determined by the health of the New Zealand economy and the country’s central bank policy. Still, there are some unique particularities that also can make NZD move. The performance of the Chinese economy tends to move the Kiwi because China is New Zealand’s biggest trading partner. Bad news for the Chinese economy likely means less New Zealand exports to the country, hitting the economy and thus its currency. Another factor moving NZD is dairy prices as the dairy industry is New Zealand’s main export. High dairy prices boost export income, contributing positively to the economy and thus to the NZD.
The Reserve Bank of New Zealand (RBNZ) aims to achieve and maintain an inflation rate between 1% and 3% over the medium term, with a focus to keep it near the 2% mid-point. To this end, the bank sets an appropriate level of interest rates. When inflation is too high, the RBNZ will increase interest rates to cool the economy, but the move will also make bond yields higher, increasing investors’ appeal to invest in the country and thus boosting NZD. On the contrary, lower interest rates tend to weaken NZD. The so-called rate differential, or how rates in New Zealand are or are expected to be compared to the ones set by the US Federal Reserve, can also play a key role in moving the NZD/USD pair.
Macroeconomic data releases in New Zealand are key to assess the state of the economy and can impact the New Zealand Dollar’s (NZD) valuation. A strong economy, based on high economic growth, low unemployment and high confidence is good for NZD. High economic growth attracts foreign investment and may encourage the Reserve Bank of New Zealand to increase interest rates, if this economic strength comes together with elevated inflation. Conversely, if economic data is weak, NZD is likely to depreciate.
The New Zealand Dollar (NZD) tends to strengthen during risk-on periods, or when investors perceive that broader market risks are low and are optimistic about growth. This tends to lead to a more favorable outlook for commodities and so-called ‘commodity currencies’ such as the Kiwi. Conversely, NZD tends to weaken at times of market turbulence or economic uncertainty as investors tend to sell higher-risk assets and flee to the more-stable safe havens.
- GBP/USD briefly broke above 1.2700 before slumping back to opening bids.
- US data sparks rate cut hopes, then recession fears.
- Investor confidence jolted by US election risks, volatility ensues.
GBP/USD rallied briefly above the 1.2700 handle on Monday before US markets knocked back investor confidence, sparking a risk-off bid into the US Dollar and dragging Cable back down to the day’s opening bids near 1.2650.
Forex Today: All the attention shifts to Powell
US data broadly missed the mark. US ISM Manufacturing Purchasing Manager Index (PMI) figures declined in June, falling to 48.5 from 48.7 and entirely missing the forecast increase to 49.1. US ISM Manufacturing Prices Paid also declined sharply in June, falling to 52.1 from the previous 57.0, falling even further beyond the forecast decline to 55.9.
US markets were abruptly jolted into fresh risk concerns over the upcoming Presidential election slated for November. A recent public debate left the waters murky on who the clear frontrunner would be, and the US Supreme Court released a ruling on Monday stating that courts have limited capacity to levy criminal charges against sitting Presidents.
The UK has a thin economic data docket this week, though GBP traders will be keeping an eye out for Parliamentary elections on the book for Thursday. On the US side, investors will be looking ahead to Tuesday’s appearance from Federal Reserve (Fed) Chairman Jerome Powell, followed by ADP Employment Change figures on Wednesday and Friday’s latest iteration of US Nonfarm Payrolls (NFP) and Average Hourly Earnings for June.
Economic Indicator
ISM Manufacturing PMI
The Institute for Supply Management (ISM) Manufacturing Purchasing Managers Index (PMI), released on a monthly basis, is a leading indicator gauging business activity in the US manufacturing sector. The indicator is obtained from a survey of manufacturing supply executives based on information they have collected within their respective organizations. Survey responses reflect the change, if any, in the current month compared to the previous month. A reading above 50 indicates that the manufacturing economy is generally expanding, a bullish sign for the US Dollar (USD). A reading below 50 signals that factory activity is generally declining, which is seen as bearish for USD.
Read more.Last release: Mon Jul 01, 2024 14:00
Frequency: Monthly
Actual: 48.5
Consensus: 49.1
Previous: 48.7
Source: Institute for Supply Management
The Institute for Supply Management’s (ISM) Manufacturing Purchasing Managers Index (PMI) provides a reliable outlook on the state of the US manufacturing sector. A reading above 50 suggests that the business activity expanded during the survey period and vice versa. PMIs are considered to be leading indicators and could signal a shift in the economic cycle. Stronger-than-expected prints usually have a positive impact on the USD. In addition to the headline PMI, the Employment Index and the Prices Paid Index numbers are watched closely as they shine a light on the labour market and inflation.
GBP/USD technical outlook
Despite a near-term bull run to kick off the new trading week, Cable bidders were unable to keep the pressure up, and GBP/USD tumbled back below the 200-hour Exponential Moving Average (EMA) at 1.2665. Price action still favors shorts, and downside targets will be set below last week’s late low near 1.2615.
Daily candlesticks remain mired in a volatility trap between the 50-day and 200-day EMAs at 1.2668 and 1.2592, respectively. Near-term momentum still leans bearish as GBP/USD continues to drift lower after mid-June’s brief peak above 1.2850.
GBP/USD hourly chart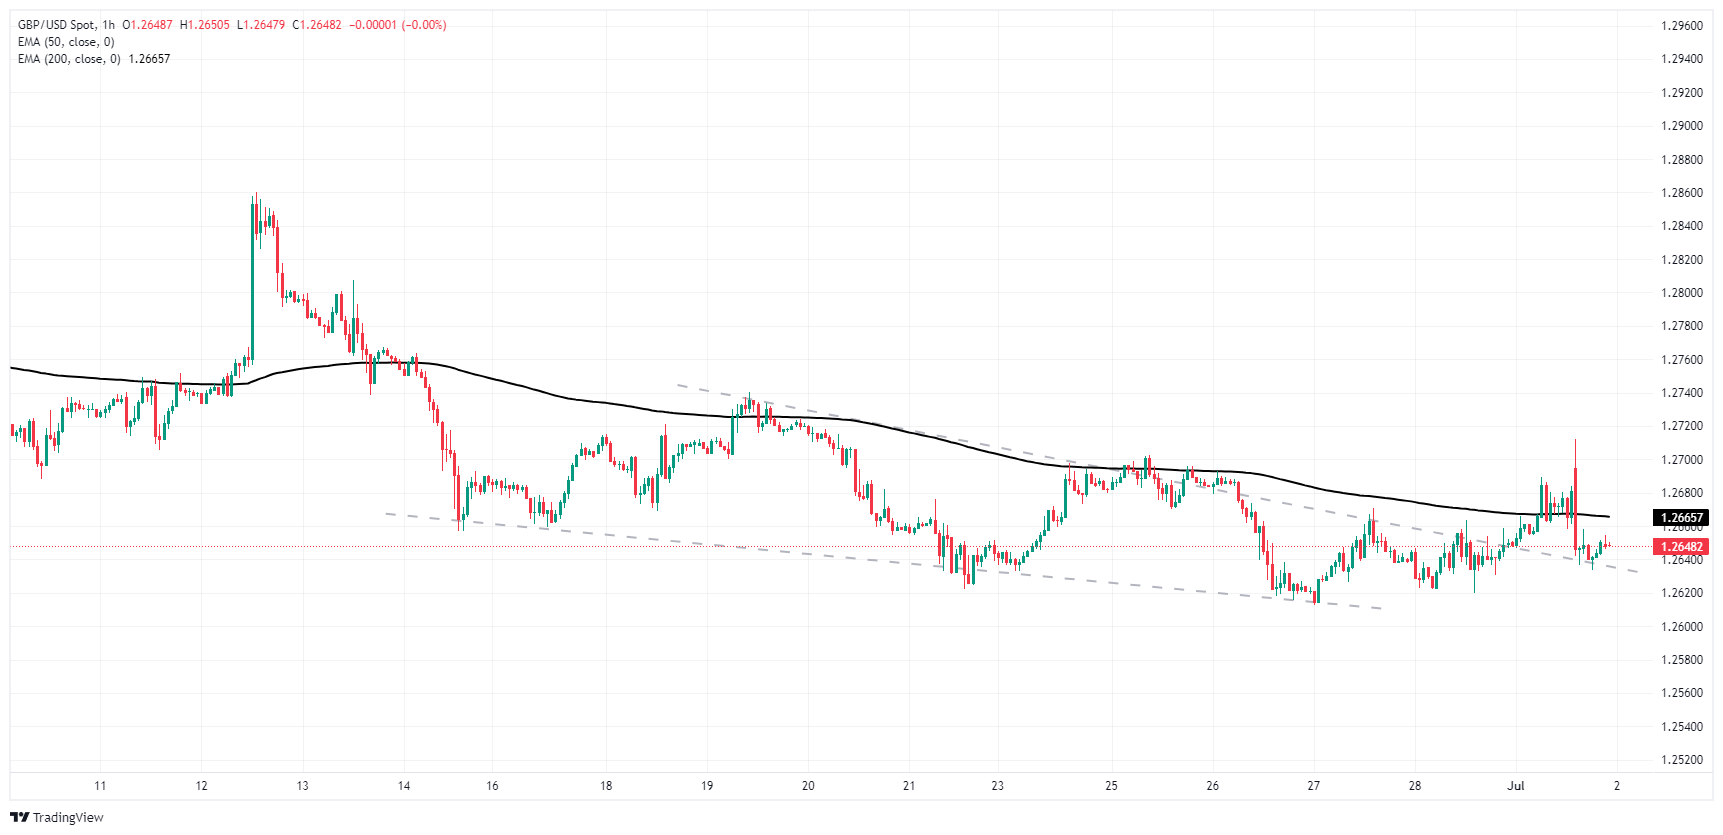
GBP/USD daily chart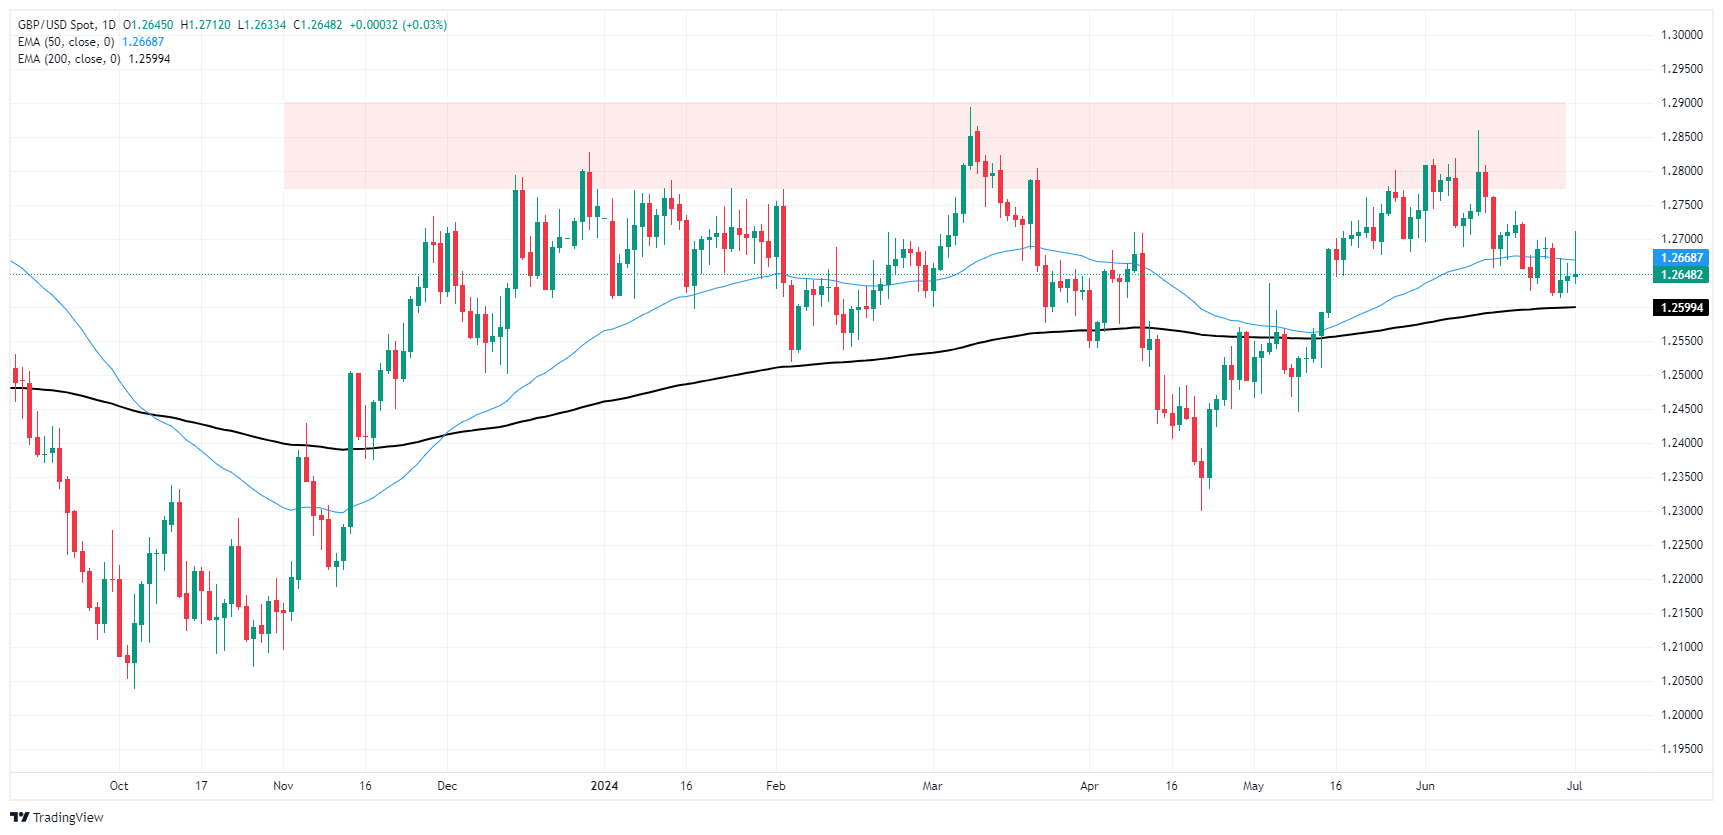
Pound Sterling FAQs
The Pound Sterling (GBP) is the oldest currency in the world (886 AD) and the official currency of the United Kingdom. It is the fourth most traded unit for foreign exchange (FX) in the world, accounting for 12% of all transactions, averaging $630 billion a day, according to 2022 data. Its key trading pairs are GBP/USD, aka ‘Cable’, which accounts for 11% of FX, GBP/JPY, or the ‘Dragon’ as it is known by traders (3%), and EUR/GBP (2%). The Pound Sterling is issued by the Bank of England (BoE).
The single most important factor influencing the value of the Pound Sterling is monetary policy decided by the Bank of England. The BoE bases its decisions on whether it has achieved its primary goal of “price stability” – a steady inflation rate of around 2%. Its primary tool for achieving this is the adjustment of interest rates. When inflation is too high, the BoE will try to rein it in by raising interest rates, making it more expensive for people and businesses to access credit. This is generally positive for GBP, as higher interest rates make the UK a more attractive place for global investors to park their money. When inflation falls too low it is a sign economic growth is slowing. In this scenario, the BoE will consider lowering interest rates to cheapen credit so businesses will borrow more to invest in growth-generating projects.
Data releases gauge the health of the economy and can impact the value of the Pound Sterling. Indicators such as GDP, Manufacturing and Services PMIs, and employment can all influence the direction of the GBP. A strong economy is good for Sterling. Not only does it attract more foreign investment but it may encourage the BoE to put up interest rates, which will directly strengthen GBP. Otherwise, if economic data is weak, the Pound Sterling is likely to fall.
Another significant data release for the Pound Sterling is the Trade Balance. This indicator measures the difference between what a country earns from its exports and what it spends on imports over a given period. If a country produces highly sought-after exports, its currency will benefit purely from the extra demand created from foreign buyers seeking to purchase these goods. Therefore, a positive net Trade Balance strengthens a currency and vice versa for a negative balance.
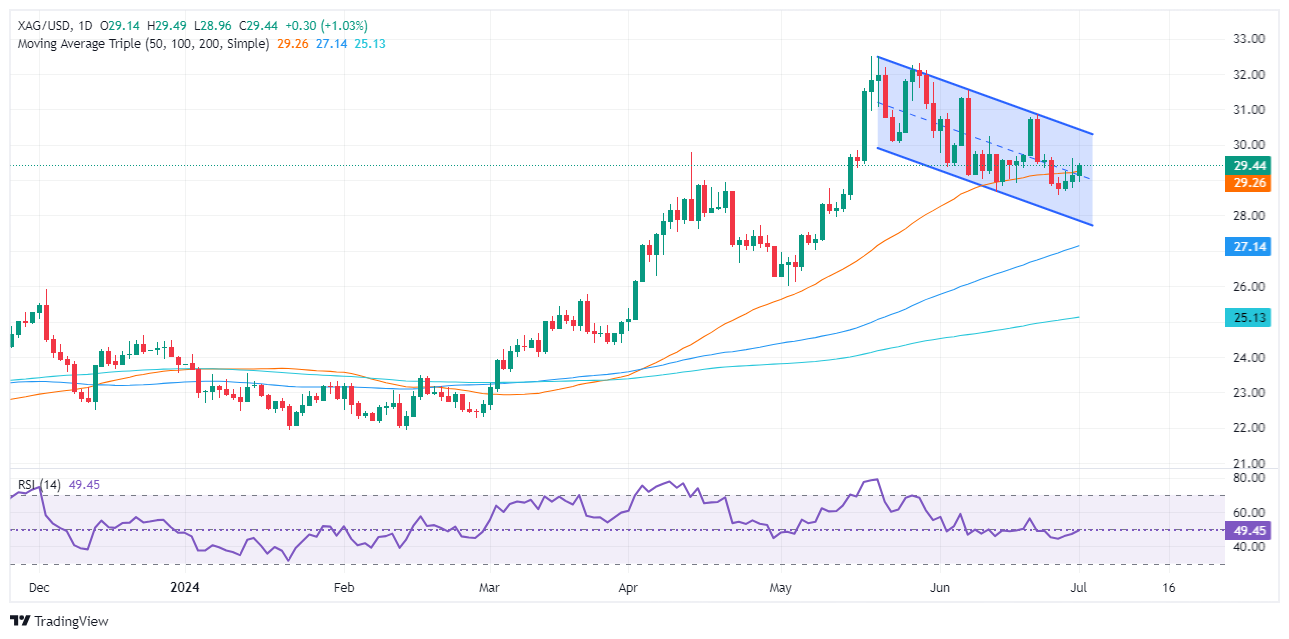
- Silver rallies over 1% from a daily low of $28.95.
- Technicals suggest upward bias; potential 'double bottom' pattern forming.
- Resistance levels: $30.00 (trendline), $30.84 ('double bottom' neckline), $32.29 (May 29 high), $32.51 (YTD high).
- Support points: $29.00, $28.57 (June 26 low), $27.59 (April 15 low).
Silver recovered on Monday, registering a gain of more than 1% courtesy of broad US Dollar weakness even though US Treasury bond yields climbed. Economic data from the United States (US) was mixed, while US equities fluctuated between gainers and losers. The XAG/USD trades at $29.44 after hitting a daily low of $28.95.
XAG/USD Price Analysis: Technical outlook
From a daily chart standpoint, the grey metal is upward biased and still trading within the boundaries of a descending channel. Traders remain cautious, as shown by the Relative Strength Index (RSI), which is wavering around the 50-neutral line and indicates that neither buyers nor sellers are gathering momentum.
However, price action shows a formation of a ‘double bottom,’ though XAG/USD might clear key resistance levels, to confirm its validity.
Silver buyers need to clear the downslope trendline drawn from May highs, which is around $30.00. Once done, the ‘double bottom neckline’ will emerge at $30.84, the June 21 high. If cleared, this would confirm the bullish chart pattern. On further strength, XAG/USD could test the May 29 high of $32.29, ahead of the year-to-date (YTD) high of $32.51.
On the flip side, if XAG/USD falls below $29.00, the next support would be the June 26 low of $28.57. Once cleared, the next stop would be the April 15 swing low of $ 27.59.
XAG/USD Price Action – Daily Chart
Fed FAQs
Monetary policy in the US is shaped by the Federal Reserve (Fed). The Fed has two mandates: to achieve price stability and foster full employment. Its primary tool to achieve these goals is by adjusting interest rates. When prices are rising too quickly and inflation is above the Fed’s 2% target, it raises interest rates, increasing borrowing costs throughout the economy. This results in a stronger US Dollar (USD) as it makes the US a more attractive place for international investors to park their money. When inflation falls below 2% or the Unemployment Rate is too high, the Fed may lower interest rates to encourage borrowing, which weighs on the Greenback.
The Federal Reserve (Fed) holds eight policy meetings a year, where the Federal Open Market Committee (FOMC) assesses economic conditions and makes monetary policy decisions. The FOMC is attended by twelve Fed officials – the seven members of the Board of Governors, the president of the Federal Reserve Bank of New York, and four of the remaining eleven regional Reserve Bank presidents, who serve one-year terms on a rotating basis.
In extreme situations, the Federal Reserve may resort to a policy named Quantitative Easing (QE). QE is the process by which the Fed substantially increases the flow of credit in a stuck financial system. It is a non-standard policy measure used during crises or when inflation is extremely low. It was the Fed’s weapon of choice during the Great Financial Crisis in 2008. It involves the Fed printing more Dollars and using them to buy high grade bonds from financial institutions. QE usually weakens the US Dollar.
Quantitative tightening (QT) is the reverse process of QE, whereby the Federal Reserve stops buying bonds from financial institutions and does not reinvest the principal from the bonds it holds maturing, to purchase new bonds. It is usually positive for the value of the US Dollar.
According to the New Zealand Institute of Economic Research (NZIER), Business Confidence aggregates revealed a further decline in business activity outlook surveys. NZIER noted that a full 35% of New Zealand firms expect the economic outlook to deteriorate on a seasonally-adjusted basis.
Firm trading activity declined, with 28% of respondents noting a decline in business activity through the June quarter.
According to Christina Leung, NZIER's Deputy Chief Executive (Auckland) & Head of Membership Services, "With around 60 percent of mortgages due for repricing within the coming 12 months and the softening labour market, we expect these developments will weigh on consumer confidence and retail spending over the coming year. This environment of higher interest rates and heightened uncertainty about the outlook has made businesses much more cautious about hiring and investment."
Economic Indicator
NZIER Business Confidence (QoQ)
The NZIER Business Confidence released by the New Zealand Institute of Economic Research shows the business outlook in New Zealand. The Business Confidence allows analysis of economic situation in the short term. Increasing numbers indicates increases in business investment that lead to higher levels of output. Thus, a high reading is seen as positive (or bullish), while a low reading is seen as negative (or bearish).
Read more.Last release: Mon Jul 01, 2024 22:00
Frequency: Quarterly
Actual: -44%
Consensus: -
Previous: -25%
About New Zealand NZIER Business Confidence (QoQ)
The NZIER Business Confidence released by the New Zealand Institute of Economic Research shows the business outlook in New Zealand. The Business Confidence allows analysis of economic situation in the short term. Increasing numbers indicates increases in business investment that lead to higher levels of output. Thus, a high reading is seen as positive (or bullish), while a low reading is seen as negative (or bearish).
New Zealand Dollar FAQs
The New Zealand Dollar (NZD), also known as the Kiwi, is a well-known traded currency among investors. Its value is broadly determined by the health of the New Zealand economy and the country’s central bank policy. Still, there are some unique particularities that also can make NZD move. The performance of the Chinese economy tends to move the Kiwi because China is New Zealand’s biggest trading partner. Bad news for the Chinese economy likely means less New Zealand exports to the country, hitting the economy and thus its currency. Another factor moving NZD is dairy prices as the dairy industry is New Zealand’s main export. High dairy prices boost export income, contributing positively to the economy and thus to the NZD.
The Reserve Bank of New Zealand (RBNZ) aims to achieve and maintain an inflation rate between 1% and 3% over the medium term, with a focus to keep it near the 2% mid-point. To this end, the bank sets an appropriate level of interest rates. When inflation is too high, the RBNZ will increase interest rates to cool the economy, but the move will also make bond yields higher, increasing investors’ appeal to invest in the country and thus boosting NZD. On the contrary, lower interest rates tend to weaken NZD. The so-called rate differential, or how rates in New Zealand are or are expected to be compared to the ones set by the US Federal Reserve, can also play a key role in moving the NZD/USD pair.
Macroeconomic data releases in New Zealand are key to assess the state of the economy and can impact the New Zealand Dollar’s (NZD) valuation. A strong economy, based on high economic growth, low unemployment and high confidence is good for NZD. High economic growth attracts foreign investment and may encourage the Reserve Bank of New Zealand to increase interest rates, if this economic strength comes together with elevated inflation. Conversely, if economic data is weak, NZD is likely to depreciate.
The New Zealand Dollar (NZD) tends to strengthen during risk-on periods, or when investors perceive that broader market risks are low and are optimistic about growth. This tends to lead to a more favorable outlook for commodities and so-called ‘commodity currencies’ such as the Kiwi. Conversely, NZD tends to weaken at times of market turbulence or economic uncertainty as investors tend to sell higher-risk assets and flee to the more-stable safe havens.
- NZD/JPY's bullish trajectory extends and rose near 98.80, setting fresh highs since 2007.
- Bulls start to show some signs of exhaustion.
- The robust bullish outlook is maintained, although a consolidation appears imminent.
On Monday, the NZD/JPY cross recorded a modest gain of 0.31%, pushing its value up to a high of 98.80 and then retreating to 98.10. This increase marks the pair's highest position in over a decade, further solidifying the ongoing bullish bias. However, due to the overbought conditions indicated by the daily Relative Strength Index (RSI), a necessary correction may be on the horizon.
The daily chart's RSI has tipped over into overbought territory, signaling the continued advance of the bullish run seen since last week. Although the bullish momentum is still the driving force in this pair, the Moving Average Convergence Divergence (MACD) is not generating green bars. This suggests that the current bullish pace may be leveling off.
NZD/JPY daily chart
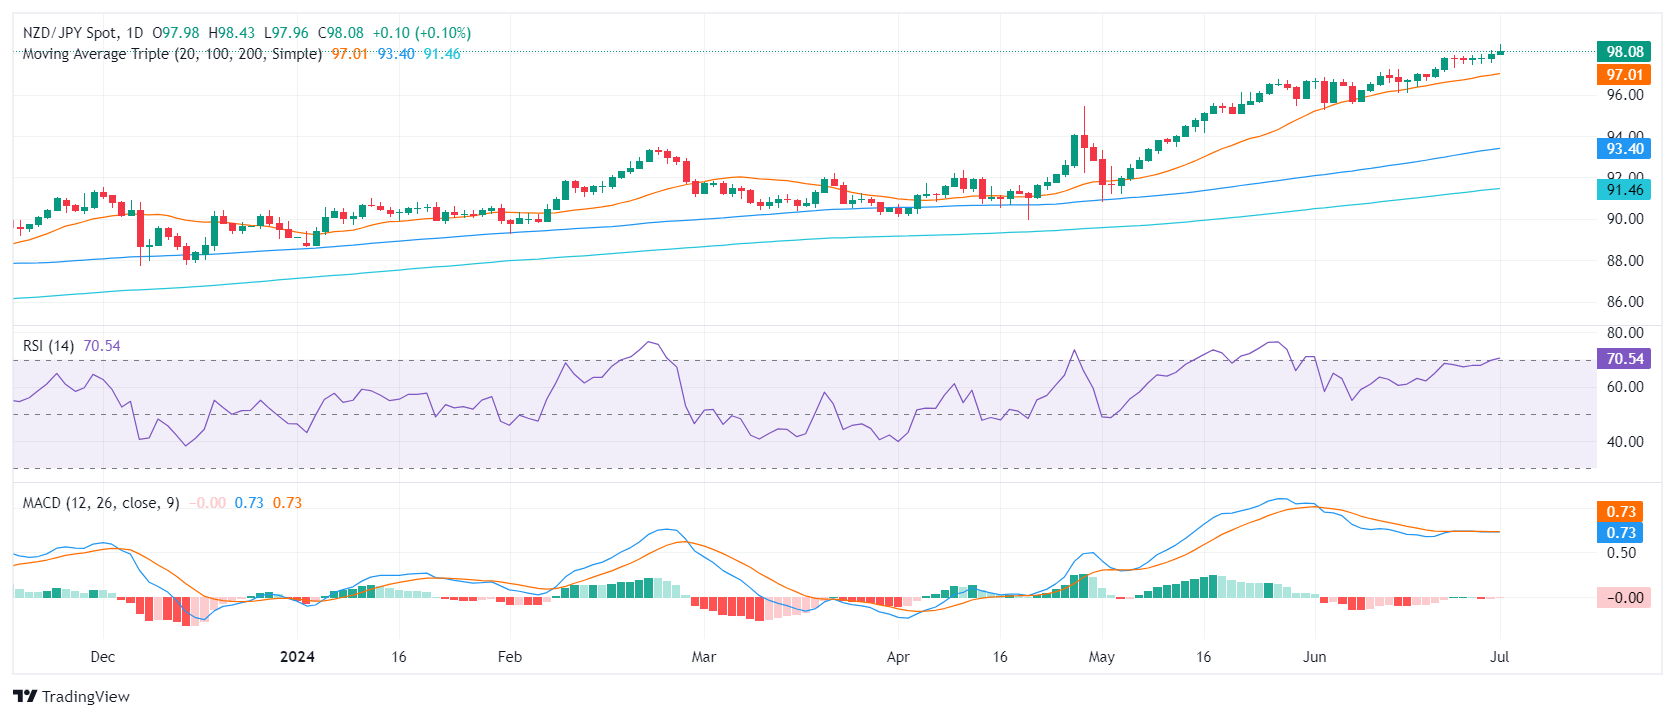
Moving forward, in case of a correction immediate support is now at 97.00 near the 20-day Simple Moving Average (SMA), with additional support at the previous low of 95.00. Buyers should now target the next psychological levels at 98.50 and 99.00 for additional resistance in case they have more gas left in their tanks.
- GBP/JPY marches to a fresh 16-year high above 204.00.
- Guppy taps highest bids since August of 2008.
- UK heads into Parliamentary elections later this week.
GBP/JPY tipped into yet another 16-year high on Monday, peaking at 204.75 as the Yen continues to deteriorate across the board. Investors are snubbing a continuous stream of intervention rhetoric from the Bank of Japan (BoJ) and Japan’s Ministry of Finance (MoF). With the BoJ stubbornly entrenched in a hyper-easy monetary policy stance, the Yen is set to continue declining as the interest rate differential between the Yen and other major currencies shows no signs of narrowing.
Economic data remains thin for both the Yen and the Pound Sterling this week, leaving GBP traders to focus on the UK’s upcoming Parliamentary elections slated for Thursday. Japan’s Tankan Large Manufacturing Index rose to 13.0 in Q2, up from the previous quarter’s 11.0.
Q1 UK Gross Domestic Product (GDP) rose to 0.7% QoQ last Friday, clipping above the forecast hold at 0.6%, bolstering the Pound Sterling. Japanese Tokyo Consumer Price Index (CPI) inflation also increased to 2.3% YoY through June compared to the previous 2.2%, but the figure wasn’t enough to spark any signs of hawkishness from the BoJ.
GBP/JPY technical outlook
The Guppy has accelerated into the top end as bidding pressure continues to build, clipping into a fresh 16-year peak at 204.75. GBP/JPY has closed in the green for eleven consecutive trading days.
The pair has climbed 14.55% bottom-to-top from 2024’s early low bids of 178.14, and one-sided price action has dragged GBP/JPY deep into bull country. The pair has no meaningful technical resistance levels overhead, and the pair is trading well into the north side of the 200-day Exponential Moving Average (EMA) at 190.35.
GBP/JPY hourly chart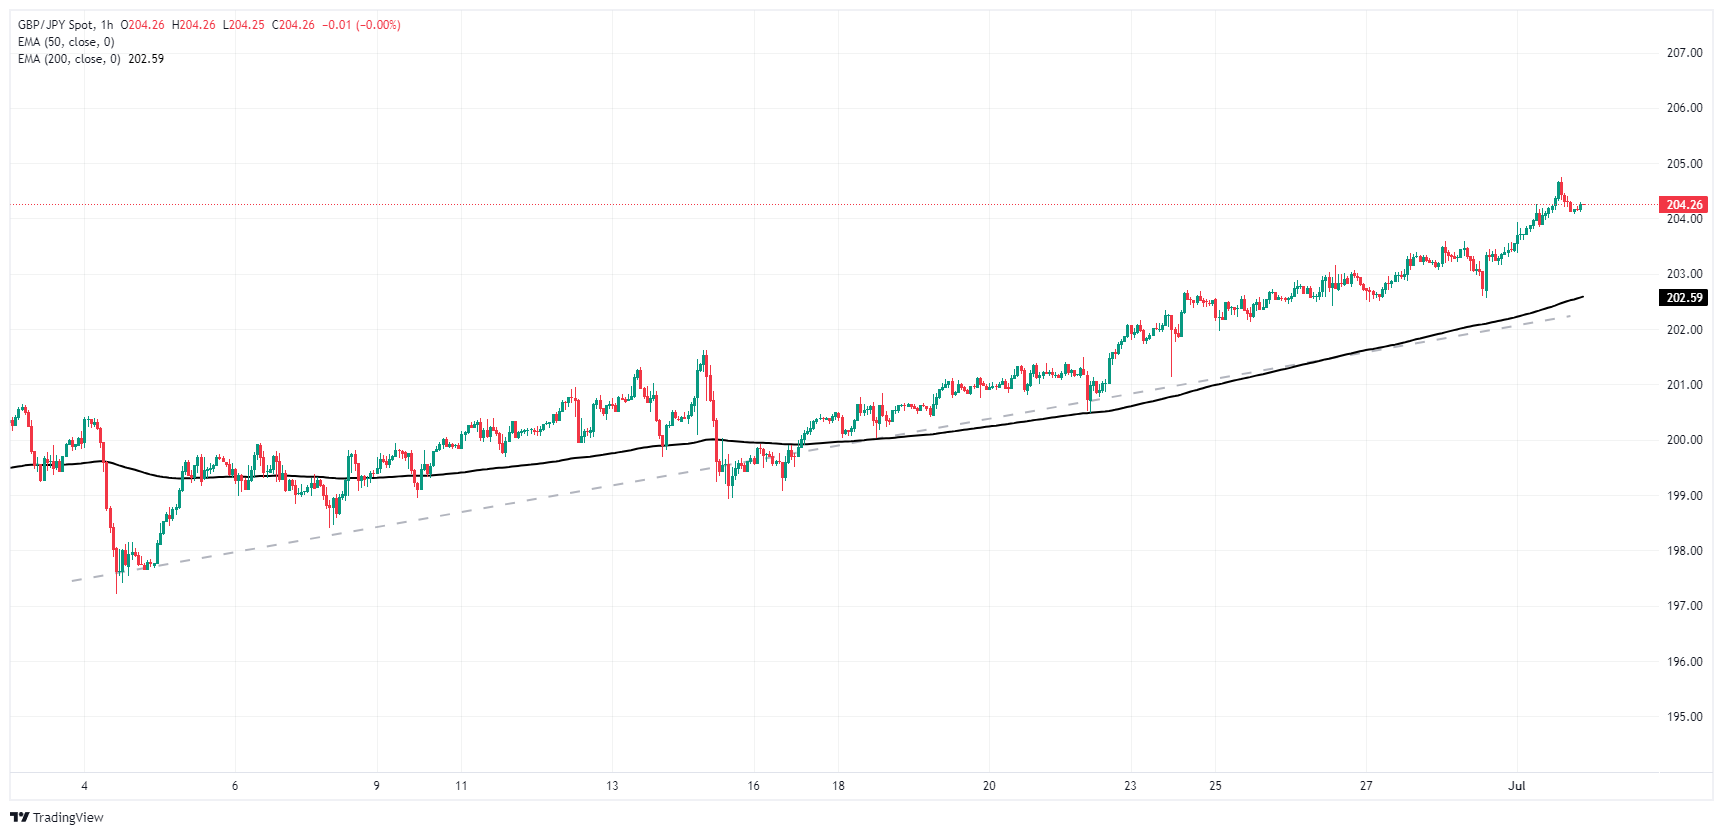
GBP/JPY daily chart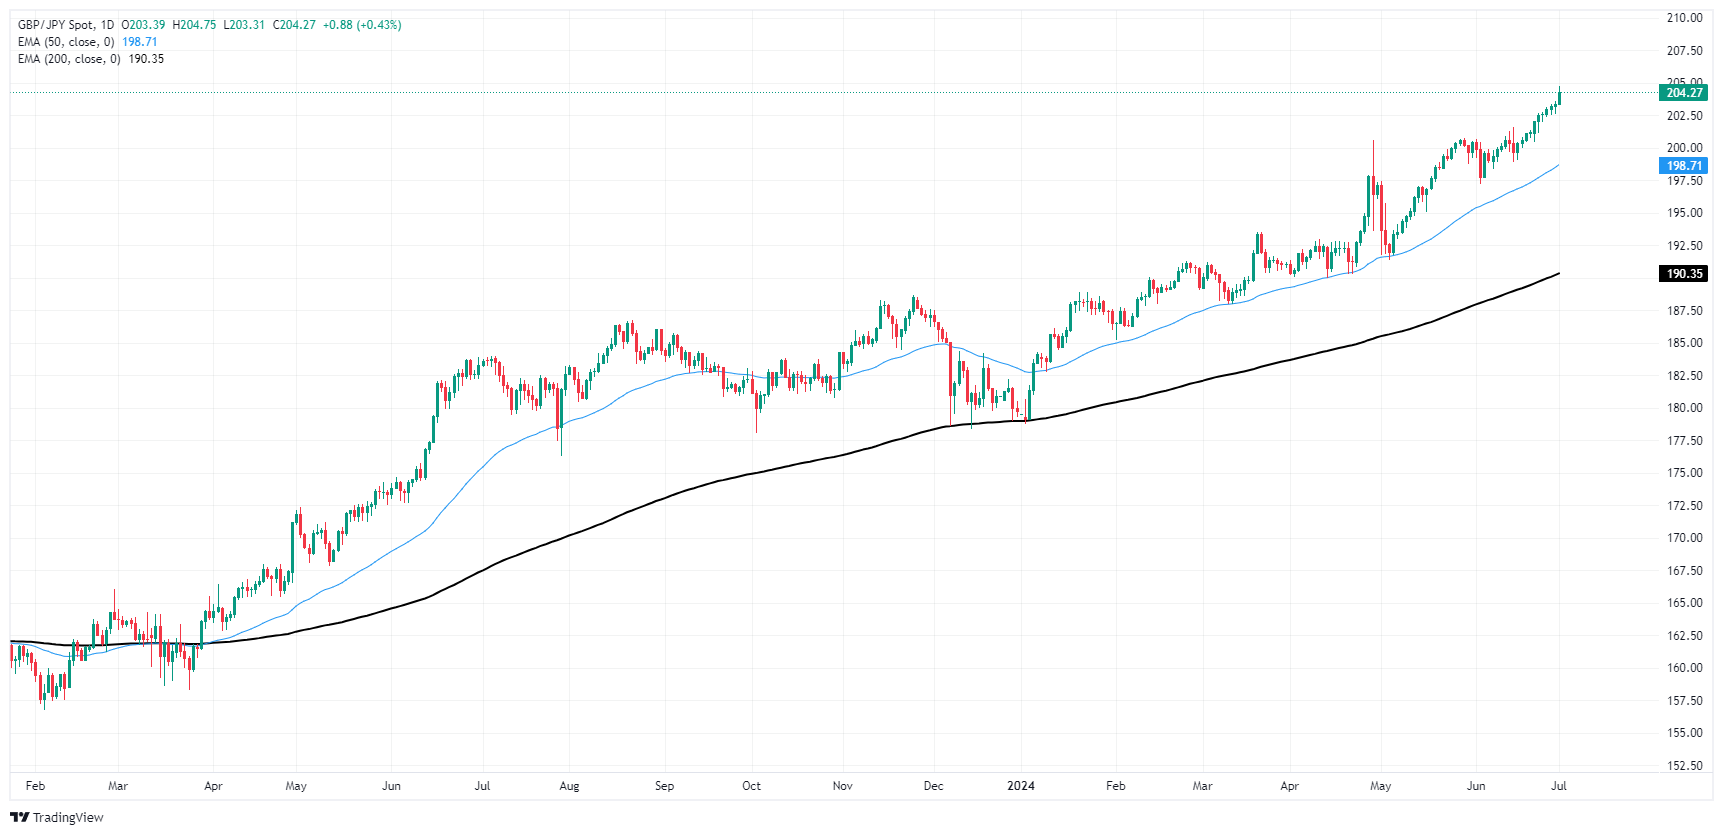
Pound Sterling FAQs
The Pound Sterling (GBP) is the oldest currency in the world (886 AD) and the official currency of the United Kingdom. It is the fourth most traded unit for foreign exchange (FX) in the world, accounting for 12% of all transactions, averaging $630 billion a day, according to 2022 data. Its key trading pairs are GBP/USD, aka ‘Cable’, which accounts for 11% of FX, GBP/JPY, or the ‘Dragon’ as it is known by traders (3%), and EUR/GBP (2%). The Pound Sterling is issued by the Bank of England (BoE).
The single most important factor influencing the value of the Pound Sterling is monetary policy decided by the Bank of England. The BoE bases its decisions on whether it has achieved its primary goal of “price stability” – a steady inflation rate of around 2%. Its primary tool for achieving this is the adjustment of interest rates. When inflation is too high, the BoE will try to rein it in by raising interest rates, making it more expensive for people and businesses to access credit. This is generally positive for GBP, as higher interest rates make the UK a more attractive place for global investors to park their money. When inflation falls too low it is a sign economic growth is slowing. In this scenario, the BoE will consider lowering interest rates to cheapen credit so businesses will borrow more to invest in growth-generating projects.
Data releases gauge the health of the economy and can impact the value of the Pound Sterling. Indicators such as GDP, Manufacturing and Services PMIs, and employment can all influence the direction of the GBP. A strong economy is good for Sterling. Not only does it attract more foreign investment but it may encourage the BoE to put up interest rates, which will directly strengthen GBP. Otherwise, if economic data is weak, the Pound Sterling is likely to fall.
Another significant data release for the Pound Sterling is the Trade Balance. This indicator measures the difference between what a country earns from its exports and what it spends on imports over a given period. If a country produces highly sought-after exports, its currency will benefit purely from the extra demand created from foreign buyers seeking to purchase these goods. Therefore, a positive net Trade Balance strengthens a currency and vice versa for a negative balance.
- USD/JPY rises to 0.38%, pushed by higher US Treasury yields and weak ISM data.
- Resistance levels: 162.00, 163.00, 164.87 (Nov 1986 high).
- Support points: 160.22 (April 29 high), 155.66 (Tenkan Sen), 158.90 (Senkou Span A).
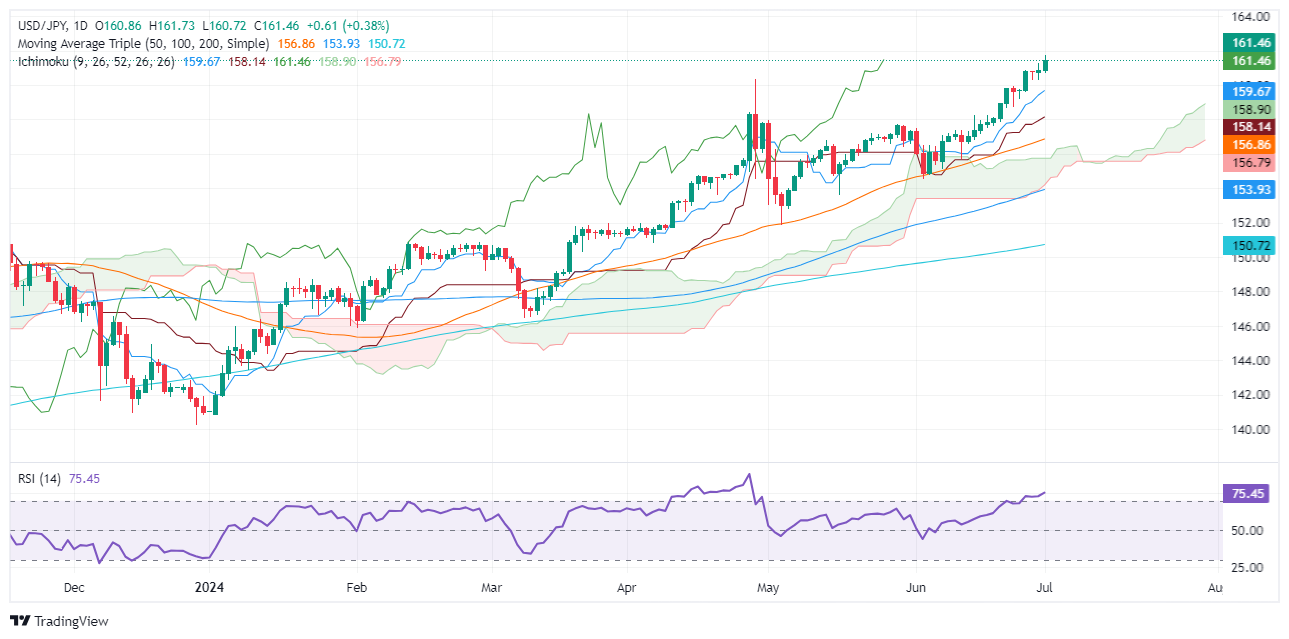
The USD/JPY has broken the 161.00 barrier as US Treasury bond yields climbed sharply on Monday after US economic data showed that manufacturing activity, as measured by the ISM PMI, contracted for the third straight month in June. The pair trades at 161.49, gains 0.38%.
USD/JPY Price Analysis: Technical outlook
The major is upward biased, and Japanese authorities and the Bank of Japan (BoJ) lack of action could propel the USD/JPY higher. Despite that, the next key resistance level would be the November 1986 monthly high of 164.87, but traders must reclaim key resistance levels on their way north.
Momentum favors buyers, even though the Relative Strength Index (RSI) is overbought, but due to the nature of a strong move, the most extreme condition would be the 80 level.
With that said, the USD/JPY first resistance would be 162.00, followed by the 163.00 mark. A breach of the latter will expose 164.00 and November’s 1986 high.
Conversely, if sellers drag the exchange rates below 161.00, the first support would be the April 29 high at 160.22. Once hurdle, the next line of defense for bulls would be the Tenkan Sen at 155.66, followed by the Senkou Span A at 158.90.
USD/JPY Price Action – Daily Chart
Japanese Yen FAQs
The Japanese Yen (JPY) is one of the world’s most traded currencies. Its value is broadly determined by the performance of the Japanese economy, but more specifically by the Bank of Japan’s policy, the differential between Japanese and US bond yields, or risk sentiment among traders, among other factors.
One of the Bank of Japan’s mandates is currency control, so its moves are key for the Yen. The BoJ has directly intervened in currency markets sometimes, generally to lower the value of the Yen, although it refrains from doing it often due to political concerns of its main trading partners. The current BoJ ultra-loose monetary policy, based on massive stimulus to the economy, has caused the Yen to depreciate against its main currency peers. This process has exacerbated more recently due to an increasing policy divergence between the Bank of Japan and other main central banks, which have opted to increase interest rates sharply to fight decades-high levels of inflation.
The BoJ’s stance of sticking to ultra-loose monetary policy has led to a widening policy divergence with other central banks, particularly with the US Federal Reserve. This supports a widening of the differential between the 10-year US and Japanese bonds, which favors the US Dollar against the Japanese Yen.
The Japanese Yen is often seen as a safe-haven investment. This means that in times of market stress, investors are more likely to put their money in the Japanese currency due to its supposed reliability and stability. Turbulent times are likely to strengthen the Yen’s value against other currencies seen as more risky to invest in.
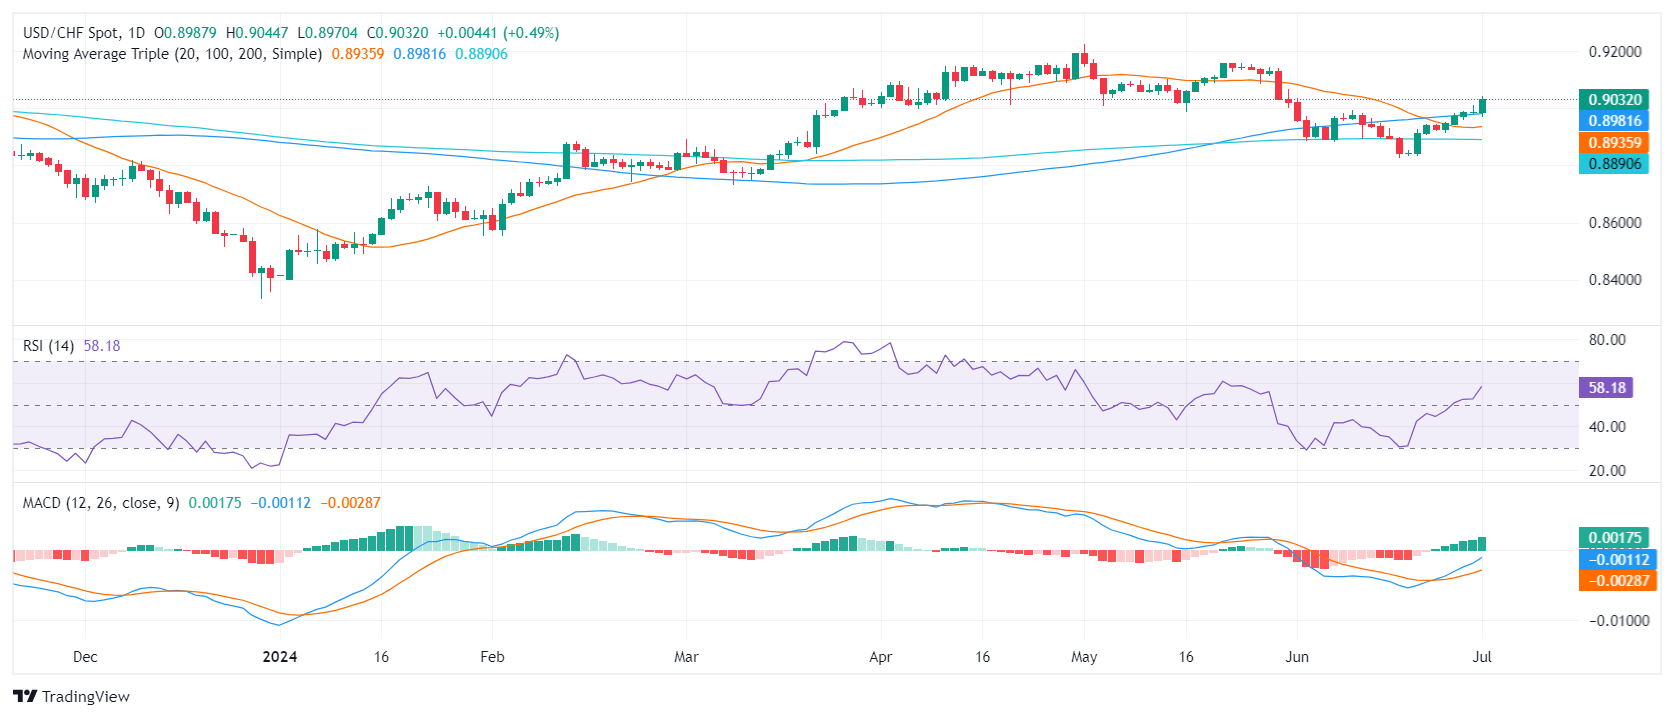
- USD/CHF rose to 0.9030, reaching late May's highs.
- Fresh ISM PMI data showed contraction in the US manufacturing sector activity for June.
- The market odds for a September interest-rate cut by both the Fed and Swiss SNB have increased in the last session.
On Monday, the USD/CHF pair rose significantly, driven by market anticipation of the Federal Open Market Committee (FOMC) minutes release and other key labor market figures from the US due later in the week. The major mover in the session was the ISM Manufacturing PMI from the US, which despite showing a continued contraction in the country's manufacturing sector the Greenback held its ground. US Treasury yields remain high and provide a cushion to the USD.
The spotlight of Monday was the slightly disappointing ISM Manufacturing PMI from the US for June. The PMI edged lower to 48.5 from 48.7 in April. The Employment Index of the PMI fell to 49.3 from 51.1 in May, while the New Orders Index improved to 49.3 from 45.4. The Prices Paid Index, the inflation component, dropped to 52.1 from 57 in the preceding period. As a result, the markets are betting on a 70% probability of a September interest rate cut by the Federal Reserve (Fed) but the bank’s officials aren’t entirely embracing the rate cuts.
In addition to the FOMC minutes, the US labor market figures are a highlight for this week, particularly Friday's June jobs data. Bloomberg consensus anticipates 190k compared to 272k in May. The unemployment rate is not expected to change from 4.0% despite a possible increase in the participation rate. The average hourly earnings are forecast to rise by 0.3% MoM, potentially pushing the YoY rate down to 3.9%. Markets will also pay attention to the ADP and JOLTs figures to be released on Tuesday and Wednesday.
On the other hand, The Swiss June Consumer Price Index (CPI), due to be reported on Thursday, is projected to remain stable at 1.4% YoY for the third consecutive month.
USD/CHF technical analysis
Regarding the technical analysis, the USD/CHF pair's outlook brightens. It has jumped to its highest level since late May, which along with a strong position above the 20, 100, and 200-day Simple Moving Average (SMA), lends a significantly positive outlook for the future. In addition, the pair tallied seven winning days out of the last eight which calls for a positive outlook.
USD/CHF daily chart
- Gold remains steady unaffected by rising US Dollar and Treasury yields.
- Mixed US manufacturing data: S&P PMI expands, ISM PMI contracts for third consecutive month.
- US 10-year Treasury yield climbs nearly 9 bps to 4.489%, bolstering Dollar's rebound.
Gold prices remain virtually unchanged on Monday even though the Greenback registers minuscule gains propelled by elevated US Treasury bond yields, following a release of softer-than-expected US economic data. That, along with a shortened week in observance of Independence Day in the US and an eventful week, keeps the XAU/USD trading within familiar levels at around $2,327 flat.
The US economy revealed business activity figures on the manufacturing front, with mixed readings. The S&P Global Manufacturing PMI stood at expansionary territory, contrary to the ISM one, which contracted for the third straight month in June.
Market participants remained cautious, with US equity indices performing mixed in the mid-North American session. Meanwhile, the US 10-year Treasury yield rose almost nine basis points to 4.489%, lending a lifeline to the Greenback, down 0.33% earlier in the day before staging a comeback, gaining 0.09%.
Traders are eyeing the Federal Reserve Chairman Jerome Powell's speech on Tuesday, followed by the Fed’s latest monetary policy minutes on Wednesday. After that, the US economic schedule will feature Services PMIs from S&P and the ISM, followed by Friday’s US Nonfarm Payrolls.
Daily digest market movers: Gold price prints minimal gains in post PMIs
- June’s US S&P Global Manufacturing PMI was 51.6, slightly higher than the previous month but missing the forecast of 51.7.
- ISM Manufacturing PMI for June was 48.5, lower than the estimates of 49.1 and down from May’s 48.7.
- According to the CME FedWatch Tool, odds for a 25-basis-point Fed rate cut in September are at 59.5%, up from 58.2% last Friday.
- The December 2024 fed funds rate futures contract implies that the Fed will ease policy by just 35 basis points (bps) toward the end of the year.
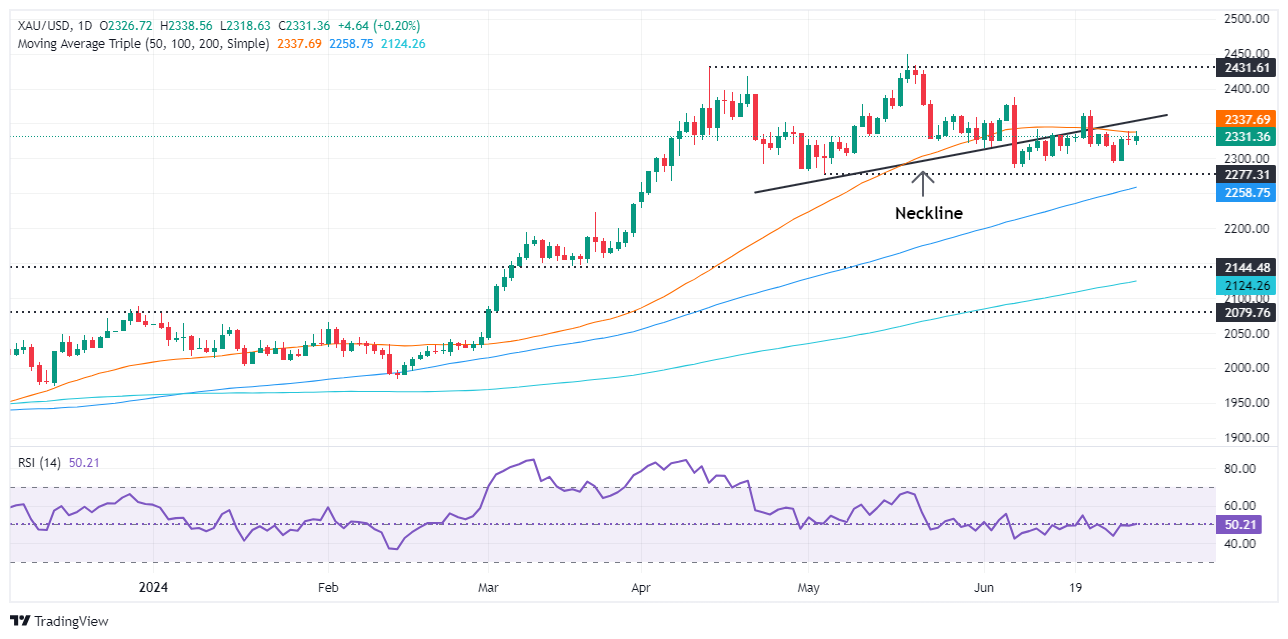
Technical analysis: Gold price hovers around Head-and-Shoulders neckline
Gold price remains upward biased, though consolidated near the Head-and-Shoulders neckline, at around $2,320-$2,350. Although the bearish chart pattern remains in play, momentum shifted neutral, with the Relative Strength Index (RSI) bracing to its 50-neutral line, hinting that neither buyers nor sellers are in control.
For a bearish continuation, sellers need to push prices below $2,300. Once done, the next support would be the May 3 low of $2,277, followed by the March 21 high of $2,222. Further losses lie underneath, with sellers eyeing the Head-and-Shoulders chart pattern objective from $2,170 to $2,160.
On the other hand, if buyers stepped in and conquered $2,350, that would expose additional key resistance levels like the June 7 cycle high of $2,387, ahead of challenging the $2,400 figure.
Gold FAQs
Gold has played a key role in human’s history as it has been widely used as a store of value and medium of exchange. Currently, apart from its shine and usage for jewelry, the precious metal is widely seen as a safe-haven asset, meaning that it is considered a good investment during turbulent times. Gold is also widely seen as a hedge against inflation and against depreciating currencies as it doesn’t rely on any specific issuer or government.
Central banks are the biggest Gold holders. In their aim to support their currencies in turbulent times, central banks tend to diversify their reserves and buy Gold to improve the perceived strength of the economy and the currency. High Gold reserves can be a source of trust for a country’s solvency. Central banks added 1,136 tonnes of Gold worth around $70 billion to their reserves in 2022, according to data from the World Gold Council. This is the highest yearly purchase since records began. Central banks from emerging economies such as China, India and Turkey are quickly increasing their Gold reserves.
Gold has an inverse correlation with the US Dollar and US Treasuries, which are both major reserve and safe-haven assets. When the Dollar depreciates, Gold tends to rise, enabling investors and central banks to diversify their assets in turbulent times. Gold is also inversely correlated with risk assets. A rally in the stock market tends to weaken Gold price, while sell-offs in riskier markets tend to favor the precious metal.
The price can move due to a wide range of factors. Geopolitical instability or fears of a deep recession can quickly make Gold price escalate due to its safe-haven status. As a yield-less asset, Gold tends to rise with lower interest rates, while higher cost of money usually weighs down on the yellow metal. Still, most moves depend on how the US Dollar (USD) behaves as the asset is priced in dollars (XAU/USD). A strong Dollar tends to keep the price of Gold controlled, whereas a weaker Dollar is likely to push Gold prices up.
European Central Bank (ECB) President Christine Lagarde expressed a need for caution from the ECB late Monday, highlighting that downside risks remain a threat despite a firm labor market.
Key highlights
A Soft landing for the euro zone economy is not guaranteed.
It will take time to be certain that inflation is on track.
A strong labour market means we have time to gather information.
The strong labor market allows the ECB to gather enough data.
European Central Bank (ECB) Governing Council member Pierre Wunsch noted late on Monday that it would take a notable turn in economic data to convince the ECB to deliver more than two more rate trims in 2024.
Key highlights
We would need convincing to cut more than twice this year.
The Transmission Protection Instrument is to be used if the situation is unwarranted or disorderly.
The ECB won't solve fiscal problems with the use of TPI.
A July cut is an option in theory, in practice we must be cautious.
Market pricing on the ECB rate path looks reasonable.
- WTI climbs nearly $3 per barrel amid Monday's Crude Oil surge.
- Crude rising on Middle East geopolitical tensions, fears of cross-border spillover.
- Obscure hopes for rising Crude Oil demand in the future also pressuring barrel bids.
West Texas Intermediate (WTI) US Crude Oil rose sharply on Monday, climbing nearly $2 per barrel, as energy markets found fresh bidding pressure amid ongoing Middle East geopolitical tensions and hopes that unseasonally hot temperatures across the US would bolster demand enough to eat up supply.
The Israel-Palestinian Hamas conflict continues to broil in Gaza, and Crude Oil markets are increasingly concerned that the altercation could spill over borders to drag neighboring countries that are critical to global energy production into the conflict. With Iran backing Palestinian Hamas, concerns are mounting that Israel may step too far in their campaign and cause Tehran to step into matters with military force, destabilizing global Crude Oil supply lines.
Crude Oil markets also hope that an impending increase in domestic US average temperatures will bolster fuel demand for cooling. Investors are expecting that an uptick in demand will help to sop up US Crude Oil production that continues to threaten to swamp out domestic supply lines.
Energy market expectations of future demand increases are running counter to the predictions of financial analysts, who anticipate prices to soften moving forward with one-year price forecasts expected to closely mirror recent price action.
WTI technical outlook
WTI US Crude Oil is accelerating into the high end on Monday, climbing $2 per barrel to kick off the new trading week. WTI pierced near-term technical resistance and broke into fresh nine-week peaks near $83.00. WTI has climbed nearly 15% from June’s early bottom bids near $72.50, gaining ten dollar per barrrel.
WTI is already on pace to close in the green for a fourth consecutive week, but with a long wait to Friday and a US holiday on the cards this week, there is still plenty of room for bulls to flub the bid, and send WTI back into $80.00 per barrel if momentum dried up.
WTI hourly chart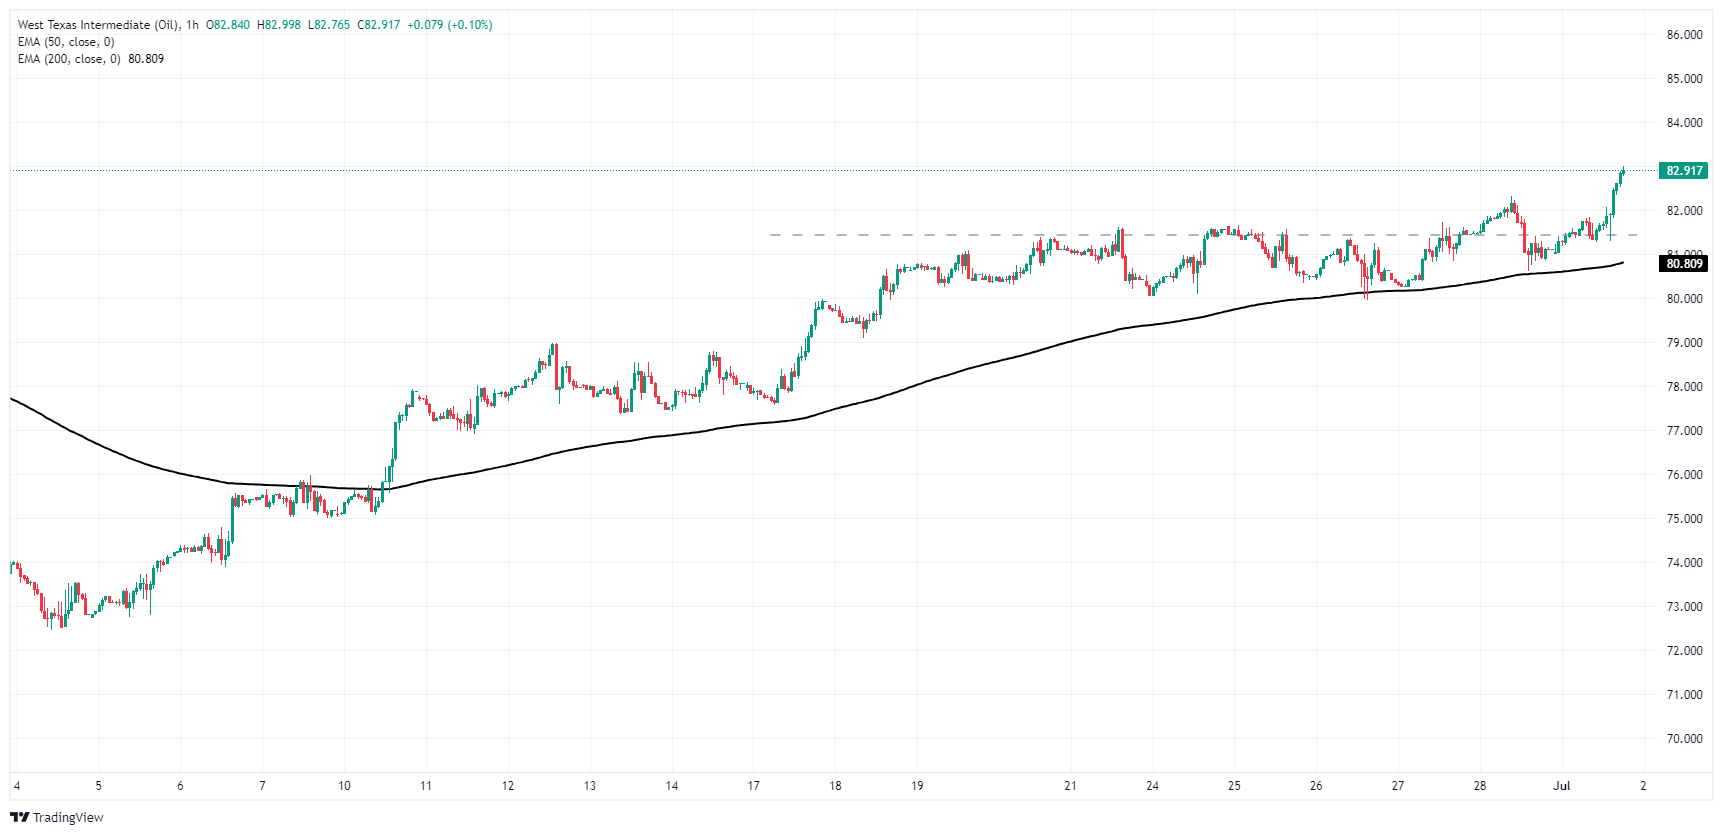
WTI daily chart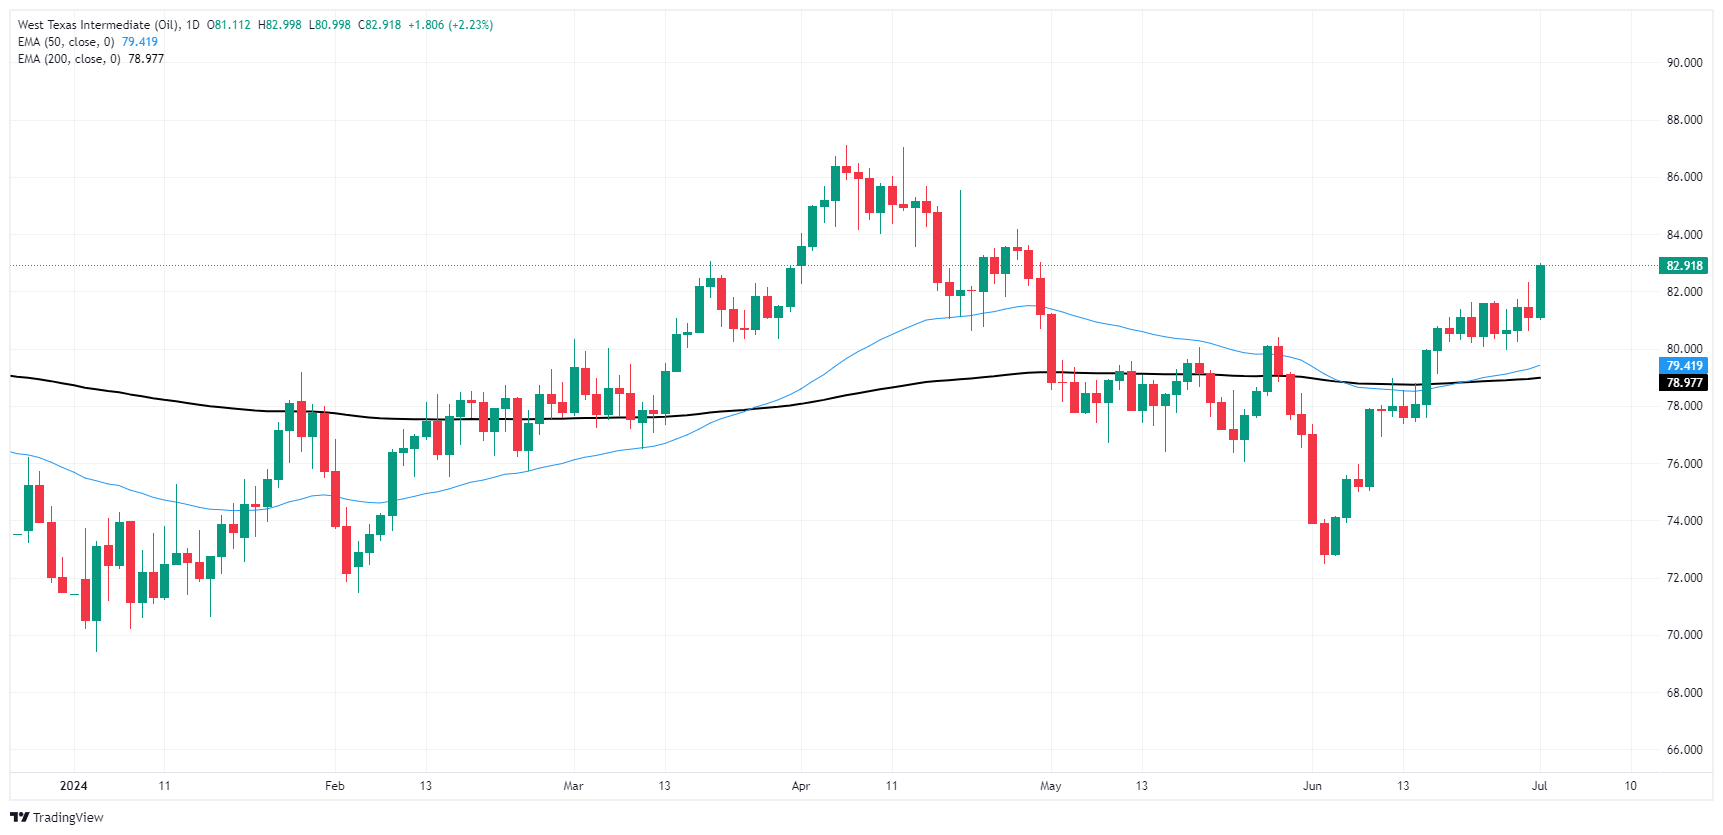
WTI Oil FAQs
WTI Oil is a type of Crude Oil sold on international markets. The WTI stands for West Texas Intermediate, one of three major types including Brent and Dubai Crude. WTI is also referred to as “light” and “sweet” because of its relatively low gravity and sulfur content respectively. It is considered a high quality Oil that is easily refined. It is sourced in the United States and distributed via the Cushing hub, which is considered “The Pipeline Crossroads of the World”. It is a benchmark for the Oil market and WTI price is frequently quoted in the media.
Like all assets, supply and demand are the key drivers of WTI Oil price. As such, global growth can be a driver of increased demand and vice versa for weak global growth. Political instability, wars, and sanctions can disrupt supply and impact prices. The decisions of OPEC, a group of major Oil-producing countries, is another key driver of price. The value of the US Dollar influences the price of WTI Crude Oil, since Oil is predominantly traded in US Dollars, thus a weaker US Dollar can make Oil more affordable and vice versa.
The weekly Oil inventory reports published by the American Petroleum Institute (API) and the Energy Information Agency (EIA) impact the price of WTI Oil. Changes in inventories reflect fluctuating supply and demand. If the data shows a drop in inventories it can indicate increased demand, pushing up Oil price. Higher inventories can reflect increased supply, pushing down prices. API’s report is published every Tuesday and EIA’s the day after. Their results are usually similar, falling within 1% of each other 75% of the time. The EIA data is considered more reliable, since it is a government agency.
OPEC (Organization of the Petroleum Exporting Countries) is a group of 13 Oil-producing nations who collectively decide production quotas for member countries at twice-yearly meetings. Their decisions often impact WTI Oil prices. When OPEC decides to lower quotas, it can tighten supply, pushing up Oil prices. When OPEC increases production, it has the opposite effect. OPEC+ refers to an expanded group that includes ten extra non-OPEC members, the most notable of which is Russia.
- AUD/USD mildly declines to 0.6660 on Monday.
- Markets await latest RBA and Fed meeting minutes for additional guidance.
- On Monday, the US reported ISM PMIs that showed no surprises.
Monday's session recorded a moderate slip in the Australian Dollar (AUD) value against the US Dollar. As a result of persistently high inflation in Australia and some signs of softening in the US, meeting minutes from both the Federal Reserve (Fed) and the Reserve Bank of Australia (RBA) will be closely watched this week. Labor market figures from June from the US are also due.
The Australian economy demonstrates some signs of weakness. However, the stubbornly high inflation is prompting the RBA to delay potential rate cuts. The RBA is one of the last G10 country central banks expected to issue rate cuts. This delay might further strengthen the Aussie.
Daily digest market movers: Aussie observes slight losses as market holds breath for packed week
- Australian Dollar's value saw a slight increase because of the stubbornly high inflation figures that prevent the RBA from initiating rate cuts.
- Market predicts around 40% odds of a 25-basis-point rate hike on the September 24 RBA meeting, extending to 50% leading up to November 5.
- In Australia, the May's Retail Sales data will be closely observed, which is scheduled for release on Wednesday. The expectation is for a 0.3% MoM rise compared with 0.1% in April.
- Prospect of a Fed interest rate cut in September is now at 70% and will be guided by the data in the week ahead and Powell’s speech on Tuesday.
Technical analysis: AUD/USD sways between 0.6600-0.6700
From a technical outlook, the AUD/USD pair has been trading sideways since mid-May in the 0.6600-0.6700 range. Traders on either side are struggling to dominate the direction, while indicators remain flat. The 20-day Simple Moving Average (SMA) at 0.6640 is acting as a robust support level, with further support seen below at 0.6620 and 0.6600. Descriptive resistance levels are situated at 0.6660, 0.6690, and 0.6700.
Australian Dollar FAQs
One of the most significant factors for the Australian Dollar (AUD) is the level of interest rates set by the Reserve Bank of Australia (RBA). Because Australia is a resource-rich country another key driver is the price of its biggest export, Iron Ore. The health of the Chinese economy, its largest trading partner, is a factor, as well as inflation in Australia, its growth rate and Trade Balance. Market sentiment – whether investors are taking on more risky assets (risk-on) or seeking safe-havens (risk-off) – is also a factor, with risk-on positive for AUD.
The Reserve Bank of Australia (RBA) influences the Australian Dollar (AUD) by setting the level of interest rates that Australian banks can lend to each other. This influences the level of interest rates in the economy as a whole. The main goal of the RBA is to maintain a stable inflation rate of 2-3% by adjusting interest rates up or down. Relatively high interest rates compared to other major central banks support the AUD, and the opposite for relatively low. The RBA can also use quantitative easing and tightening to influence credit conditions, with the former AUD-negative and the latter AUD-positive.
China is Australia’s largest trading partner so the health of the Chinese economy is a major influence on the value of the Australian Dollar (AUD). When the Chinese economy is doing well it purchases more raw materials, goods and services from Australia, lifting demand for the AUD, and pushing up its value. The opposite is the case when the Chinese economy is not growing as fast as expected. Positive or negative surprises in Chinese growth data, therefore, often have a direct impact on the Australian Dollar and its pairs.
Iron Ore is Australia’s largest export, accounting for $118 billion a year according to data from 2021, with China as its primary destination. The price of Iron Ore, therefore, can be a driver of the Australian Dollar. Generally, if the price of Iron Ore rises, AUD also goes up, as aggregate demand for the currency increases. The opposite is the case if the price of Iron Ore falls. Higher Iron Ore prices also tend to result in a greater likelihood of a positive Trade Balance for Australia, which is also positive of the AUD.
The Trade Balance, which is the difference between what a country earns from its exports versus what it pays for its imports, is another factor that can influence the value of the Australian Dollar. If Australia produces highly sought after exports, then its currency will gain in value purely from the surplus demand created from foreign buyers seeking to purchase its exports versus what it spends to purchase imports. Therefore, a positive net Trade Balance strengthens the AUD, with the opposite effect if the Trade Balance is negative.
The Greenback managed to stage a comeback after a pessimistic start to the week amidst a generalized appetite for the risk complex and rising prudence prior to the speech by Chair Powell, and the ECB’s Lagarde on Tuesday.
Here is what you need to know on Tuesday, July 2:
The USD Index (DXY) left behind two consecutive sessions of losses and refocused on the key 106.00 barrier. The Fed’s Chair J. Powell will participate at an event at the ECB Forum in Portugal. On the docket, the RCM/TIPP Economic Optimism Index is only due on July 2.
EUR/USD kept its constructive stance well in place and rose to three-week tops around 1.0780 as investors assessed the results from the French snap elections on Sunday. On July 2, preliminary Inflation Rate in the euro bloc is expected prior to the speech by the ECB’s C. Lagarde at the bank’s forum in Sintra (Portugal).
GBP/USD gave away an earlier move to the area just past the 1.2700 hurdle on the back of the resumption of the buying interest in the US Dollar towards the end of the NA session. There will be no data releases across the Channel on July 2.
USD/JPY advanced further and reached new highs in the proximity of the 162.00 region. The Japanese docket will be empty on July 2.
The resurgence of the downward bias in AUD/USD left the pair navigating within the so far unchanged consolidative theme around 0.6650. The RBA Minutes are only expected in Oz on July 2.
Rising optimism regarding the start of the US driving season and supply fears in the second half of the year lifted WTI prices to new highs north of the $83.00 mark per barrel.
Gold prices remained stuck within their recent range near the $2,330 zone per ounce troy, while Silver prices rose for the third session in a row, although still below the key $30.00 mark per ounce.
- Mexican Peso dips, starting 2024’s second half on a weak note.
- Political uncertainty in Mexico and US election speculation fuel risk-aversion, overshadowing strong economic fundamentals.
- Banxico Governor Rodriguez Ceja maintains a dovish stance, noting economic resilience and openness to rate adjustments.
The Mexican Peso begins the second half of the year on the back foot against the US Dollar, tumbling more than 0.40% after posting its worst first semester since the COVID-19 pandemic. Investors' uncertainty hurts the Peso after the ruling political party, Morena, might control the Mexican Congress and push bills that threaten the status quo. The USD/MXN trades at 18.39 after hitting a daily low of 18.25.
Mexico’s currency would likely continue to be driven by domestic politics and threats that former US President Donald Trump could win November’s elections. Therefore, the Mexican Peso would be hurt by risk-aversion even though the economy remains solid. According to Goldman Sachs analyst Teresa Alves, “Mexico’s macroeconomic and FX fundamentals are in a healthier position now.”
Bank of Mexico (Banxico) Governor Victoria Rodriguez Ceja gave dovish responses to an interview by El Financiero. She emphasized, “The Mexican economy is in a solid position to face any external or internal challenges that may arise,” adding that volatility in Mexico’s financial markets had subsided, which caused a sharp depreciation of the Mexican currency in early June.
She mentioned that the Peso’s depreciation influenced the Governing Board from easing policy and said the progress in disinflation “allows us to continue discussing downward adjustments in our rate, and I consider that this is what we will be doing in our next monetary policy meetings.”
Consequently, the Peso extended its losses on Monday despite US economic data being softer.
Daily digest market movers: Mexican Peso edges lower on strong US Dollar
- Citibanamex survey reveals that economists are now expecting fewer rate cuts by the central bank. They have also revised the Gross Domestic Product (GDP) growth for 2024 downward from 2.2% to 2.1% YoY and anticipate the USD/MXN exchange rate will end the year at 18.70, up from the previously reported 18.00.
- Mexico’s Business Confidence deteriorated from 53.7 to 53 in June, according to the National Statistics Agency (INEGI).
- S&P Global Manufacturing PMI for June was 51.1, a tenth lower from May’s 51.2.
- June’s US S&P Global Manufacturing PMI was 51.6, higher than the previous month yet missing forecasts of 51.7.
- ISM Manufacturing PMI for June was 48.5, lower than estimates of 49.1 and May’s 48.7.
- Greenback’s recovery, as measured by the US Dollar Index (DXY), gains from 105.42 to 105.87, underpinning the USD/MXN pair.
- CME FedWatch Tool shows odds for a 25-basis-point Fed rate cut at 58.2%, down from 59.5% last Friday.
Technical analysis: Mexican Peso falls as USD/MXN rallies past 18.30
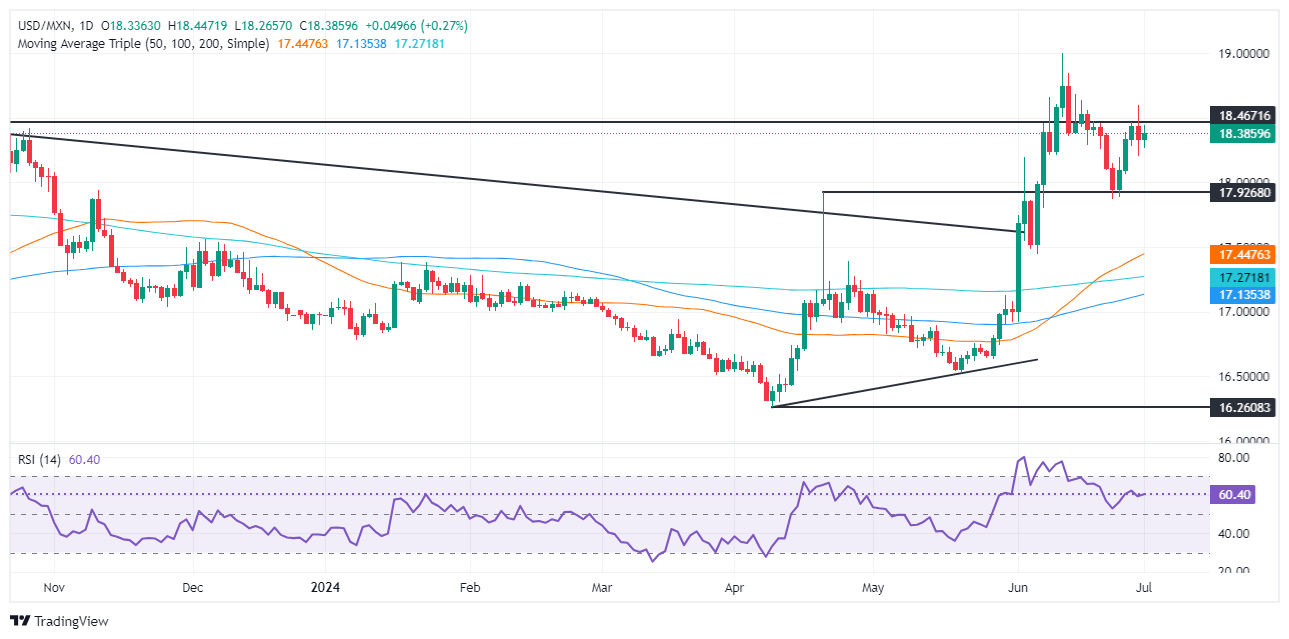
The USD/MXN is consolidating in the 18.00-18.40 range after hitting a daily low of 18.25. Momentum favors buyers, as shown by the Relative Strength Index (RSI) being bullish. Despite that, buyers must reclaim the June 28 high of 18.59 if they would like to extend their gains and challenge the year-to-date (YTD) high of 18.99.
In that event, further gains are seen, including the March 20, 2023, high of 19.23. Once cleared, it will expose 19.50.
For a bearish continuation, sellers must reclaim the April 19 high turned support at 18.15, which would pave the way toward 18.00. The next support would be the 50-day Simple Moving Average (SMA) at 17.37 before testing the 200-day SMA at 17.23.
Mexican Peso FAQs
The Mexican Peso (MXN) is the most traded currency among its Latin American peers. Its value is broadly determined by the performance of the Mexican economy, the country’s central bank’s policy, the amount of foreign investment in the country and even the levels of remittances sent by Mexicans who live abroad, particularly in the United States. Geopolitical trends can also move MXN: for example, the process of nearshoring – or the decision by some firms to relocate manufacturing capacity and supply chains closer to their home countries – is also seen as a catalyst for the Mexican currency as the country is considered a key manufacturing hub in the American continent. Another catalyst for MXN is Oil prices as Mexico is a key exporter of the commodity.
The main objective of Mexico’s central bank, also known as Banxico, is to maintain inflation at low and stable levels (at or close to its target of 3%, the midpoint in a tolerance band of between 2% and 4%). To this end, the bank sets an appropriate level of interest rates. When inflation is too high, Banxico will attempt to tame it by raising interest rates, making it more expensive for households and businesses to borrow money, thus cooling demand and the overall economy. Higher interest rates are generally positive for the Mexican Peso (MXN) as they lead to higher yields, making the country a more attractive place for investors. On the contrary, lower interest rates tend to weaken MXN.
Macroeconomic data releases are key to assess the state of the economy and can have an impact on the Mexican Peso (MXN) valuation. A strong Mexican economy, based on high economic growth, low unemployment and high confidence is good for MXN. Not only does it attract more foreign investment but it may encourage the Bank of Mexico (Banxico) to increase interest rates, particularly if this strength comes together with elevated inflation. However, if economic data is weak, MXN is likely to depreciate.
As an emerging-market currency, the Mexican Peso (MXN) tends to strive during risk-on periods, or when investors perceive that broader market risks are low and thus are eager to engage with investments that carry a higher risk. Conversely, MXN tends to weaken at times of market turbulence or economic uncertainty as investors tend to sell higher-risk assets and flee to the more-stable safe havens.
- Dow Jones kicks off the new trading week with overcorrection in both directions.
- US data missed the mark on Monday, sparking a brief rally on rate cut hopes.
- Too-big of a dip in US data, plus a muddy election outlook, reignites recession fears.
The Dow Jones Industrial Average (DJIA) briefly rallied on Monday after a broad miss in key US data sparked a risk rally on renewed rate cut hopes. Still, the steep decline in manufacturing figures proved too much for investors to stomach. Equities gave up early gains and tumbled back into the day’s opening range.
June’s US ISM Manufacturing Purchasing Managers Index (PMI) broadly missed the mark on Monday, ticking down to 48.5 from the previous 48.7 and missing the forecast step up to 49.1. The economic indicator has spent a third consecutive month below the key 50.0 level, flashing ongoing warning signs of a broader slowdown creeping up within the US domestic economy.
ISM Manufacturing Prices Paid also declined in June, tumbling to a six-month low of 52.1 from the previous 57.0, falling well below the forecast decline to 55.9. With inflationary pressures easing, US markets initially jumped at the outset of the new trading week as investors continue to hope for softening economic figures to push the Federal Reserve (Fed) into an accelerated pace of rate cuts. However, too-steep of a drag in US data points could easily tip the US into a recession that rate cuts won’t overcome, sparking risk-off fears and trimming Monday’s early gains.
Dow Jones news
The Dow Jones is split down the middle on Monday, with half of the index’s constituent securities in the red for the day. Merck & Co Inc. (MRK) leads the gainers, climbing 3.5% and gaining 4.3 points to trade into $128.11 per share. On the low side, Unitedhealth Group Inc. (UNH) fell back 2.66%, falling 13.78 points to $495.48 per share.
Dow Jones technical outlook
Sideways churn is the name of the game for the Dow Jones as the major equity index grinds out a rough near-term lateral channel. The DJIA is cycling just above the 39,000.00 handle as bidders refuse to let the Dow decline but lack the necessary momentum to reclaim higher chart territory.
Daily candles continue to churn out a growing consolidation pattern as the Dow Jones gets strung along the 50-day Exponential Moving Average (EMA) at 38,908.22. The DJIA continues to hold on the high side of late May’s bottom near 38,000.00, but topside momentum remains unable to recover ground back to all-time highs set just north of the 40,000.00 major price handle in May.
Dow Jones five minute chart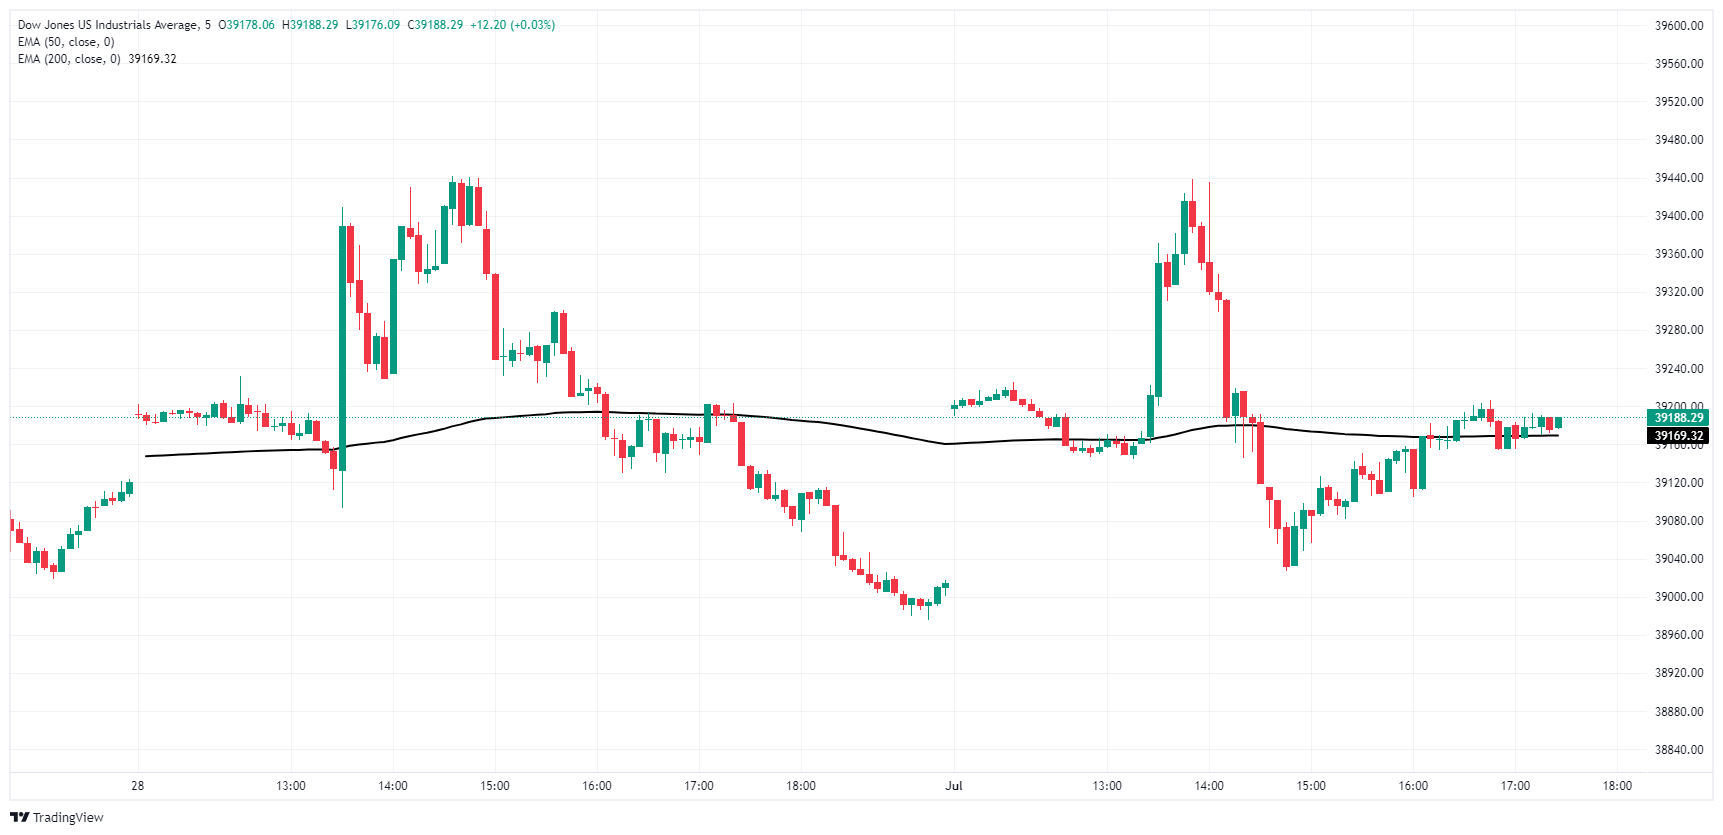
Dow Jones daily chart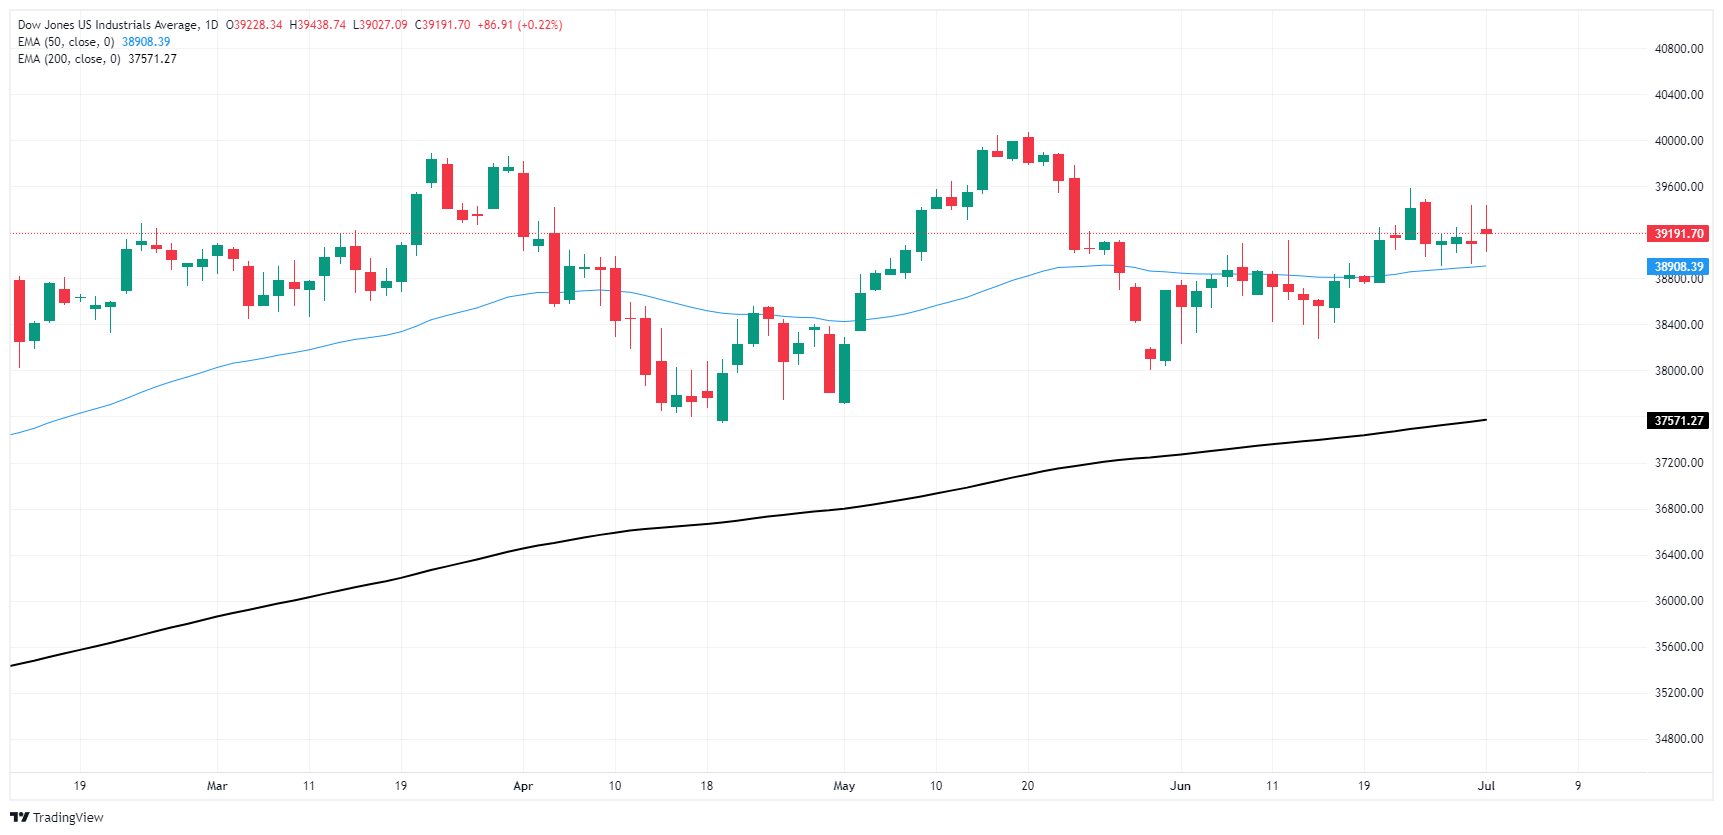
Dow Jones FAQs
The Dow Jones Industrial Average, one of the oldest stock market indices in the world, is compiled of the 30 most traded stocks in the US. The index is price-weighted rather than weighted by capitalization. It is calculated by summing the prices of the constituent stocks and dividing them by a factor, currently 0.152. The index was founded by Charles Dow, who also founded the Wall Street Journal. In later years it has been criticized for not being broadly representative enough because it only tracks 30 conglomerates, unlike broader indices such as the S&P 500.
Many different factors drive the Dow Jones Industrial Average (DJIA). The aggregate performance of the component companies revealed in quarterly company earnings reports is the main one. US and global macroeconomic data also contributes as it impacts on investor sentiment. The level of interest rates, set by the Federal Reserve (Fed), also influences the DJIA as it affects the cost of credit, on which many corporations are heavily reliant. Therefore, inflation can be a major driver as well as other metrics which impact the Fed decisions.
Dow Theory is a method for identifying the primary trend of the stock market developed by Charles Dow. A key step is to compare the direction of the Dow Jones Industrial Average (DJIA) and the Dow Jones Transportation Average (DJTA) and only follow trends where both are moving in the same direction. Volume is a confirmatory criteria. The theory uses elements of peak and trough analysis. Dow’s theory posits three trend phases: accumulation, when smart money starts buying or selling; public participation, when the wider public joins in; and distribution, when the smart money exits.
There are a number of ways to trade the DJIA. One is to use ETFs which allow investors to trade the DJIA as a single security, rather than having to buy shares in all 30 constituent companies. A leading example is the SPDR Dow Jones Industrial Average ETF (DIA). DJIA futures contracts enable traders to speculate on the future value of the index and Options provide the right, but not the obligation, to buy or sell the index at a predetermined price in the future. Mutual funds enable investors to buy a share of a diversified portfolio of DJIA stocks thus providing exposure to the overall index.
Gediminas Šimkus, head of the central bank of Lithuania and sitting member of the European Central Bank's (ECB) Governing Council, warned on Monday that despite decent odds of a few more rate cuts in 2024, a July rate cut is unlikely to materialize.
Key highlights
The case for a July interest-rate cut has gone.
Two more 2024 cuts are possible if the data is as expected.
I don't see disorderly moves in French bonds.
We shouldn't limit rate moves to projection meetings.
- US Dollar recovers after slight losses following ISM PMIs data.
- Dollar finds cushion on high US Treasury yields.
- Signs of disinflation have begun to surface in the US economic landscape, which might justify bringing cuts forward.
As the week begins, the US Dollar based on the DXY Index has cleared daily losses and currently sits near 105.90, following the recent ISM Manufacturing PMI figures. The sustained levels of high US Treasury yields continue to lend strength to the DXY.
Distinct signs of disinflation are beginning to emerge within the US economic climate, bolstering confidence among market players for a rate cut in September. Federal Reserve (Fed) officials, however, are treading carefully and continue to abide by their data-dependent stance.
Daily digest market movers: US Dollar recovers despite weak ISM PMIs, eyes on labor market data
- ISM Manufacturing PMI recorded a drop, shifting to 48.5 in June from 48.7 in April. This fell below the projected market expectation of 49.1.
- The Employment Index, part of the PMI survey, also marked a dip from 51.1 in May to 49.3.
- New Orders Index, on the other hand, witnessed an improvement from 45.4 to 49.3.
- High anticipation for the week comes for June's Nonfarm Payrolls to be released this Friday. According to Bloomberg's consensus, it is expected to be 190K versus 272K in May.
- Equally important will be Wednesday's report on ADP private sector jobs expected at 158K versus 152K in May.
- The release of May’s FOMC minutes will provide deeper insights into the Fed's cautious stance.
DXY technical outlook: Persistent positive momentum, index eyes higher levels
Maintaining a positive outlook, despite minor fluctuations, both the Relative Strength Index (RSI) and Moving Average Convergence Divergence (MACD) depict a stable terrain. The RSI continues to hold above 50 with a marginal flattening, while MACD sustains its green bar projections, indicating minor traction in the bullish momentum.
Resolutely above its 20, 100 and 200-day Simple Moving Averages (SMAs), the DXY continues trading in high levels observed since May, with the 106.50 and 106.00 zones in its sightline. However, observers should also keep an eye on the 105.50 and 105.00 zones in case of potential drawdowns.
Fed FAQs
Monetary policy in the US is shaped by the Federal Reserve (Fed). The Fed has two mandates: to achieve price stability and foster full employment. Its primary tool to achieve these goals is by adjusting interest rates. When prices are rising too quickly and inflation is above the Fed’s 2% target, it raises interest rates, increasing borrowing costs throughout the economy. This results in a stronger US Dollar (USD) as it makes the US a more attractive place for international investors to park their money. When inflation falls below 2% or the Unemployment Rate is too high, the Fed may lower interest rates to encourage borrowing, which weighs on the Greenback.
The Federal Reserve (Fed) holds eight policy meetings a year, where the Federal Open Market Committee (FOMC) assesses economic conditions and makes monetary policy decisions. The FOMC is attended by twelve Fed officials – the seven members of the Board of Governors, the president of the Federal Reserve Bank of New York, and four of the remaining eleven regional Reserve Bank presidents, who serve one-year terms on a rotating basis.
In extreme situations, the Federal Reserve may resort to a policy named Quantitative Easing (QE). QE is the process by which the Fed substantially increases the flow of credit in a stuck financial system. It is a non-standard policy measure used during crises or when inflation is extremely low. It was the Fed’s weapon of choice during the Great Financial Crisis in 2008. It involves the Fed printing more Dollars and using them to buy high grade bonds from financial institutions. QE usually weakens the US Dollar.
Quantitative tightening (QT) is the reverse process of QE, whereby the Federal Reserve stops buying bonds from financial institutions and does not reinvest the principal from the bonds it holds maturing, to purchase new bonds. It is usually positive for the value of the US Dollar.
- Canadian Dollar sheds half of a percent against the Greenback.
- Canada Day holiday leaves CAD markets in the dark for Monday.
- Canadian data remains limited this week until NFP Friday.
The Canadian Dollar (CAD) broadly retreated on Monday, as Canadian markets were dark for the Canada Day long weekend. CAD traders will be returning to the fold on Tuesday just in time for a fresh print of Canadian S&P Global Manufacturing Purchasing Managers Index (PMI) figures.
Canada has a largely empty dance card on this week’s economic calendar. Outside of Tuesday’s upcoming PMI print, little of note comes from the Canadian side until Friday’s labor figures, which will largely get drowned out by another round of US Nonfarm Payrolls (NFP).
Daily digest market movers: Canadian holiday leaves the CAD adrift
- Safe haven bids have broadly bolstered the US Dollar on Monday.
- Canadian Dollar takes pride of place as the single worst-performing major currency to kick off the new trading week.
- US ISM Manufacturing PMI figures for June printed worse than expected, backsliding to 48.5 from 48.7, missing the forecast uptick to 49.1.
- US ISM Manufacturing Price Paid, a measure of industry-level inflation expectations, retreated sharply in June, falling to 52.1 from 57.0, a far steeper drop than the forecast 55.9.
- Recession jitters are crimping risk appetite on Monday as wobbly US data prints tilt further into slowdown territory.
Canadian Dollar PRICE Today
The table below shows the percentage change of Canadian Dollar (CAD) against listed major currencies today. Canadian Dollar was the strongest against the Swiss Franc.
| USD | EUR | GBP | JPY | CAD | AUD | NZD | CHF | |
|---|---|---|---|---|---|---|---|---|
| USD | -0.15% | -0.08% | 0.45% | 0.46% | 0.20% | 0.37% | 0.60% | |
| EUR | 0.15% | -0.14% | 0.31% | 0.31% | 0.24% | 0.21% | 0.45% | |
| GBP | 0.08% | 0.14% | 0.43% | 0.47% | 0.39% | 0.36% | 0.61% | |
| JPY | -0.45% | -0.31% | -0.43% | 0.00% | -0.19% | -0.09% | 0.18% | |
| CAD | -0.46% | -0.31% | -0.47% | -0.01% | -0.22% | -0.10% | 0.14% | |
| AUD | -0.20% | -0.24% | -0.39% | 0.19% | 0.22% | -0.03% | 0.29% | |
| NZD | -0.37% | -0.21% | -0.36% | 0.09% | 0.10% | 0.03% | 0.27% | |
| CHF | -0.60% | -0.45% | -0.61% | -0.18% | -0.14% | -0.29% | -0.27% |
The heat map shows percentage changes of major currencies against each other. The base currency is picked from the left column, while the quote currency is picked from the top row. For example, if you pick the Canadian Dollar from the left column and move along the horizontal line to the US Dollar, the percentage change displayed in the box will represent CAD (base)/USD (quote).
Technical analysis: Canadian Dollar falls across the board, USD/CAD finds fresh highs
The Canadian Dollar (CAD) tumbled across the board on Monday, shedding around one-half of one percent against the US Dollar, Australian Dollar, and Pound Sterling. The CAD also shed a fifth of a percent against the Australian Dollar and around one-tenth of one percent against the Japanese Yen.
USD/CAD found a fresh multi-week high after testing into 1.3750 on Monday. The pair has recovered ground after bouncing from last week’s plunge below 1.3630. Still, intraday price action continues to trade on the rough side as the pair cycles the 200-hour Exponential Moving Average (EMA).
Daily candlesticks continue to find a foothold above the 50-day EMA at 1.3679, but bidding pressure will still need to gather enough steam to break north of June’s peak bids just shy of the 1.3800 handle.
USD/CAD hourly chart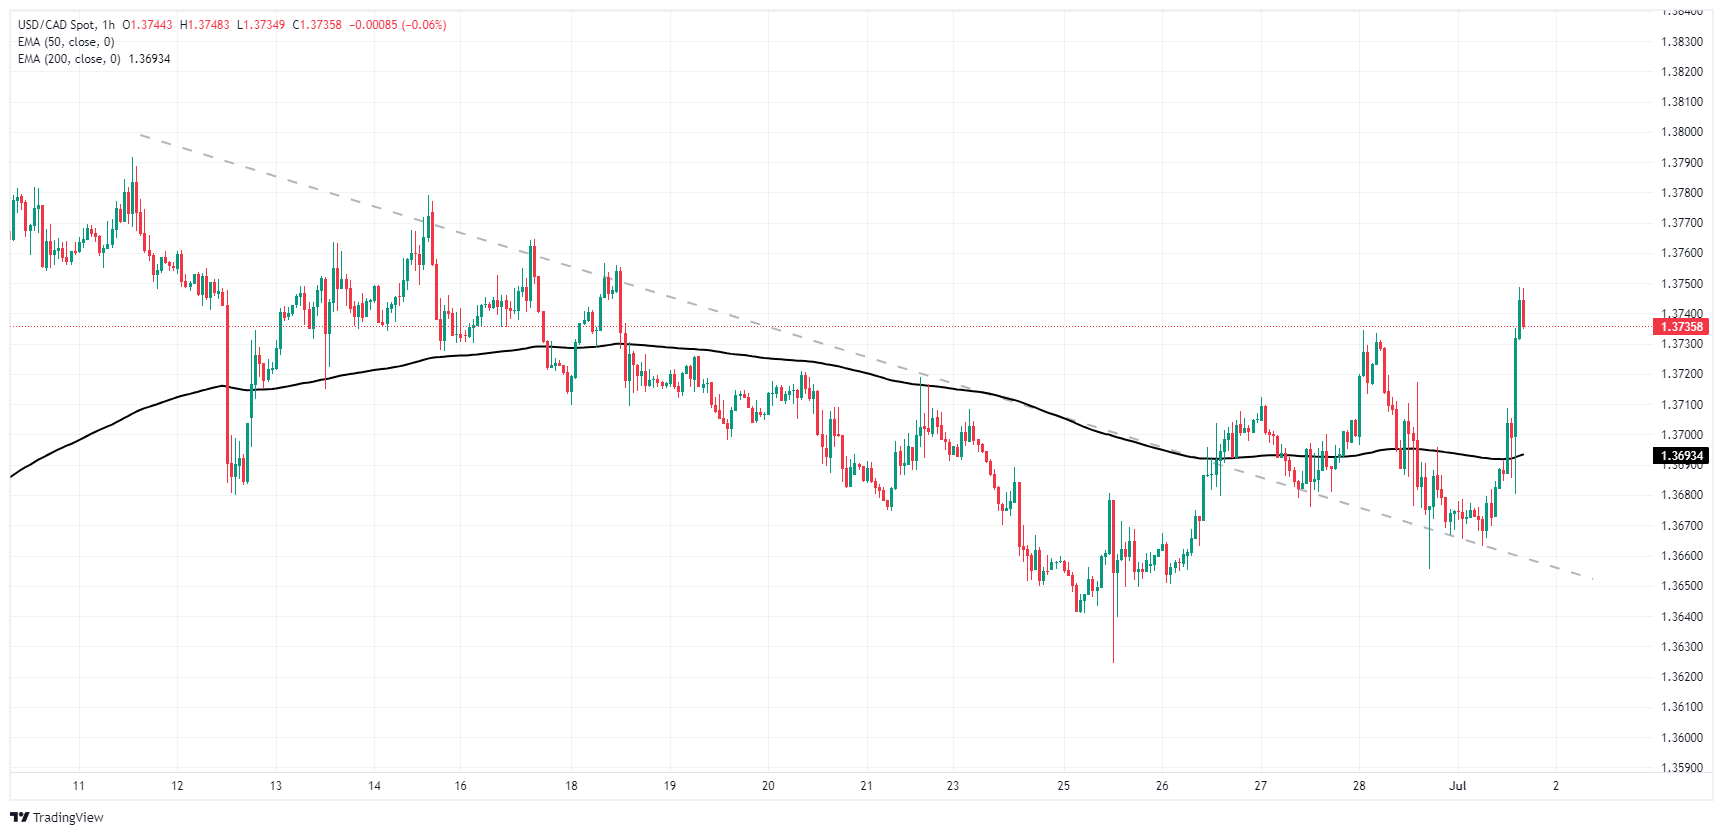
USD/CAD daily chart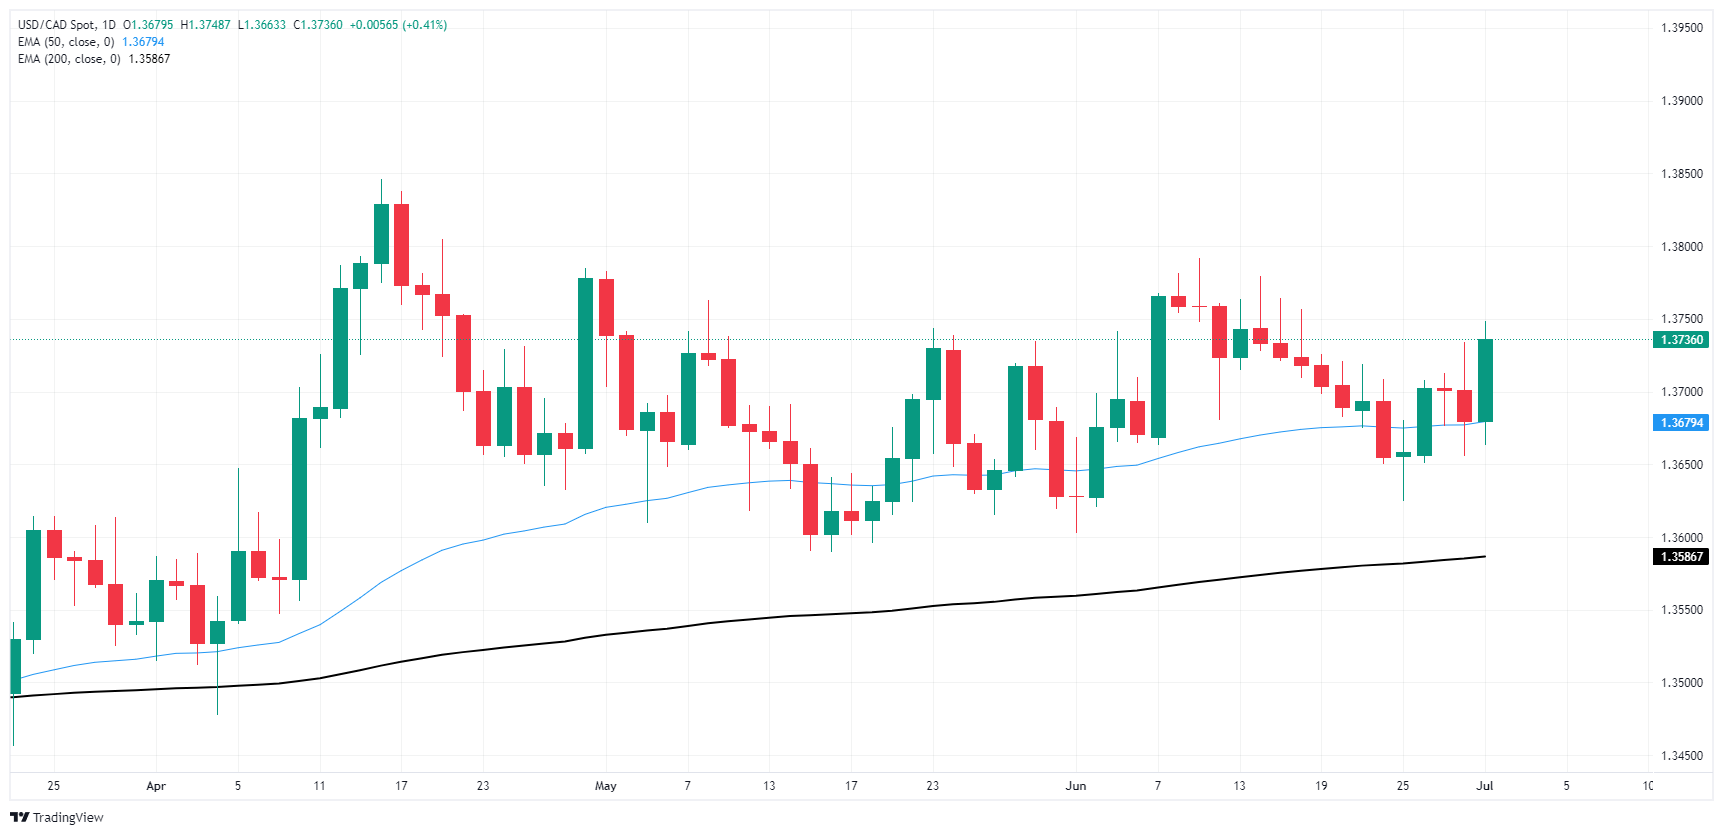
Canadian Dollar FAQs
The key factors driving the Canadian Dollar (CAD) are the level of interest rates set by the Bank of Canada (BoC), the price of Oil, Canada’s largest export, the health of its economy, inflation and the Trade Balance, which is the difference between the value of Canada’s exports versus its imports. Other factors include market sentiment – whether investors are taking on more risky assets (risk-on) or seeking safe-havens (risk-off) – with risk-on being CAD-positive. As its largest trading partner, the health of the US economy is also a key factor influencing the Canadian Dollar.
The Bank of Canada (BoC) has a significant influence on the Canadian Dollar by setting the level of interest rates that banks can lend to one another. This influences the level of interest rates for everyone. The main goal of the BoC is to maintain inflation at 1-3% by adjusting interest rates up or down. Relatively higher interest rates tend to be positive for the CAD. The Bank of Canada can also use quantitative easing and tightening to influence credit conditions, with the former CAD-negative and the latter CAD-positive.
The price of Oil is a key factor impacting the value of the Canadian Dollar. Petroleum is Canada’s biggest export, so Oil price tends to have an immediate impact on the CAD value. Generally, if Oil price rises CAD also goes up, as aggregate demand for the currency increases. The opposite is the case if the price of Oil falls. Higher Oil prices also tend to result in a greater likelihood of a positive Trade Balance, which is also supportive of the CAD.
While inflation had always traditionally been thought of as a negative factor for a currency since it lowers the value of money, the opposite has actually been the case in modern times with the relaxation of cross-border capital controls. Higher inflation tends to lead central banks to put up interest rates which attracts more capital inflows from global investors seeking a lucrative place to keep their money. This increases demand for the local currency, which in Canada’s case is the Canadian Dollar.
Macroeconomic data releases gauge the health of the economy and can have an impact on the Canadian Dollar. Indicators such as GDP, Manufacturing and Services PMIs, employment, and consumer sentiment surveys can all influence the direction of the CAD. A strong economy is good for the Canadian Dollar. Not only does it attract more foreign investment but it may encourage the Bank of Canada to put up interest rates, leading to a stronger currency. If economic data is weak, however, the CAD is likely to fall.
- EUR/GBP has risen and filled the price gap that was open between 0.8472 and 0.8490.
- There is a chance it may have completed its upside correction now and the downtrend could resume.
- A break below the June 28 low would help confirm a resumption lower.
EUR/GBP continues correcting back after bottoming at the 0.8398 June 14 lows. It has now filled a price gap on the charts (red shaded area) increasing the odds the correction may be near to completion.
EUR/GBP Daily Chart
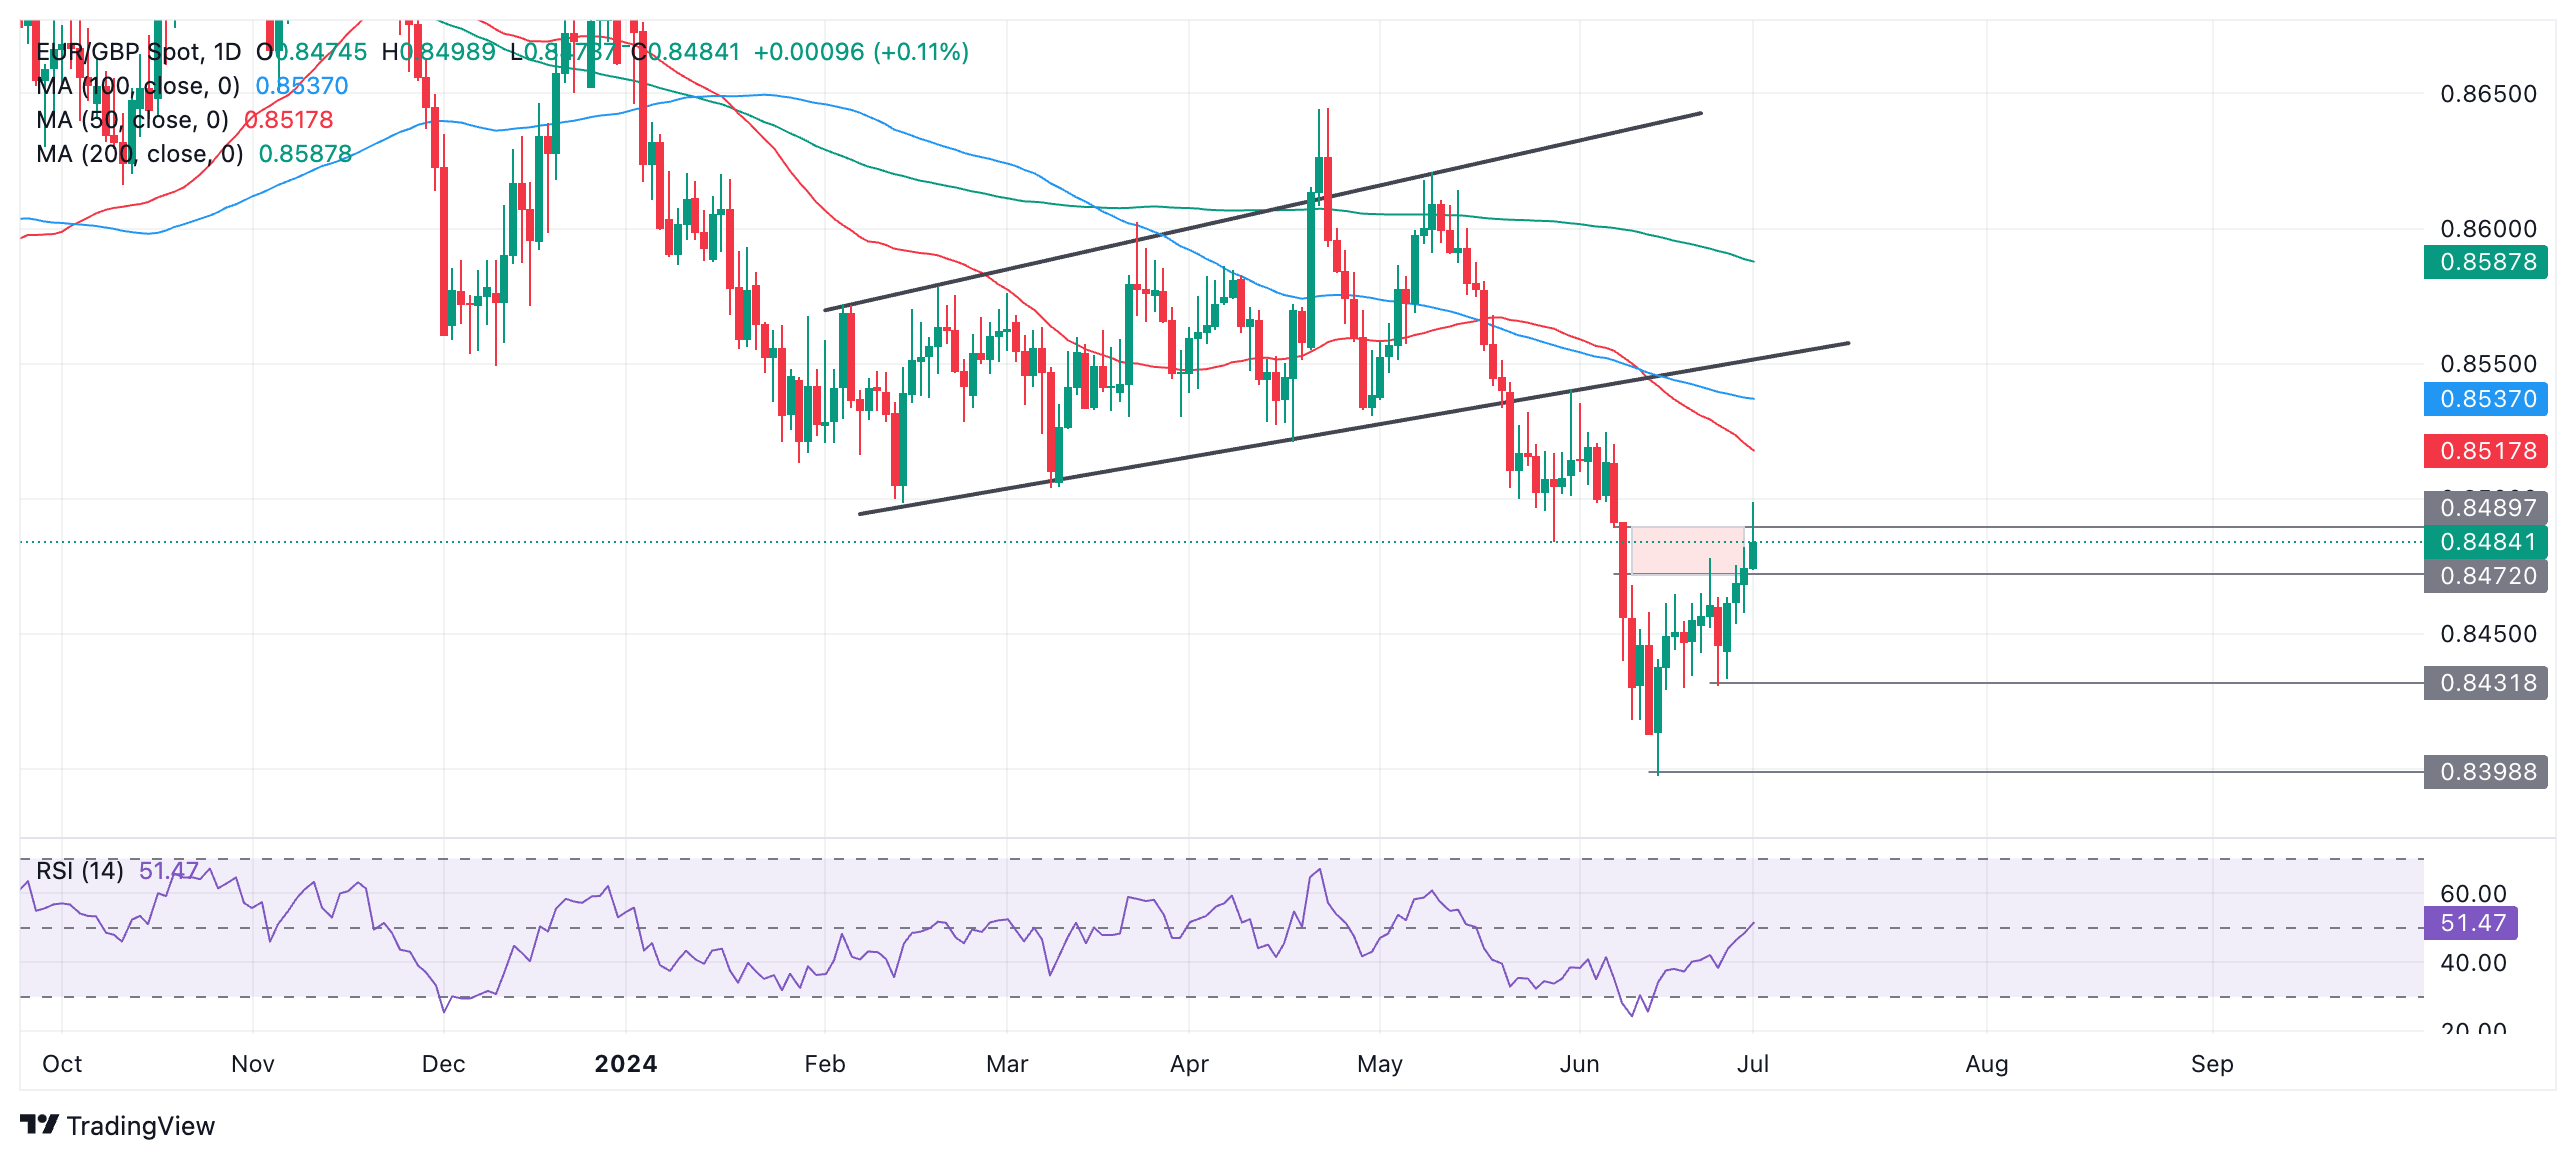
Given the pair appears to be in a medium-term downtrend and “the trend is your friend” it will probably resume moving lower once the pull-back runs out of steam. A break below 0.8447 (June 28 low) would help confirm such a resumption.
The initial target for a move lower would be the 0.8399 June 14 low.
EUR/GBP 4-hour Chart
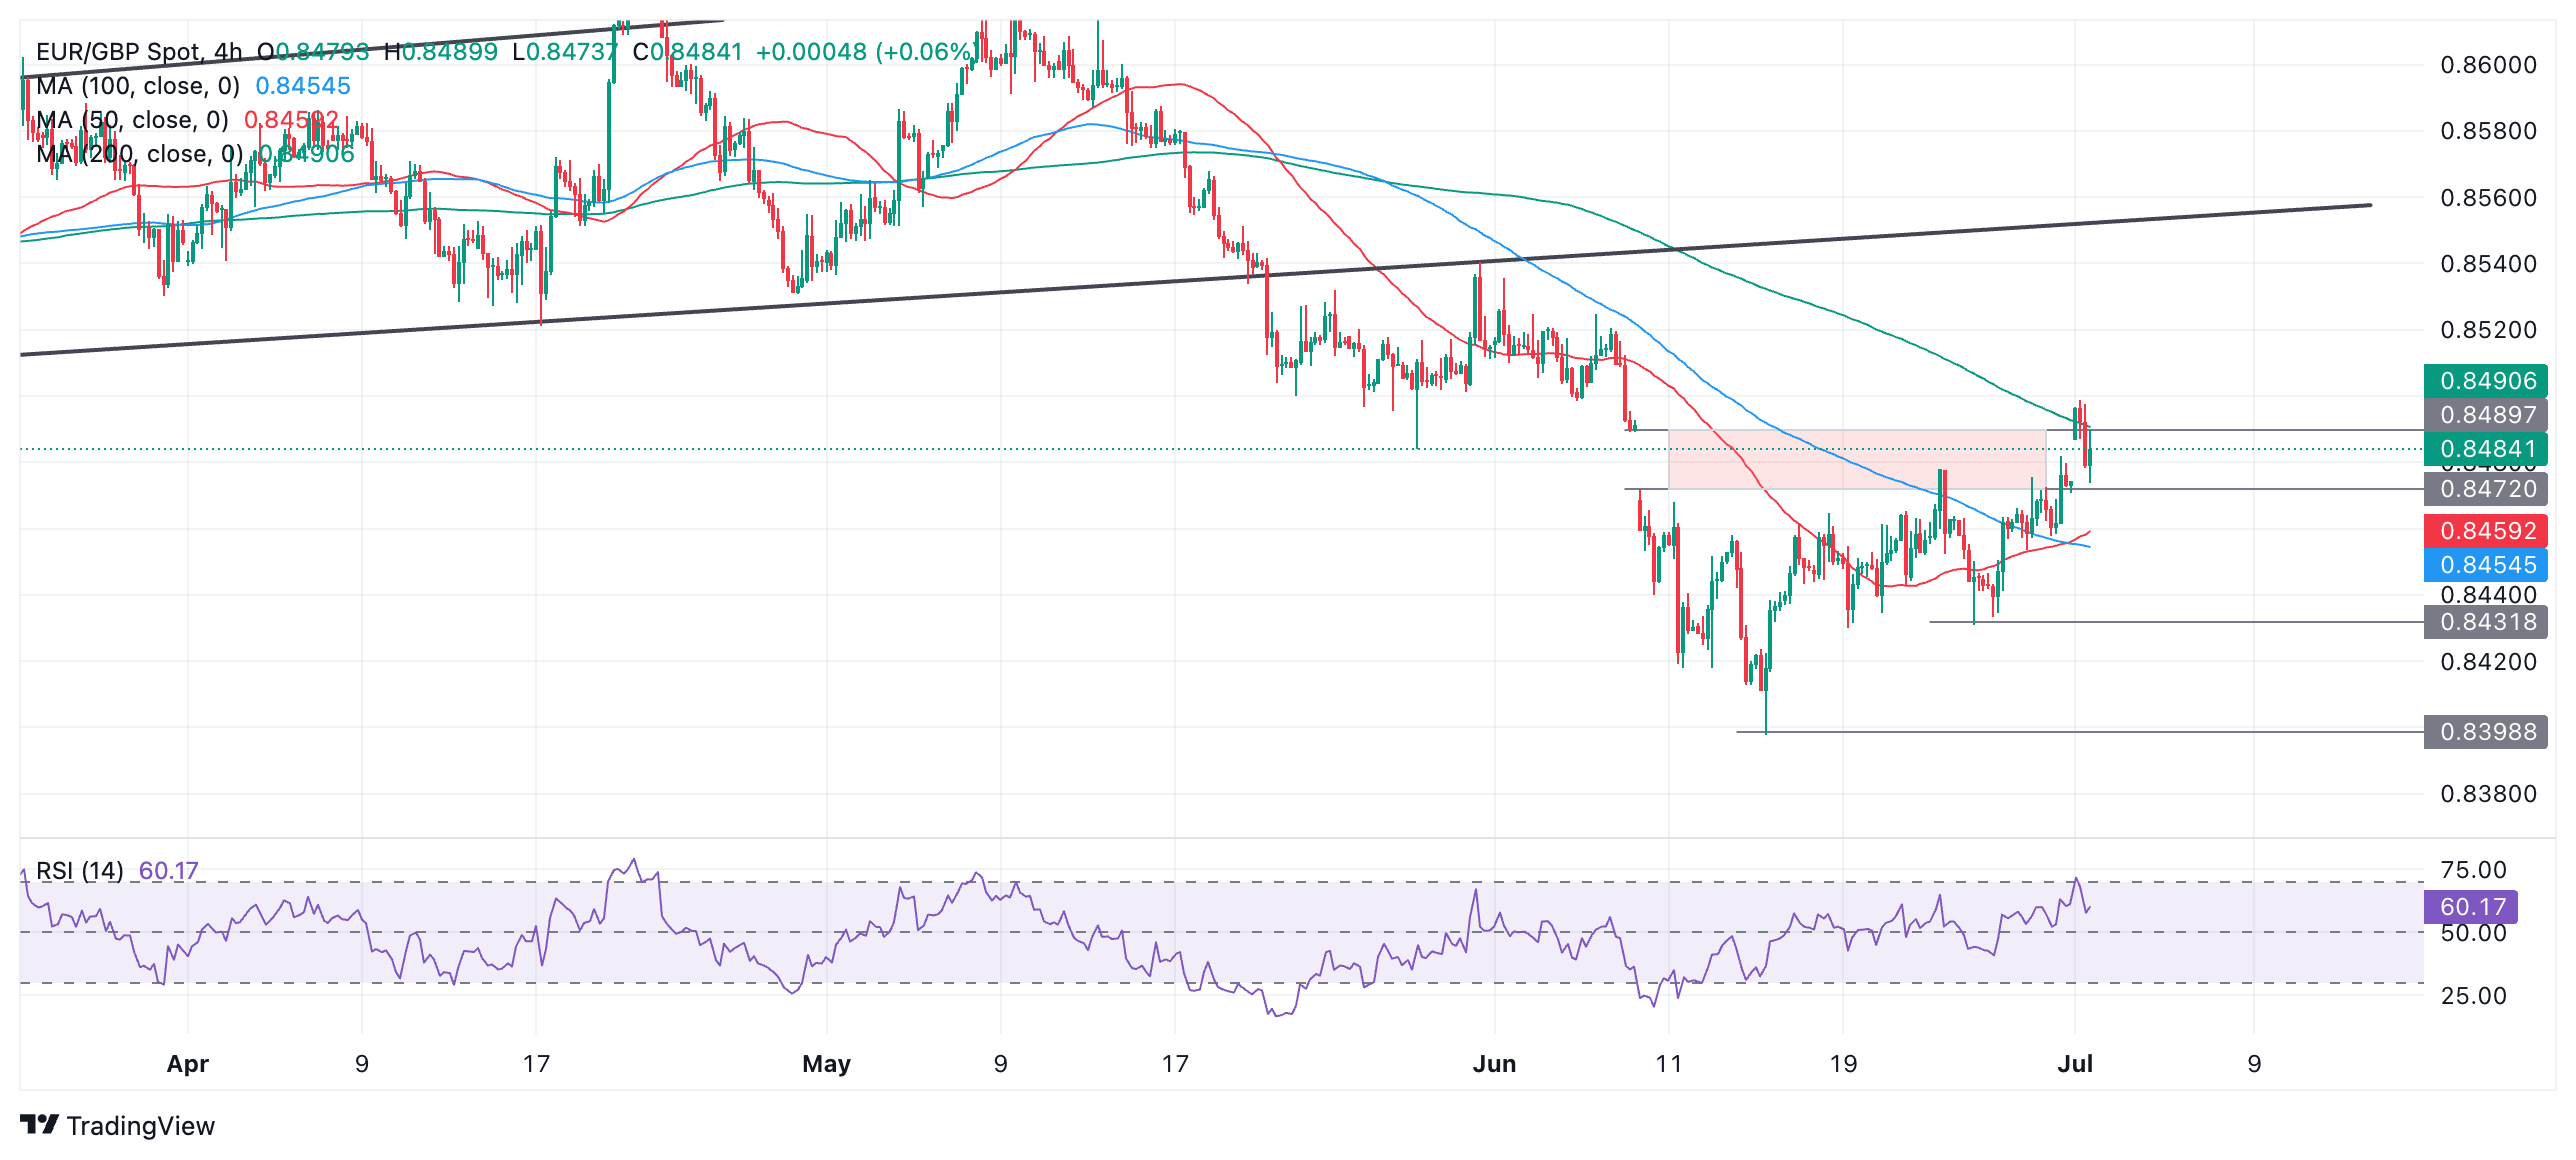
The Relative Strength Index (RSI) on the 4-hour chart has exited overbought, further suggesting the correction may have run its course and be turning lower. When RSI exits overbought in a countertrend move such as that on EUR/GBP, it is often a reliable indicator the main trend is resuming.
Alternatively, a break above the 0.8499 highs would indicate a continuation of the correction higher, with the 50-day Simple Moving Average at 0.8517 providing the next resistance target to the upside.
- GBP/USD falls as concerns of potential US recession weigh on markets.
- Technicals suggest neutral to downward bias, marked by lower highs and lows.
- Support levels: 1.2600 (daily MAs), 1.2560 (200-DMA), 1.2500, 1.2445 (May 9 low), 1.2299 (YTD low).
- Resistance points: 1.2700, 1.2750, 1.2800, 1.2868 (June 12 high).
The Pound Sterling erased earlier gains during Monday’s session against the Greenback, even though US economic data showed the economy is slowing down. Per the market’s reaction to the data, it could be seen that worries about a recession in the US loom as US equities tumbled, along with the US Dollar, as market participants await US jobs data on Friday. The GBP/USD trades at 1.2643, down 0.01%.
GBP/USD Price Analysis: Technical outlook
Technically speaking, the GBP/USD is neutral to downward biased, as seen by a successful series of lower and lower lows, dragging the pair from year-to-date (YTD) highs of 1.2894 toward current exchange rates. However, although lagging, the daily moving averages (DMAs) are capping the pair’s downside at around 1.2600, which, once cleared, could pave the way for further downside.
In that event, the GBP/USD next support would be the 200-DMA at 1.2560, followed by 1.2500 ahead of the May 9 cycle low of 1.2445. A breach of the latter will expose the YTD low of 1.2299.
On the other hand, if buyers reclaim 1.2700, the next resistance would be 1.2750. Once hurdle, the next stop would be 1.2800 before challenging the June 12 high of 1.2868.
GBP/USD Price Action – Daily Chart
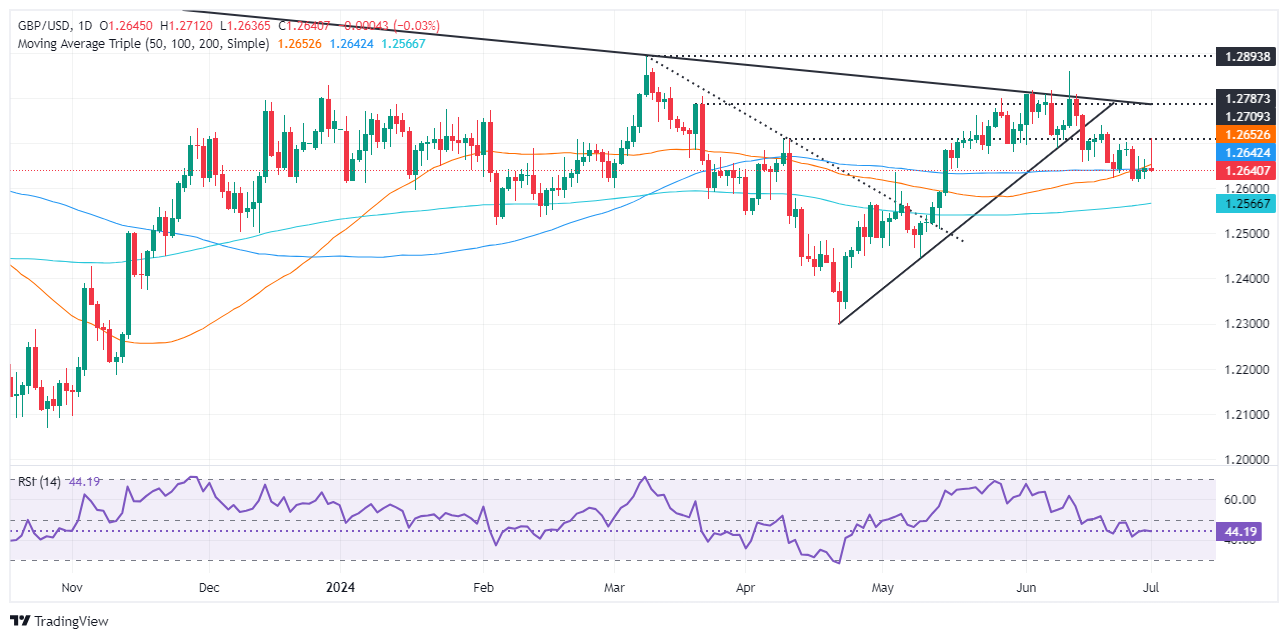
Pound Sterling FAQs
The Pound Sterling (GBP) is the oldest currency in the world (886 AD) and the official currency of the United Kingdom. It is the fourth most traded unit for foreign exchange (FX) in the world, accounting for 12% of all transactions, averaging $630 billion a day, according to 2022 data. Its key trading pairs are GBP/USD, aka ‘Cable’, which accounts for 11% of FX, GBP/JPY, or the ‘Dragon’ as it is known by traders (3%), and EUR/GBP (2%). The Pound Sterling is issued by the Bank of England (BoE).
The single most important factor influencing the value of the Pound Sterling is monetary policy decided by the Bank of England. The BoE bases its decisions on whether it has achieved its primary goal of “price stability” – a steady inflation rate of around 2%. Its primary tool for achieving this is the adjustment of interest rates. When inflation is too high, the BoE will try to rein it in by raising interest rates, making it more expensive for people and businesses to access credit. This is generally positive for GBP, as higher interest rates make the UK a more attractive place for global investors to park their money. When inflation falls too low it is a sign economic growth is slowing. In this scenario, the BoE will consider lowering interest rates to cheapen credit so businesses will borrow more to invest in growth-generating projects.
Data releases gauge the health of the economy and can impact the value of the Pound Sterling. Indicators such as GDP, Manufacturing and Services PMIs, and employment can all influence the direction of the GBP. A strong economy is good for Sterling. Not only does it attract more foreign investment but it may encourage the BoE to put up interest rates, which will directly strengthen GBP. Otherwise, if economic data is weak, the Pound Sterling is likely to fall.
Another significant data release for the Pound Sterling is the Trade Balance. This indicator measures the difference between what a country earns from its exports and what it spends on imports over a given period. If a country produces highly sought-after exports, its currency will benefit purely from the extra demand created from foreign buyers seeking to purchase these goods. Therefore, a positive net Trade Balance strengthens a currency and vice versa for a negative balance.
In the first half of 2024, the global financial landscape witnessed an increase in the momentum of dedollarisation. The movement is driven by various geopolitical, economic, and strategic factors by countries seeking to diversify their currency holdings and reduce vulnerability to the US monetary policy and financial and economic sanctions, DBS macro analysts Philip Wee and Ma Tieying note.
The momentum of dedollarisation increases
“Many countries are not looking to decouple from the US Dollar (USD) but to reduce reliance on the greenback and other Western reserve currencies, like the de-risking policy pursued by the US and the EU with China. They are responding to rising geopolitical tensions, particularly between the US and Europe against Russia and China.”
“An enlarged BRICS can develop alternative financial institutions and systems, reducing dependence on traditional institutions like the IMF and the World Bank. BRICS countries could also increase their collective influence in international forums like the United Nations and the G20, creating a counterbalance to Western alliances such as NATO and the EU.”
“According to the BIS, the USD accounts for almost 90% of global FX transactions in trade and investments, well ahead other significant currencies such as the Euro (EUR) and the Off-shore Yuan (CNY). Nonetheless, the dedollarisation process has long-term implications for global markets, trade dynamics, and the international monetary system.”
USD/JPY continued to trade near recent highs, OCBC strategists Frances Cheung and Christopher Wong note.
Intervention is inevitable
“USD/JPY continued to trade near recent highs. This is also near the highest level since 1986. There are expectations that Japanese authorities could soon intervene. While the level of JPY is one factor to consider, officials also focus on the pace of depreciation as the intent of intervention is to curb excessive volatility.”
“That said, if realised vols start to pick up or USD/JPY sees a rapid move towards 164-165 (from current spot), then actual intervention can potentially materialise. In the interim, USDJPY will look to UST yields, USD for directional cues. For USD/JPY to turn lower, that would require the USD to turn/Fed to cut or for BoJ to signal an intent to normalise urgently (rate hike or increase pace of balance sheet reduction).”
“USD/JPY continued to trade near recent highs. The path of least resistance for USDJPY may still be to the upside, for now. Pair was last at 160.90. Bullish momentum on daily chart intact while RSI in in overbought conditions. Next resistance at 161.20 (138.2% fibo projection of 2023 low to 2023), 164 levels. Support at 157.70 (21 DMA), 156.60 (50 DMA).”
Outcome of the first round of French legislative election saw no major surprises, OCBC strategists Frances Cheung and Christopher Wong note.
EUR to face renewed pressures
“Initial projections from polling companies suggest that far right Rassemblement National (RN) party was projected to get 33% and 34.2% of the vote, left wing coalition to get between 28.5% and 29.6% of the vote and Macron’s centrist alliance to get between 21.5% and 22.4% of the vote.”
“Potentially, the Euro (EUR) may face renewed pressures. Markets are on the look-out on whether Marine Le Pen’s far right party gets an absolute majority in the National Assembly, to allow it to pass legislation more easily. Potentially this scenario can be more negative for EUR than a hung parliament outcome.”
“EUR/USD was last at 1.0750 levels. Bearish momentum on daily chart shows signs of fading while RSI rose. Risks skewed to the upside. Resistance at 1.0760 (21 DMA), 1.0780 (50 DMA), 1.0810 (38.2% fibo retracement of 2024 high to low, 100 DMA). Support at 1.0710, 1.0660/ 70 levels (recent low).”
The start of the new quarter met with relative calm in FX markets as the US Dollar (USD) traded on the back foot, OCBC strategists Frances Cheung and Christopher Wong note.
USD trades bullish across the board
“For the week, focus is also on ISM data (Mon) and payrolls (Fri). Softer print should help to see USD ease. That said, the recent US Presidential debate (28 Jun) served as a reminder how election risks in US can be fluid and polling now indicate Trump leads Biden. Trump’s better showing over Biden may further add to USD premium.”
“DXY was last at 105.57. Bullish momentum on daily chart intact but shows signs of fading while RSI fell. Support at 105.20 (21, 50 DMAs), 104.80 (61.8% fibo retracement of Oct high to 2024 low). Resistance at 106.20.”
- USD/JPY stays strong above 161.00 amid sheer weakness in the Japanese Yen.
- The BoJ eyes further policy tightening due to the weak Yen.
- Weak US Manufacturing PMI weighs on the US Dollar.
The USD/JPY pair shifts auction above 161.00 in Monday’s New York session. The asset strengthens further as the Japanese Yen weakens amid uncertainty over Bank of Japan’s policy outlook. Recent BoJ policy minutes showed that officials favored further policy tightening as the weak Japanese Yen is boosting inflationary pressures.
Sheer depreciation in the Japanese currency has made exports more competitive and has prompted import costs. Growing speculation for more rate hikes appears to be unpleasant for investors as they expect that the wage-growth spiral should be the reason behind further policy tightening.
Also, expectations of Japan’s intervention in the FX domain are high as Yen has weakened to a multi-decade low against the US Dollar (USD). Japan’s administration has been warning of a stealth intervention against rapid, one-sided FX moves.
Meanwhile, the US Dollar faces pressure due to weak United States (US) ISM Manufacturing PMI data for June. The Manufacturing PMI, which gauges activities in the factory sector, unexpectedly declined to 48.5. Economists expected the factory activity to improve to 49.1 from the prior release of 48.7. A figure below the 50.0 threshold is considered as contraction in manufacturing activities.
Inflation in the manufacturing sector also dropped as the Prices Paid index, which indicates prices paid for inputs such as raw materials and wages, expanded at a slower pace to 52.1 from the estimates of 55.9 and the prior release of 57.0.
A decline in the Prices Paid suggests a softening of price pressures. This will boost expectations of early rate cuts by the Federal Reserve (Fed).
Economic Indicator
ISM Manufacturing PMI
The Institute for Supply Management (ISM) Manufacturing Purchasing Managers Index (PMI), released on a monthly basis, is a leading indicator gauging business activity in the US manufacturing sector. The indicator is obtained from a survey of manufacturing supply executives based on information they have collected within their respective organizations. Survey responses reflect the change, if any, in the current month compared to the previous month. A reading above 50 indicates that the manufacturing economy is generally expanding, a bullish sign for the US Dollar (USD). A reading below 50 signals that factory activity is generally declining, which is seen as bearish for USD.
Read more.Last release: Mon Jul 01, 2024 14:00
Frequency: Monthly
Actual: 48.5
Consensus: 49.1
Previous: 48.7
Source: Institute for Supply Management
The Institute for Supply Management’s (ISM) Manufacturing Purchasing Managers Index (PMI) provides a reliable outlook on the state of the US manufacturing sector. A reading above 50 suggests that the business activity expanded during the survey period and vice versa. PMIs are considered to be leading indicators and could signal a shift in the economic cycle. Stronger-than-expected prints usually have a positive impact on the USD. In addition to the headline PMI, the Employment Index and the Prices Paid Index numbers are watched closely as they shine a light on the labour market and inflation.
- ISM Manufacturing PMI declined slightly in June, pointing to ongoing contraction.
- US Dollar stays under bearish pressure after disappointing PMI data.
The business activity in the US manufacturing sector continued to contract in June, with the ISM Manufacturing PMI edging lower to 48.5 from 48.7 in April. This reading came in below the market expectation of 49.1.
The Employment Index of the PMI survey declined to 49.3 from 51.1 in May, while the New Orders Index improved to 49.3 from 45.4. Finally, the Prices Paid Index, the inflation component, retreated to 52.1 from 57 in the same period.
Commenting on the survey's findings, "US manufacturing activity continued in contraction at the close of the second quarter. Demand was weak again, output declined, and inputs stayed accommodative," said Timothy R. Fiore, Chair of the Institute for Supply Management (ISM) Manufacturing Business Survey Committee. "Panelists’ companies reduced production levels month over month as head count reductions continued in June," Fiore added.
Market reaction
The US Dollar stays under modest bearish pressure following the PMI data. At the time of press, the US Dollar Index was down 0.2% on the day at 105.60.
- Eurostat will release crucial European inflation data on Tuesday.
- Headline inflation is expected to recede in June.
- Uncertainty prevails regarding future rate cuts by the ECB.
The Harmonized Index of Consumer Prices (HICP), a key indicator of inflation in the broader euro bloc, is scheduled for release on Tuesday, July 2. The European Central Bank (ECB) will closely scrutinize this data amid persistent uncertainty about the continuation of its easing cycle that started at the June 6 event.
Since December 2023, the Consumer Price Index (CPI) in the euro area has gradually declined, with the exception of the May 2024 hiccup.
At the latest ECB meeting, where the central bank trimmed its policy rate by 25 bps for the first time since 2019, the bank revised its economic growth and inflation forecasts upward, predicting that price growth will return to its 2% target later than previously expected. On this, inflation is now projected to be 2.2% next year, exceeding the earlier forecast of 2.0%, and is anticipated to reach the target only by 2026. This suggests that achieving the "last mile" to the target may be more challenging than initially hoped.
At that gathering, ECB President Christine Lagarde acknowledged progress in the bank’s fight against high inflation, but she also indicated that the battle is not yet over, as inflation is expected to remain elevated until next year.
What can we expect in the next European inflation report?
Reflecting similar inflation trends in other G10 countries, economists generally predict that headline HICP inflation will decrease a tad to 2.5% over the last twelve months to June, down from the 2.6% rate in May. The core measure, which strips food and energy costs, is expected to rise by 2.8% compared to the previous year, following a 2.9% increase in the prior month.
Somewhat bolstering this expected downtick in consumer prices, Germany's preliminary headline Consumer Price Index (CPI) rose by 2.2% from a year earlier in June, down from a 2.4% increase in the previous month.
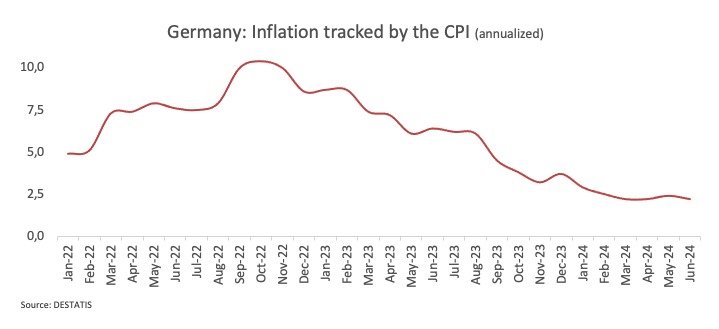
Returning to the ECB, the bank released its Consumer Expectations Survey for May on June 28, revealing that consumers in the region have lowered their inflation expectations. Expectations for inflation over the next 12 months decreased to 2.8% from 2.9% in April. Similarly, expectations for inflation three years ahead fell to 2.3% from 2.4%, though they remain above the bank’s 2% target.
When will the HICP report be released, and how could it affect EUR/USD?
The Eurozone's preliminary HICP is scheduled to be released at 09:00 GMT on Tuesday, July 2. As this highly anticipated inflation data approaches, the Euro (EUR) is struggling to leave behind the area of recent lows near 1.0660 against the US Dollar (USD) on a convincing note, with investors still looking at the Fed-ECB policy divergence and the hawkish narrative from the majority of Fed officials as the exclusive drivers of the pair’s decline since June peaks north of 1.0900 the figure.
Pablo Piovano, Senior Analyst at FXStreet, notes, "In case the bullish sentiment kicks in, EUR/USD is expected to face initial resistance at the key 200-day SMA of 1.0790. The surpass of this region on a sustainable basis carries the potential to open the door to the continuation of the bull run until the June high of 1.0916 (June 4) prior to the March top at 1.0981 (March 8)".
Pablo adds, "On the other hand, if the selling pressure accelerates, spot might once again challenge the June low of 1.0666 (June 26) ahead of the May low of 1.0649 (May 1). A deeper pullback could then see the 2024 bottom of 1.0601 (April 16) revisited."
Economic Indicator
Harmonized Index of Consumer Prices (YoY)
The Harmonized Index of Consumer Prices (HICP) measures changes in the prices of a representative basket of goods and services in the European Monetary Union. The HICP, released by Eurostat on a monthly basis, is harmonized because the same methodology is used across all member states and their contribution is weighted. The YoY reading compares prices in the reference month to a year earlier. Generally, a high reading is seen as bullish for the Euro (EUR), while a low reading is seen as bearish.
Read more.Next release: Tue Jul 02, 2024 09:00 (Prel)
Frequency: Monthly
Consensus: 2.5%
Previous: 2.6%
Source: Eurostat
ECB FAQs
The European Central Bank (ECB) in Frankfurt, Germany, is the reserve bank for the Eurozone. The ECB sets interest rates and manages monetary policy for the region. The ECB primary mandate is to maintain price stability, which means keeping inflation at around 2%. Its primary tool for achieving this is by raising or lowering interest rates. Relatively high interest rates will usually result in a stronger Euro and vice versa. The ECB Governing Council makes monetary policy decisions at meetings held eight times a year. Decisions are made by heads of the Eurozone national banks and six permanent members, including the President of the ECB, Christine Lagarde.
In extreme situations, the European Central Bank can enact a policy tool called Quantitative Easing. QE is the process by which the ECB prints Euros and uses them to buy assets – usually government or corporate bonds – from banks and other financial institutions. QE usually results in a weaker Euro. QE is a last resort when simply lowering interest rates is unlikely to achieve the objective of price stability. The ECB used it during the Great Financial Crisis in 2009-11, in 2015 when inflation remained stubbornly low, as well as during the covid pandemic.
Quantitative tightening (QT) is the reverse of QE. It is undertaken after QE when an economic recovery is underway and inflation starts rising. Whilst in QE the European Central Bank (ECB) purchases government and corporate bonds from financial institutions to provide them with liquidity, in QT the ECB stops buying more bonds, and stops reinvesting the principal maturing on the bonds it already holds. It is usually positive (or bullish) for the Euro.
- USD/CAD rises further to 1.3700 as the US Dollar bounces back with US ISM Manufacturing PMI in focus.
- An expected decline in the US core PCE inflation boosts Fed rate-cut hopes.
- Higher-than-expected increase in Canadian inflation eases hopes of BoC’s back-to-back rate cuts.
The USD/CAD pair extends its upside to near the round-level resistance of 1.3700 in Monday’s New York session. The Loonie asset strengthens as the US Dollar (USD) recovers more than half of its intraday losses after posting a fresh three-day low near 105.40.
Market sentiment remains positive as investors expect that the Federal Reserve (Fed) will begin reducing interest rates from the September meeting. S&P 500 futures post significant gains in European trading hours. The US Dollar Index (DXY), which tracks the Greenback’s value against six major currencies, bounces back to near 105.75. 10-year US Treasury yields jump to near 4.45%.
The expectations for Fed rate cuts in September were boosted by soft United States (US) core Personal Consumption Expenditure Price Index (PCE) data for May. Annual core PCE data, which is Fed’s preferred inflation measure, grew at a slower pace of 2.6%, as expected, from the prior release of 2.8%.
On the economic front, investors await the US ISM Manufacturing PMI for June, which will be published at 14:00 GMT. The PMI report is expected to show that output in the manufacturing sector improved to 49.0 from the prior release of 48.7 but remained below the 50.0 threshold.
Meanwhile, the Canadian Dollar weakens despite hotter-than-expected inflation data for May eased expectations of subsequent rate cuts by the Bank of Canada (BoC). The BoE began its rate-cutting cycle from June.
Economic Indicator
ISM Manufacturing PMI
The Institute for Supply Management (ISM) Manufacturing Purchasing Managers Index (PMI), released on a monthly basis, is a leading indicator gauging business activity in the US manufacturing sector. The indicator is obtained from a survey of manufacturing supply executives based on information they have collected within their respective organizations. Survey responses reflect the change, if any, in the current month compared to the previous month. A reading above 50 indicates that the manufacturing economy is generally expanding, a bullish sign for the US Dollar (USD). A reading below 50 signals that factory activity is generally declining, which is seen as bearish for USD.
Read more.Next release: Mon Jul 01, 2024 14:00
Frequency: Monthly
Consensus: 49.1
Previous: 48.7
Source: Institute for Supply Management
The Institute for Supply Management’s (ISM) Manufacturing Purchasing Managers Index (PMI) provides a reliable outlook on the state of the US manufacturing sector. A reading above 50 suggests that the business activity expanded during the survey period and vice versa. PMIs are considered to be leading indicators and could signal a shift in the economic cycle. Stronger-than-expected prints usually have a positive impact on the USD. In addition to the headline PMI, the Employment Index and the Prices Paid Index numbers are watched closely as they shine a light on the labour market and inflation.
- Silver is recovering within a falling channel.
- It has met tough resistance at the level of the 50 and 100-period SMAs on the 4-hour chart.
- There are bullish signs but a breakout of the channel would be a prerequisite for a more confident stance.
Silver (XAG/USD) continues recovering within a descending channel. The precious metal found support at the June 26 and 13 lows (around 26.88). Its first attempt to break above the cluster of Moving Averages in the mid $29.40s failed but after its pullback on July 1 it has started creeping higher again.
Silver 4-hour Chart
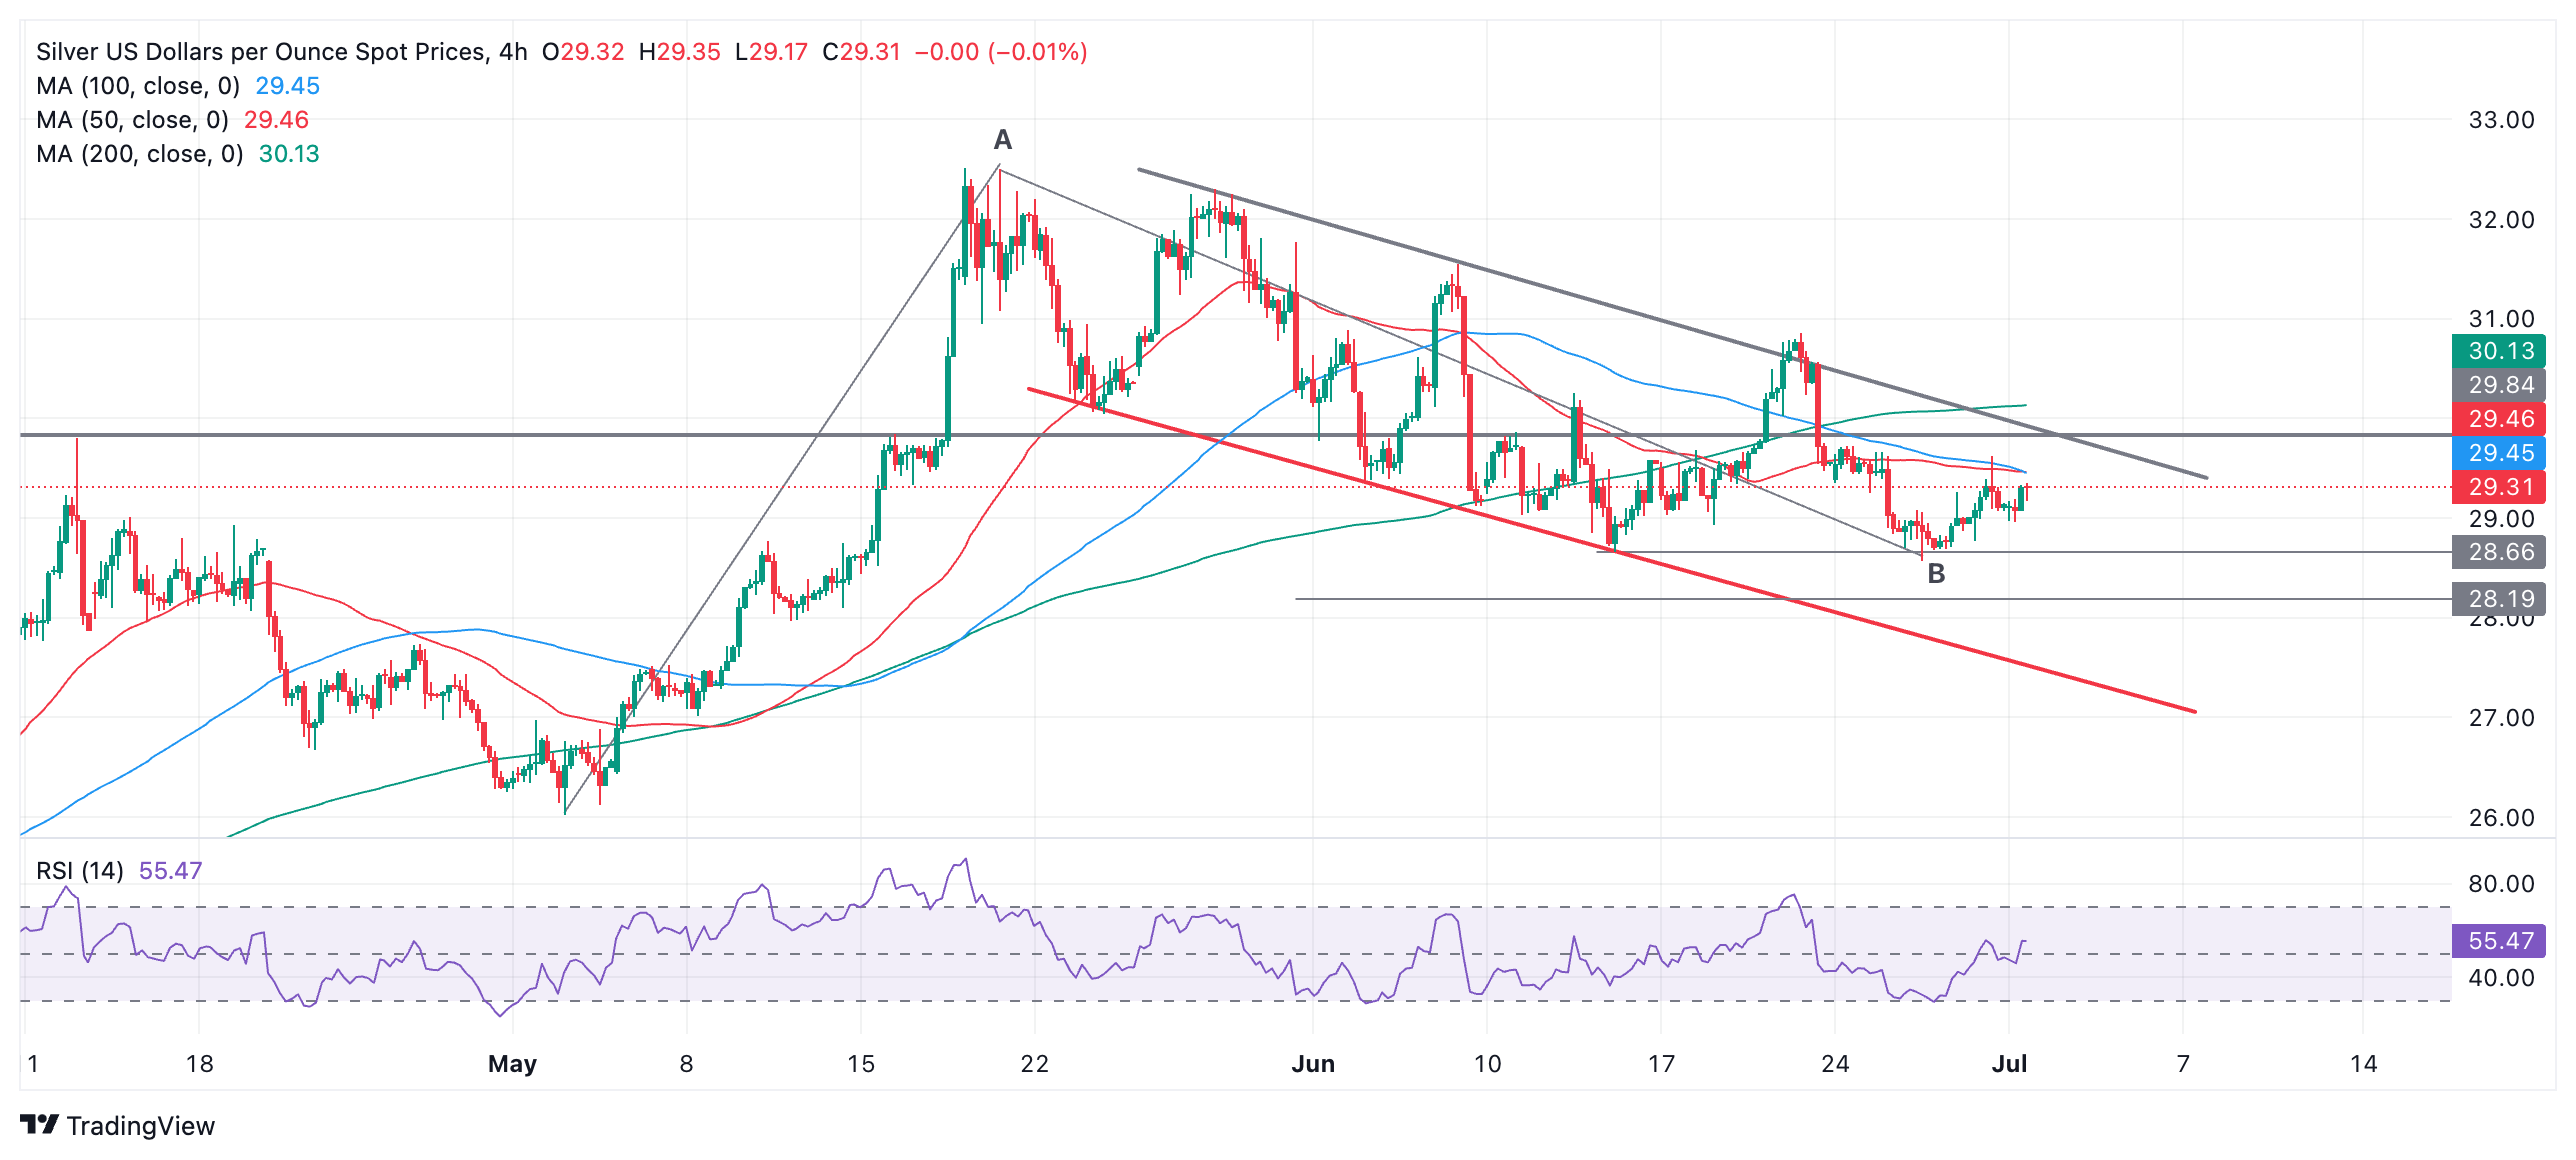
It is now debatable whether Silver is still in a bearish short-term trend, which means there is no longer a downside bias. However, it is in a falling channel which does add a bearish tone to the charts.
Therefore, if price falls back below $28.57, the June 26 low, it would reconfirm the downside bias, with the next target lying at the lower channel line, at around $27.50.
If Silver continues recovering and breaks on a closing basis above the 50 and 100 SMAs, however, it would indicate a continuation higher to the upper channel line at around $29.90. This would be a critical crossroads for the pair. It is also a major resistance level at the top of a four-year consolidation zone. A decisive break above would indicate the start of a new short-term uptrend.
A decisive break would be one accompanied by a long green up candle that broke clearly above the level and closed near its high or three green candles in a row that broke above the level.
Silver temporarily broke out of the top of the falling channel on June 20, and although it quickly fell back, the fact it breached the integrity of the channel, albeit temporarily, indicates the upper channel line has been weakened and is more likely to give way again. This also adds a slightly bullish note to the charts.
The rally during the start of May also gives the chart a further bullish aspect. One view could suggest this rally was a wave “A” and the whole of the falling channel is the second large wave, or wave “B”, of a Measured Move (MM) pattern higher. MMs are three-wave zig-zags. If so, this could indicate a move of a similar length could unfold to the upside, in a wave “C”. Such a move, if it materializes – and it’s too early to say yet – would probably take Silver up to around the $33.00 mark.
The US Dollar (USD) net long positions have decreased for the first time in six weeks, the Euro (EUR) positions have turned net short for the first time in 7 weeks, and the Pound Sterling (GBP) net long positions have decreased for the second week in a row, Rabobank FX analysts note.
EUR turns net short, USD and GBP lose longs
“USD net long positions have decreased for the first time in six weeks, driven by an increase in short positions. On June 27th, US personal consumption for Q1 was revised down from 2.0% to 1.5% and continuing jobless claims registered their highest level since November 2021. On June 28th, US PCE printed in line with expectations, registering 0.0% m/m and 0.3% y/y.”
“EUR positions have turned net short for the first time in 7 weeks, driven by an increase in short positions. Investors are anxiously awaiting the French parliamentary elections on June 30th.”
“GBP net long positions have decreased for the second week in a row, driven by a decrease in long positions. The BoE released its decision to maintain the bank rate at 5.25% as was unanimously anticipated by Bloomberg surveyed economists. However, some policymakers said their decision was finely balanced.”
- NZD/USD has pulled back up to the neckline of a topping pattern again.
- The move comes despite the pair making a new low on June 28.
- A close higher could invalidate the pattern and indicate a possible upside reversal.
NZD/USD has recovered back up to the “neckline” of a complex multi-peak topping pattern that has formed since the middle of May. This is the second time NZD/USD has recovered back up to test the neckline, the level underpinning the pattern’s trough lows.
NZD/USD 4-hour Chart
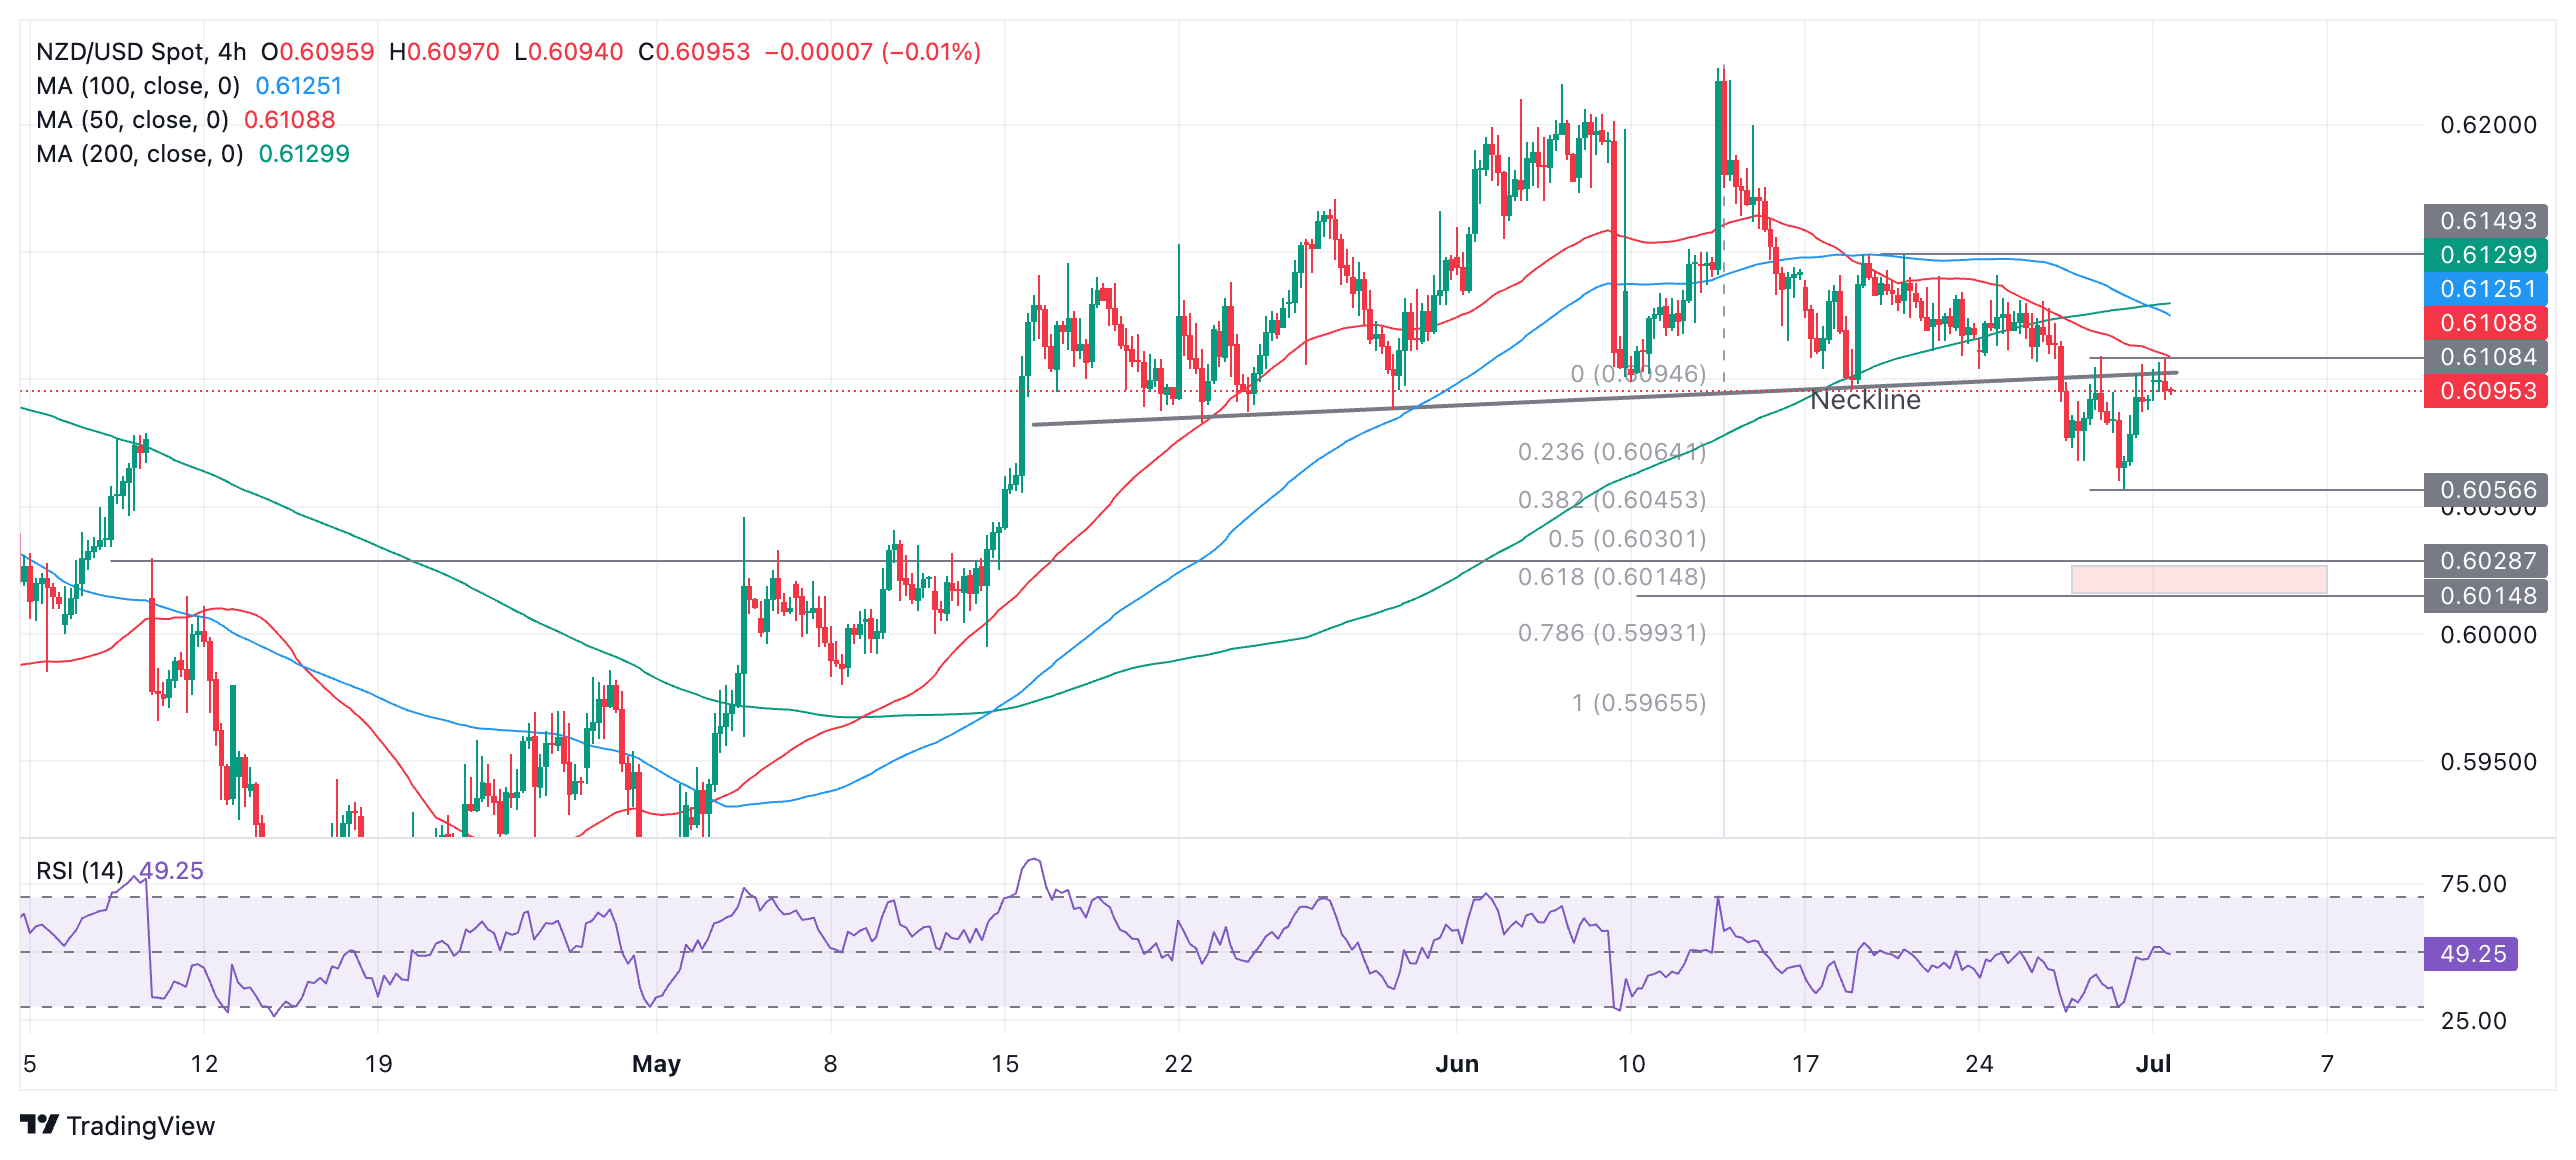
NZD/USD first penetrated the neckline on June 26, falling to a low of 0.6068. However, it quickly mounted a recovery and returned back to the neckline on the following day. The pair then resumed its downside, however, falling to a new low of 0.6057 on June 28. Bears failed to maintain the downside momentum, however, and now the pair has recovered for a second time back up to the level of the neckline.
A recovery back up to the neckline of a topping pattern is called a “throwback” move in technical parlance. The fact that this has happened a second time is unusual and suggests waning downside momentum. It introduces a risk that the initial break lower may have been a false break and NZD/USD could now rally back above the neckline higher.
The pair completed a bearish Shooting Star Japanese candlestick pattern during the last 4-hour period. If this is followed up by another bearish candle it would confirm a reversal pattern, and would suggest a move lower. However, candlestick patterns are very short-term indicators. A break below the June 28 low at 0.6057 would be required to confirm further downside, with the next target in a zone between 0.6028 (bottom of April 10 price gap) and 0.6015, the Fibonacci 0.618 extrapolation of the height of the pattern lower.
A break above the 0.6108 highs on a closing basis would bring into doubt the bearish hypothesis and possibly indicate a recovery. A move above the 0.6149 (June 13 and 14 high) would invalidate the bearish pattern and probably indicate the birth of a new short-term uptrend.
- Annual CPI inflation in Germany edged lower to 2.2% in June.
- EUR/USD consolidates daily gains near 1.0750 after the data.
Inflation in Germany, as measured by the change in the Consumer Price Index (CPI), declined to 2.2% on a yearly basis in June, Germany's Destatis reported on Monday. This reading followed the 2.4% increase recorded in May and came in below the market expectation of 2.3%. On a monthly basis, the CPI rose 0.1%, matching May's increase.
The Harmonized Index of Consumer Prices (HICP), the European Central Bank's (ECB) preferred gauge of inflation, rose 0.2% on a monthly basis as forecast. The annual HICP increased 2.5% in the same period, down from 2.8% in May.
Market reaction
EUR/USD showed no immediate reaction to these figures. At the time of press, the EUR/USD pair was up 0.3% on the day at 1.0745.
It is election week in the UK, and the BBC poll tracker puts Labour at 40%, Conservatives at 20%, Reform UK at 16% and Liberal Democrats at 11%, ING analyst Francesco Pesole notes.
GBP to continue relying on external drivers
“There has, indeed, been very little doubt about a Labour landslide win, so the election should not be a huge event for markets. We suspect that a stronger than expected result by populist/hard-Brexiteer Reform UK is the most tangible risk for some slight adverse reacting in GBP assets.”
“As widely discussed recently, the chances of the election result deviating the Bank of England (BoE) policy path are very low, and the Pound Sterling (GBP) should continue to rely on external drivers (both in EU politics and US macro) and key domestic data releases.”
“June CPI and jobs report aren’t published before 17-18 July, so even if we see expect a cut in August (market pricing 15bp) to hit the GBP, the case for a materially stronger EUR/GBP within the next couple of weeks is not very compelling.”
The US macro story is increasingly pointing to a softening in the dollar. The three main data releases this week are the ISM survey results (manufacturing today, services on Wednesday), the FOMC minutes (Wednesday), JOLTS job openings for May (Thursday) and June’s jobs report (Friday), ING’s FX analyst Francesco Pesole reports.
DXY to break below 105.00
"The ISM PMIs are expected to show a marginal improvement in manufacturing – while remaining in contraction – and a softer services figure, while still in expansion. There is a chance the surveys won’t be adding much more to the activity narrative. Instead, jobs figures should set the undertone for markets outside of the impact of EU political developments until June CPI figures are released on 11 July."
"We’ll hear what Federal Reserve (Fed) Chair Jerome Powell will have to say about this at Sintra’s European Central Bank forum tomorrow. He has generally shown a sanguine tendency when it comes to disinflation, and he may ultimately neutralise the impact of FOMC minutes on Wednesday, which could be more hawkish given the June Dot Plot."
"While we see US macroeconomic data as mostly USD-negative in the coming weeks, we doubt this will translate into a clear-cut dollar decline due to EU political risk. DXY may break below 105.00 on softening US jobs figure and a dovish Powell this week, but may then encounter increasing support below that level."
- The Mexican Peso weakens almost half a percent against the Euro after preliminary results from Sunday’s French election.
- The far-right National Rally failed to win as many votes as expected and is unlikely to win an outright majority.
- USD/MXN looks vulnerable to unfolding another leg lower in the short-term.
The Mexican Peso (MXN) trades flat against the US Dollar (USD) on Monday but almost half a percent lower against the Euro amid a calm start to the week. Markets breathe a sigh of relief following the first round of the French elections held on Sunday which showed the French far-right National Rally winning insufficient votes to form a ruling majority.
At the time of writing, one US Dollar (USD) buys 18.34 Mexican Pesos, EUR/MXN is trading at 19.71, and GBP/MXN at 23.23.
Mexican Peso falls to the Euro after French elections
The Mexican Peso is falling against the Euro after the preliminary results of the French election allay fears of the far-right nationalists grabbing power and undermining the institutions of the European Union (EU).
Initial results show the far-right National Rally (NR) is set to win around 33.0% of the vote, slightly underperforming its 36.2% of the final poll of polls. The left-wing New Popular Front (NPF) coalition is forecast to win around 29%, slightly outperforming their last-polled 28.0%. French President Emmanuel Macron’s Renaissance party is on track to win 20.0%, which is in line with the 20.4% gained in the final poll.
The French election system uses a two-step process whereby in all constituencies where there is no outright winner with over 25% of the vote, there is a second round of voting to decide a winner using the two leading candidates and anyone else who won more than 12.5% of the votes. This is likely to apply to about half of the 577 seats in the French parliament. The left alliance has said it will remove candidates in remaining seats who are in third place and encourage their supporters to vote for the leading non-right-wing contender. Tactical voting is likely to deny NR an overall majority, according to Jim Reid, Global Head of Macro Research at Deutsche Bank.
Mexican Peso claws back losses from Banxico meeting
The Mexican Peso has managed to win back most of the losses it suffered following the dovish Bank of Mexico (Banxico) meeting last week. Although Banxico did not lower its policy rate from 11.00%, as expected, the board made several changes to the language of the accompanying statement that suggested an increased probability of a rate cut coming down the track. Unlike the previous meeting, one of the board members, Omar Mejía, also voted to cut interest rates.
“Of note was the seemingly little weight the Bank placed on recent MXN depreciation filtering through to higher inflation. Overall, we would argue there is a dovish tilt that leaves the door wide open to further rate cuts this year,” said Rabobank in a note.
On the data front, Monday sees the release of Business Confidence for June and the Fiscal Balance for May.
Technical Analysis: USD/MXN looking to unfold another down leg
USD/MXN is looking vulnerable to further weakness in the near-term as it starts to slide following a shallow pull back from the June 28 low.
USD/MXN 4-hour Chart
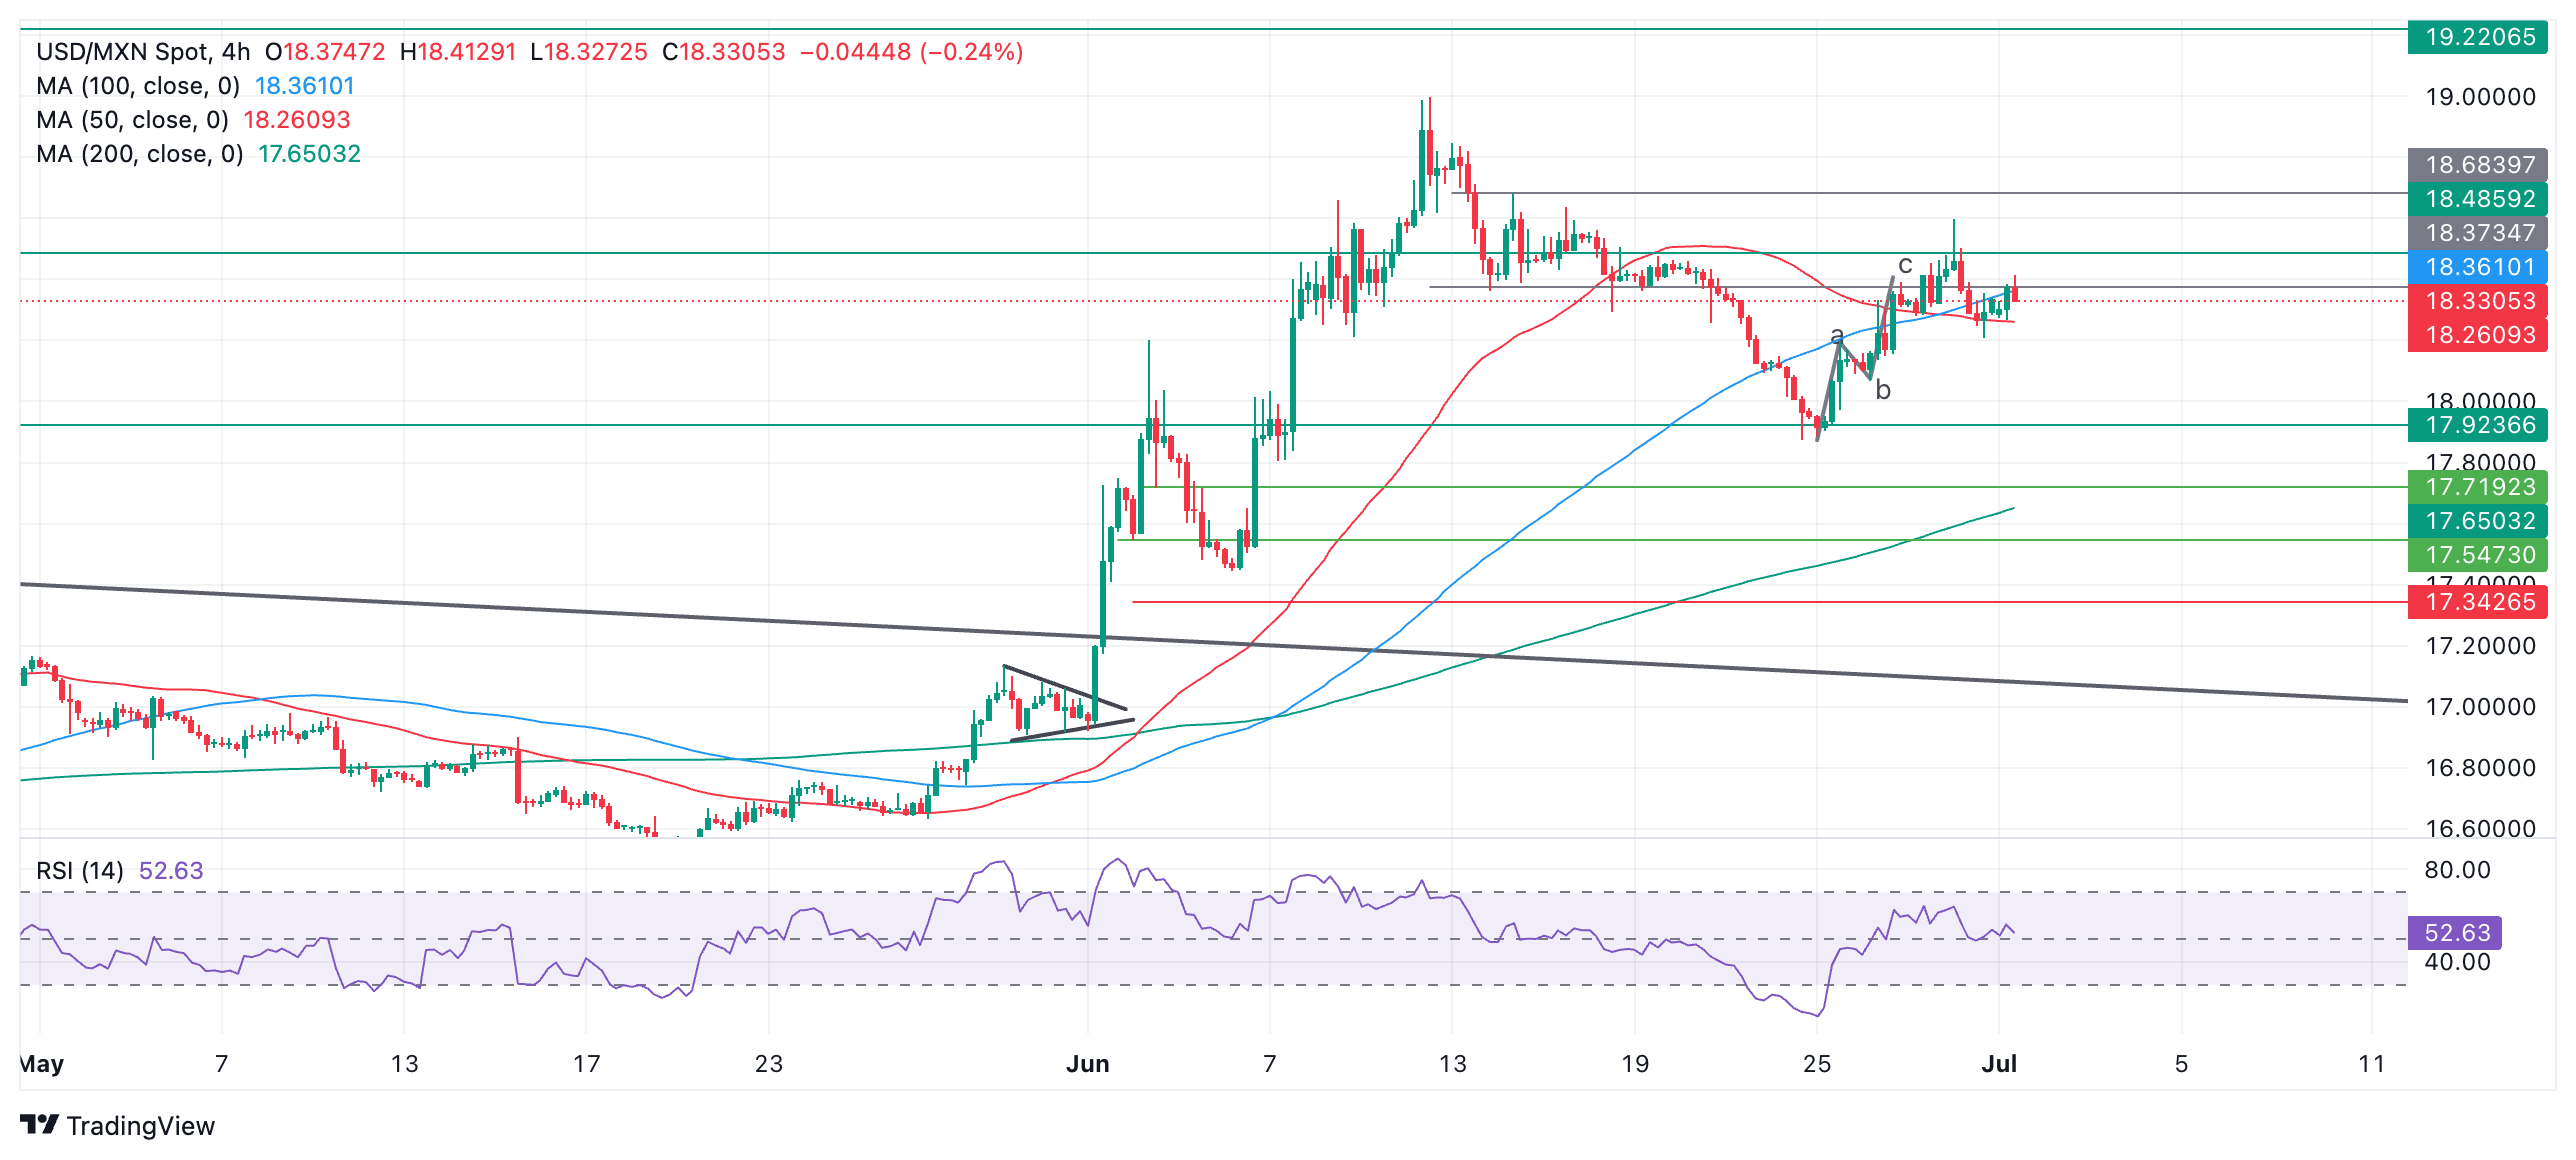
If USD/MXN continues lower in another bearish leg it will probably reach a target at around 18.17, the 0.618 Fibonacci extrapolation of the June 28 decline.
The pair is no overall trend in the short term, so there is no bearish or bullish bias.
A move below 18.06 (June 26 low) would suggest the short-term downtrend was resuming and probably see a continuation down to 17.87 (June 24 low).
Alternatively, if USD/MXN rallies and breaks above 18.60 (June 28 high), it is likely to continue up to 18.68 (June 14 high), followed by 19.00 (June 12 high). A break above 19.00 would provide strong confirmation of a resumption of the short-and-intermediate term uptrend.
The direction of the long-term trend also remains in doubt.
Mexican Peso FAQs
The Mexican Peso (MXN) is the most traded currency among its Latin American peers. Its value is broadly determined by the performance of the Mexican economy, the country’s central bank’s policy, the amount of foreign investment in the country and even the levels of remittances sent by Mexicans who live abroad, particularly in the United States. Geopolitical trends can also move MXN: for example, the process of nearshoring – or the decision by some firms to relocate manufacturing capacity and supply chains closer to their home countries – is also seen as a catalyst for the Mexican currency as the country is considered a key manufacturing hub in the American continent. Another catalyst for MXN is Oil prices as Mexico is a key exporter of the commodity.
The main objective of Mexico’s central bank, also known as Banxico, is to maintain inflation at low and stable levels (at or close to its target of 3%, the midpoint in a tolerance band of between 2% and 4%). To this end, the bank sets an appropriate level of interest rates. When inflation is too high, Banxico will attempt to tame it by raising interest rates, making it more expensive for households and businesses to borrow money, thus cooling demand and the overall economy. Higher interest rates are generally positive for the Mexican Peso (MXN) as they lead to higher yields, making the country a more attractive place for investors. On the contrary, lower interest rates tend to weaken MXN.
Macroeconomic data releases are key to assess the state of the economy and can have an impact on the Mexican Peso (MXN) valuation. A strong Mexican economy, based on high economic growth, low unemployment and high confidence is good for MXN. Not only does it attract more foreign investment but it may encourage the Bank of Mexico (Banxico) to increase interest rates, particularly if this strength comes together with elevated inflation. However, if economic data is weak, MXN is likely to depreciate.
As an emerging-market currency, the Mexican Peso (MXN) tends to strive during risk-on periods, or when investors perceive that broader market risks are low and thus are eager to engage with investments that carry a higher risk. Conversely, MXN tends to weaken at times of market turbulence or economic uncertainty as investors tend to sell higher-risk assets and flee to the more-stable safe havens.
- Natural Gas extends its decline and sinks to $2.56 on Monday.
- Investors see China cutting LNG imports after prices peaked above $3.0 in June.
- The US Dollar index retraces after the Euro outpaced the Greenback on Monday, offering support to XNG/USD.
Natural Gas price (XNG/USD) edges lower and sinks to $2.56 on Monday, extending its losing streak for the fifth day in a row. The move comes on the back of China cutting its Liquified Natural Gas (LNG) imports after prices rose above $3.0 in June. It seems that the demand and hunger for LNG in China is not that big once prices are heating up, while European Gas prices are moving higher after a local temperature surge and the energy demand rose again.
Meanwhile, the US Dollar Index (DXY), which tracks the Greenback’s value against six major currencies, retraces as the Euro (which represents nearly 57.6% of the Index) outpaces the Greenback after the French government elections held on Sunday, with a win for the far right not being that convincing and still all possible outcomes on the table ahead of the second round vote on July 7. Traders are also gearing up for a crammed US economic calendar, with the US Jobs Report on Friday as the cherry on the cake.
Natural Gas is trading at $2.56 per MMBtu at the time of writing.
Natural Gas news and market movers: Europe is hot
- Gas demand in Europe is surging locally. Several regions are already experiencing high temperatures, and energy consumption from air conditioning is spiking to withstand the heat, Reuters reports.
- Bloomberg reports that China’s LNG imports fell for the first time in more than a year, by 6.2% compared to the same month last year.
- Germany is topping over 80% of its Ggas storage capacity by hitting 81%. The overall EU gas storage capacity is at 77%, according to Gas Infrastructure Europe (GIE).
Natural Gas Technical Analysis: Running ashore
Natural Gas price is hitting solid ground with a double layer of support coming from the 100-day Simple Moving Average (SMA) and the 200-day SMA. The steep decline in the price comes with the main buyer, China, having eased its recent Gas imports for June after Gas prices rallied the month before. Add the steady Gas import flow in Europe, with Germany already at 81% in reserves ahead of winter, and it could be that this direction has not yet reached the end of the line.
The pivotal level near $3.08 (March 6, 2023, high) remains key resistance after its false break last week, which is still 20% away. In addition, the red descending trendline in the chart below at $3.10 will also weigh on this area as a cap. Further up, the fresh year-to-date high at $3.16 is the level to beat.
On the downside, the 200-day Simple Moving Average (SMA) acts as the first support near $2.54. Should that support area fail to hold, the next target could be the pivotal level near $2.13, with interim support by the 55-day SMA near $2.58 and by the 100-day SMA at $2.25.
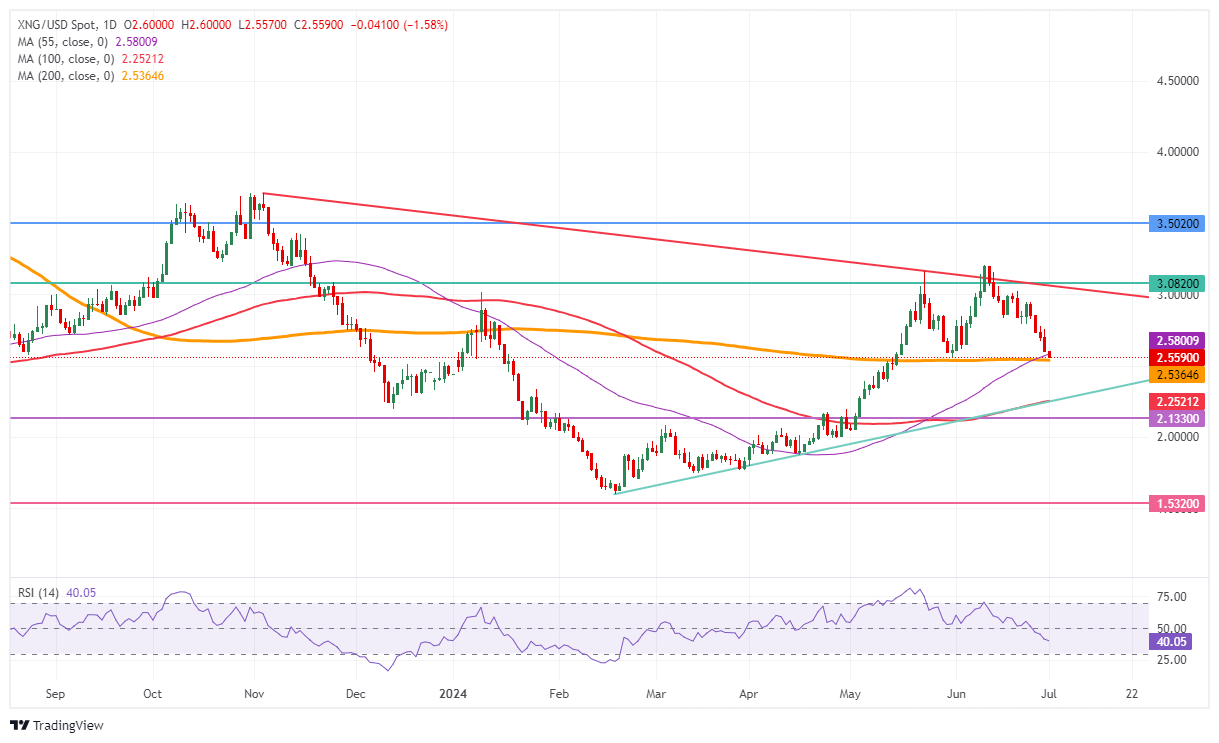
Natural Gas: Daily Chart
Natural Gas FAQs
Supply and demand dynamics are a key factor influencing Natural Gas prices, and are themselves influenced by global economic growth, industrial activity, population growth, production levels, and inventories. The weather impacts Natural Gas prices because more Gas is used during cold winters and hot summers for heating and cooling. Competition from other energy sources impacts prices as consumers may switch to cheaper sources. Geopolitical events are factors as exemplified by the war in Ukraine. Government policies relating to extraction, transportation, and environmental issues also impact prices.
The main economic release influencing Natural Gas prices is the weekly inventory bulletin from the Energy Information Administration (EIA), a US government agency that produces US gas market data. The EIA Gas bulletin usually comes out on Thursday at 14:30 GMT, a day after the EIA publishes its weekly Oil bulletin. Economic data from large consumers of Natural Gas can impact supply and demand, the largest of which include China, Germany and Japan. Natural Gas is primarily priced and traded in US Dollars, thus economic releases impacting the US Dollar are also factors.
The US Dollar is the world’s reserve currency and most commodities, including Natural Gas are priced and traded on international markets in US Dollars. As such, the value of the US Dollar is a factor in the price of Natural Gas, because if the Dollar strengthens it means less Dollars are required to buy the same volume of Gas (the price falls), and vice versa if USD strengthens.
The Euro (EUR) is trading stronger this morning after the outcome of the first-round French parliamentary elections came in quite close to polls, with a victory for the National Rally. We think this week’s US data can push EUR/USD higher, but French politics can still put a cap on the pair this summer, ING FX strategist Francesco Pesole notes.
France elections continue to drive Euro movements
“It appears that EUR/USD is getting rid of some political risk premium this morning after preliminary results from the first round of French parliamentary elections came in close to pre-vote polls. The positive reaction in the EUR is, in our view, primarily due to some market relief for the New Popular Front not gaining more than expected.”
“On the data side, the eurozone calendar’s main highlight is the flash CPI estimates for June, released tomorrow. The ECB’s forum in Sintra runs from today until Wednesday and will offer plenty of discussion on policy and inflation. Among speakers, ECB President Christine Lagarde, Federal Reserve (Fed) Chair Jerome Powell, Isabel Schnabel and Philip Lane stand out. On Thursday, June’s ECB minutes are released.”
“Markets should end this week with a slightly clearer picture on the ECB path ahead given CPI data and ECB-speak, but the political factor should remain the main driver for the common currency until next week’s second round results in France are out. We think soft US data can help a move above 1.0800, but a return to 1.0900 is a relatively long shot considering risks of rewidening EGB spreads.”
Macron gambled and lost. That much was clear heading into France’s elections this weekend. Macron’s party attracted only about 20% of the votes, behind Le Pen’s Rassemblement National (33.4%) and the left-wing coalition Nouveau Front Populaire (28.1%), Rabobank financial Senior macro strategist Bas van Geffen notes.
Policy paralysis remains a distinct possibility
“This morning markets mostly breathe a small sigh of relief as Rassemblement National did not get as much support as some polls had suggested. Le Pen’s party won 39 seats out of the 76 seats that were assigned outright in the first round. The Euro (EUR) strengthened somewhat, and the French CAC40 leads European equity markets higher.”
“But uncertainty remains very high into the second round of voting, in which the remaining seats will be distributed. Candidates could pull out of the race, to avoid splitting the vote. Centrist parties have historically banded together in such a way. Moreover, the left-wing coalition suggested that they may do so in order to block Le Pen from obtaining a majority in parliament.”
“Even so, yesterday’s polls made it clear that Macron will probably have to work with another party to legislate post-elections. So, although the budgetary risk of the left-wing Nouveau Front Populaire may have receded, policy paralysis remains a distinct possibility. That would slow down solutions for the structural problems that plague the French economy.”
- AUD/USD inches toward 0.6700 as the US Dollar is under pressure.
- Soft US inflation in May has prompted Fed rate-cut hopes.
- The RBA could tighten its monetary policy further as price pressures accelerated in May.
The AUD/USD pair marches toward the round-level resistance of 0.6700 in Monday’s European session. The Aussie asset gains as the US Dollar (USD) faces sharp selling pressure amid firm speculation that the Federal Reserve (Fed) will start lowering interest rates from the September meeting.
The expectations for Fed rate cuts have been prompted by an expected slowdown in price pressures. The United States (US) Personal Consumption Expenditure (PCE) report for May showed that the annual core inflation measure decelerated to 2.6% from the prior release of 2.8%.
A decline in the US inflationary pressures has boosted expectations of early rate cuts by the Fed. The CME FedWatch tool shows that the central bank will begin reducing its key borrowing rates from the September meeting.
For more interest rate cues, investors await the US labor market and PMI data for June, which are lined up this week.
In Monday’s session, investors will focus on the US ISM Manufacturing PMI data, which will be published at 14:00 GMT. The Manufacturing PMI is estimated to have improved to 49.0 from May’s reading of 48.7. However, a figure below the 50.0 threshold is itself considered as contraction in factory activities.
On the Aussie front, major triggers for the Australian Dollar this week, such as the Reserve Bank of Australia (RBA) minutes and monthly Retail Sales for May. The RBA minutes will provide more cues about whether the central bank will hike interest rates further.
The recent surge in price pressures in Australia has strengthened the likelihood of further policy tightening by the RBA. The annual Monthly Consumer Price Index (CPI) rose at a faster pace of 4.0% in May than estimates of 3.85 and the prior release of 3.6%.
Economic Indicator
RBA Meeting Minutes
The minutes of the Reserve Bank of Australia meetings are published two weeks after the interest rate decision. The minutes give a full account of the policy discussion, including differences of view. They also record the votes of the individual members of the Committee. Generally speaking, if the RBA is hawkish about the inflationary outlook for the economy, then the markets see a higher possibility of a rate increase, and that is positive for the AUD.
Read more.Next release: Tue Jul 02, 2024 01:30
Frequency: Weekly
Consensus: -
Previous: -
Source: Reserve Bank of Australia
The Reserve Bank of Australia (RBA) publishes the minutes of its monetary policy meeting two weeks after the interest rate decision is announced. It provides a detailed record of the discussions held between the RBA’s board members on monetary policy and economic conditions that influenced their decision on adjusting interest rates and/or bond buys, significantly impacting the AUD. The minutes also reveal considerations on international economic developments and the exchange rate value.
- The US Dollar eases at the start of the first week of July.
- A very full US economic calendar ahead, with the US Jobs Report as dessert.
- The US Dollar index retreats to the mid-105.00 level.
The US Dollar (USD) sees the Euro outpacing everyone on Monday after the first round of the French government elections took place. A clear victory for Marine Le Pen and her far-right party Rassemblement National (RN), though a stalemate could be at hand. None of the three major parties – Marine Le Pen’s far-right Rassemblement National, Emmanuel Macron’s centric Ensemble Citoyens, and Jean-Luc Mélenchon’s far-left Nouveau Front Populaire – have reached their projected results as of the latest polls. Both the far left and the far right parties have reached less positive results, as the latest polls on Friday suggested, while Macron’s party was able to salvage the situation a bit, though still coming in third, which means no one holds a majority and a stalemate could be at hand.
On the US economic calendar front, US traders will have little time to digest the French election news, with already some nice data points ahead on Monday as the Institute for Supply Management is gearing up for its June numbers on Manufacturing. Additionally, the European Central Bank (ECB) is holding its European Jackson Hole version, with its annual symposium in Sintra, Portugal, with many comments and interviews expected from several central bank members from across the globe.
Daily digest market movers: US off to an early start
- The annual three-day European Central Bank Symposium starts in Sintra, Portugal, and lasts until Wednesday. ECB president Christine Lagarde will deliver a speech and opening remarks. More headlines are expected throughout these three days, with several central bank members and policymakers to be interviewed and making comments.
- At 13:45 GMT, S&P Global will release June’s Purchasing Managers Index (PMI) for the Manufacturing sector’s final reading. The previous reading was 51.7, and no changes are expected.
- At 14:00 GMT, the Institute for Supply Management will release June’s PMI Index:
- Manufacturing PMI is seen heading to 49 from 48.7.
- The New Orders Index was at 45.4 in May, with no forecast available for June.
- The Employment Index was previously at 51.1, with no consensus view available.
- The Prices Paid Index is seen declining to 55.9 from 57.
- Equities are roaring and rallying higher with this French election gridlock result going into next week’s voting. Certainly, in Europe, all indices are popping higher by over 1%, while US equity futures are enjoying the positive spillover effect.
- The CME Fedwatch Tool is broadly backing a rate cut in September despite recent comments from Federal Reserve (Fed) officials. The odds now stand at 57.8% for a 25-basis-point cut. A rate pause stands at a 35.7% chance, while a 50-basis-point rate cut has a slim 6.5% possibility.
- The US 10-year benchmark rate trades near 4.39% and slid lower from its opening at 4.42% on the back of the French election news.
US Dollar Index Technical Analysis: If BoJ strikes now…
The US Dollar Index (DXY) is facing headwinds from its biggest contributor in the Index, the Euro, which accounts for 57.6% of the total package. The appreciation of the Euro is pushing the Greenback in the fences already on early Monday trading. With the sword of Damocles still hanging over the US Dollar, from possible intervention from the Ministry of Finance from Japan, the DXY could be gearing up for one of its biggest corrections for this year.
On the upside, the pivotal level of 105.89 must be regained first. The DXY failed to stay above that level last week. Once above there, marching above the red descending trend line in the chart below at 106.26 and the peak of April at 106.52 are the two main resistances ahead of a fresh nine-month high. That would be reached once 107.35 is being broken to the upside.
On the downside, 105.53 is the first support ahead of a trifecta of Simple Moving Averages (SMA). Next down is the 55-day SMA at 105.25, safeguarding the 105.00 round figure. A touch lower, near 104.73 and 104.45, both the 100-day and the 200-day SMA form a double layer of protection to support any declines together with the green ascending trendline from last December.
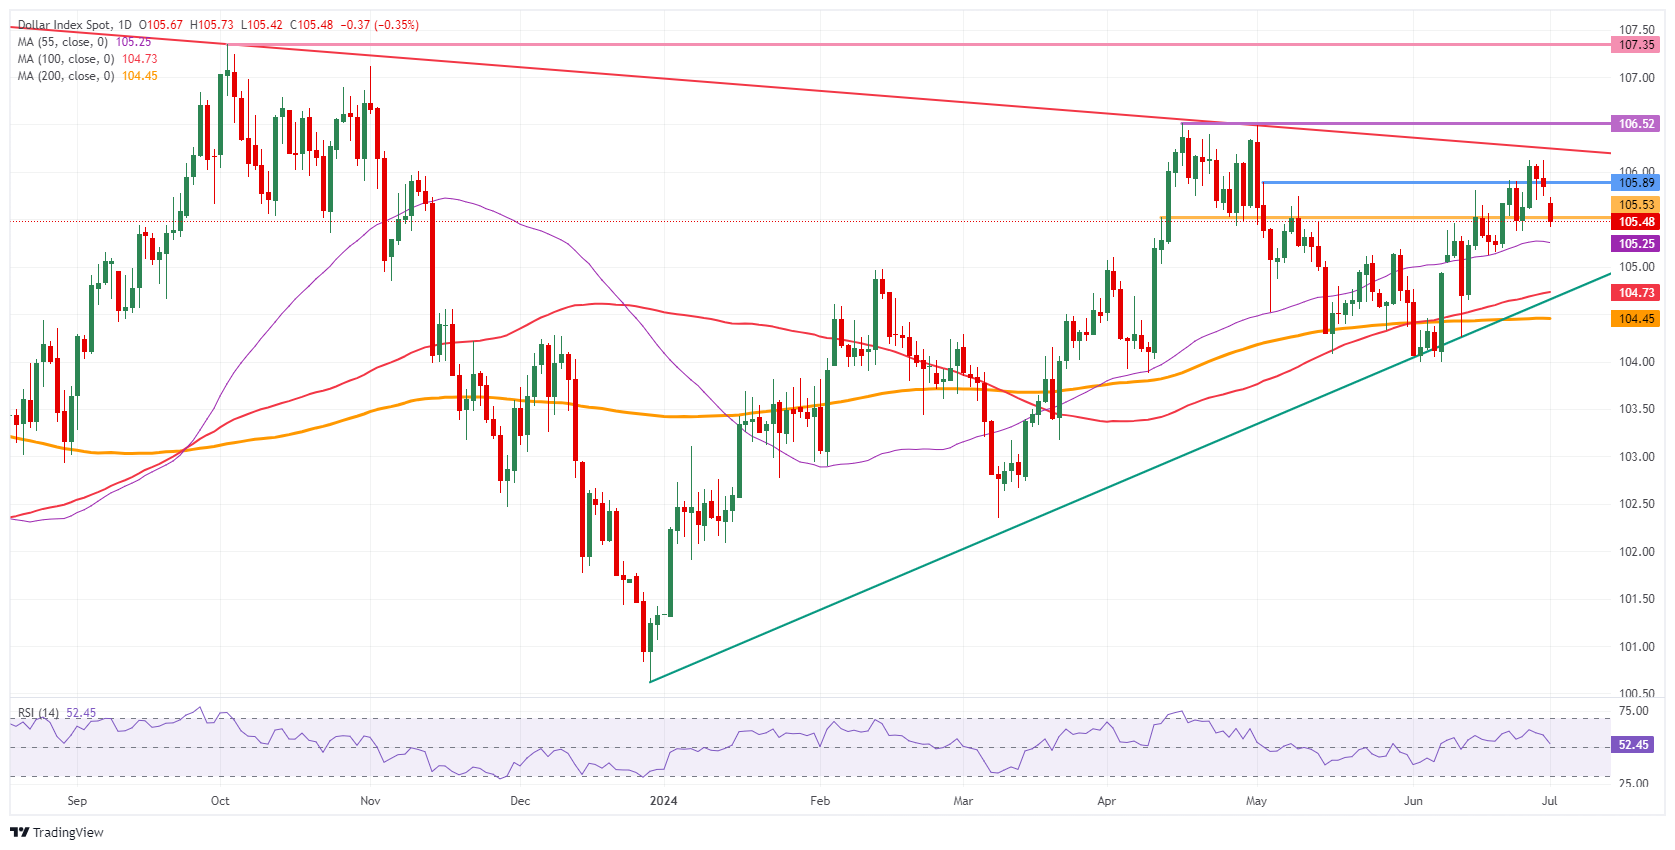
US Dollar Index: Daily Chart
US Dollar FAQs
The US Dollar (USD) is the official currency of the United States of America, and the ‘de facto’ currency of a significant number of other countries where it is found in circulation alongside local notes. It is the most heavily traded currency in the world, accounting for over 88% of all global foreign exchange turnover, or an average of $6.6 trillion in transactions per day, according to data from 2022. Following the second world war, the USD took over from the British Pound as the world’s reserve currency. For most of its history, the US Dollar was backed by Gold, until the Bretton Woods Agreement in 1971 when the Gold Standard went away.
The most important single factor impacting on the value of the US Dollar is monetary policy, which is shaped by the Federal Reserve (Fed). The Fed has two mandates: to achieve price stability (control inflation) and foster full employment. Its primary tool to achieve these two goals is by adjusting interest rates. When prices are rising too quickly and inflation is above the Fed’s 2% target, the Fed will raise rates, which helps the USD value. When inflation falls below 2% or the Unemployment Rate is too high, the Fed may lower interest rates, which weighs on the Greenback.
In extreme situations, the Federal Reserve can also print more Dollars and enact quantitative easing (QE). QE is the process by which the Fed substantially increases the flow of credit in a stuck financial system. It is a non-standard policy measure used when credit has dried up because banks will not lend to each other (out of the fear of counterparty default). It is a last resort when simply lowering interest rates is unlikely to achieve the necessary result. It was the Fed’s weapon of choice to combat the credit crunch that occurred during the Great Financial Crisis in 2008. It involves the Fed printing more Dollars and using them to buy US government bonds predominantly from financial institutions. QE usually leads to a weaker US Dollar.
Quantitative tightening (QT) is the reverse process whereby the Federal Reserve stops buying bonds from financial institutions and does not reinvest the principal from the bonds it holds maturing in new purchases. It is usually positive for the US Dollar.
The first round of the French elections produced results broadly in line with opinion polls, UOB Analyst Paul Donovan notes.
A weak government can’t tackle fiscal problems
“An unusually large number of second-round votes could be three-way contests. That makes the final outcome harder to predict. In the past, there has been a “front républicain” with third-placed moderate candidates withdrawing to increase the chances of defeating a more extreme party. It is not clear how many constituencies will follow such a strategy.”
“It now seems less likely that one group will have a majority after the second round, but investors would be unwise to place too much confidence in that. A weaker minority government is unlikely to tackle France’s fiscal situation. The elections remind investors that economic structural upheaval encourages prejudice politics.”
“German preliminary June consumer price inflation is expected to slow. Eurozone inflation is within a reasonable range of the target, and so this moderation in headline inflation supports more easing from the ECB. Several business sentiment opinion polls are due. Consumer sentiment polls are subject to political partisan bias.”
- The Pound Sterling moves higher against the US Dollar as the Fed is expected to begin reducing interest rates in September.
- UK annual headline inflation has returned to the desired rate of 2%.
- Investors await the US ISM Manufacturing PMI for fresh guidance on interest rates.
The Pound Sterling (GBP) performs strongly against its major peers in Monday’s London session. The British currency strengthens as investors remain uncertain about when the Bank of England (BoE) will start reducing interest rates.
Headline inflation in the United Kingdom (UK) has already returned to the desired rate of 2%. However, BoE policymakers see price pressures in the service sector as a preferred inflation measure, which is significantly higher than what is needed to gain confidence for rate cuts.
Currently, financial markets expect that the BoE will begin lowering interest rates from the August meeting.
Meanwhile, the Pound Sterling is expected to remain uncertain ahead of the UK elections outcome, which will kick off on July 4. According to the latest exit polls, the opposition Labor Party is expected to win from UK Prime Minister Rishi Sunak-led Conservative Party.
Daily digest market movers: Pound Sterling outperforms its peers
- The Pound Sterling exhibits a strong performance against the US Dollar (USD). The GBP/USD pair moves higher to 1.2680 as the US Dollar declines after the United States (US) Personal Consumption Expenditures Price Index (PCE) report for May showed that price pressures declined expectedly. Annual core PCE inflation, the Federal Reserve’s (Fed) preferred inflation measure, decelerated to 2.6% from the prior release of 2.8%.
- The expected decline in the US inflation prompts expectations of Fed rate-cut bets for September. According to the CME FedWatch tool, 30-day Federal Fund futures pricing data shows that the probability for rate cuts in September is 63.4%. The data also shows that the Fed will deliver two rate cuts this year against one signaled by officials in their latest dot plot.
- Fed officials continue to argue in favor of keeping interest rates at their current levels until they get evidence that inflation will decline to the desired rate of 2%. The Fed wants to see inflation decline for months before pivoting to policy-normalization.
- Last week, Atlanta Fed Bank President Raphael Bostic said rate cuts would become appropriate when they are convinced that inflation is on a clear path towards 2%. When asked about a concrete timeframe for rate cuts, Bostic said: "I continue to believe conditions will likely call for a cut in the federal funds rate in the fourth quarter of this year," Reuters reported.
- This week, the US Dollar is expected to deliver a volatile performance as the official ISM Purchasing Managers’ Index (PMI) and employment data for June are scheduled for release. In Monday’s session, investors will focus on the ISM Manufacturing PMI data, which will be published at 14:00 GMT.
- The Manufacturing PMI report is expected to show that factory activity improved but remained below the 50.0 threshold, which separates expansion from contraction, seen at 49.0 from the prior release of 48.7.
Technical Analysis: Pound Sterling hovers near 50-day EMA
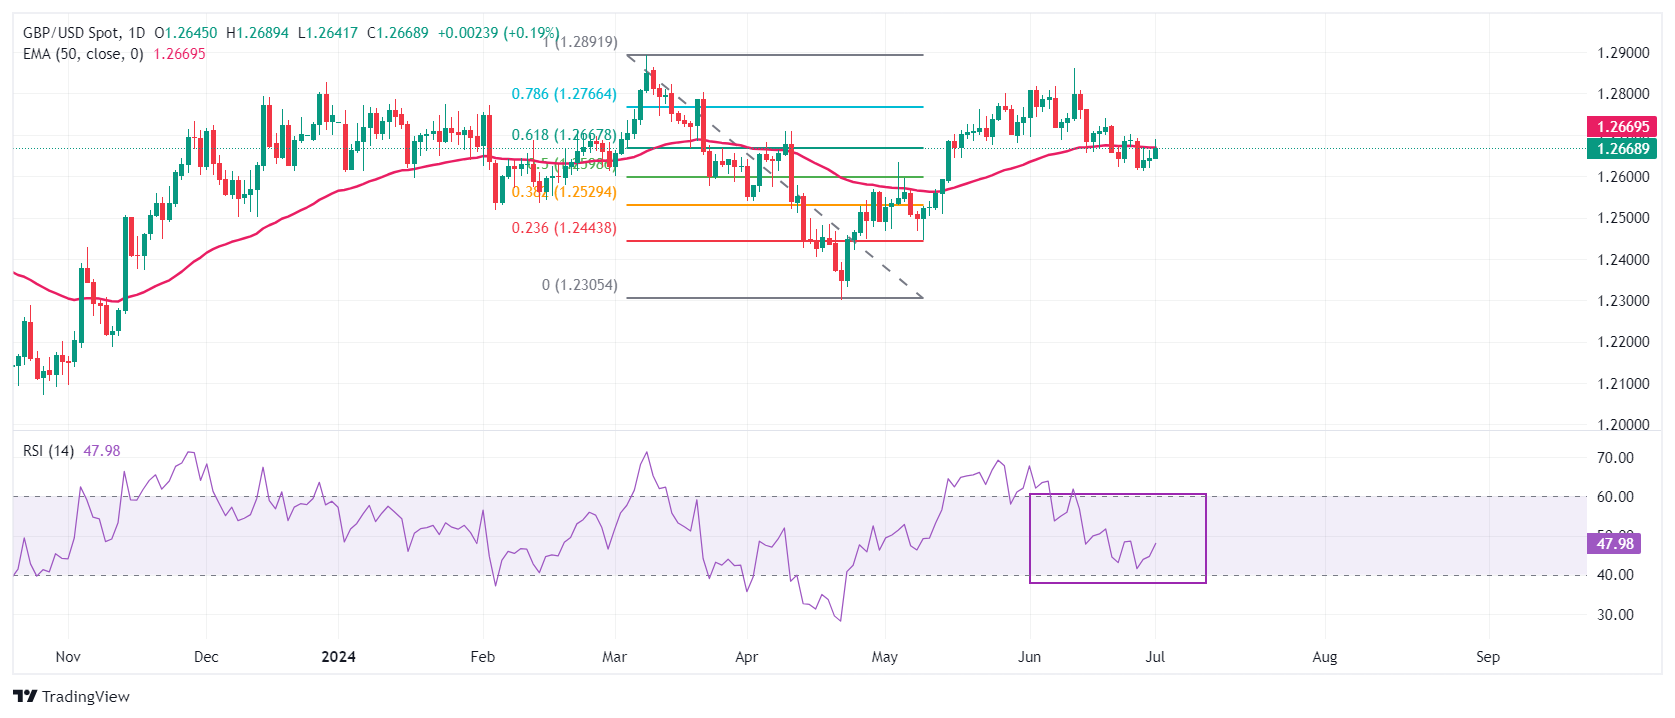
The Pound Sterling rises to 1.2680 against the US Dollar after extending its recovery from an almost seven-week low of 1.2610. The GBP/USD pair moves higher but struggles to hold above 61.8% Fibonacci retracement support at 1.2667, plotted from the March 8 high of 1.2900 to the April 22 low at 1.2300.
The Cable hovers near the 50-day Exponential Moving Average (EMA) near 1.2640, suggesting uncertainty over the near-term outlook.
The 14-day Relative Strength Index (RSI) oscillates in the 40.00-60.00 range, indicating indecisiveness among market participants.
Pound Sterling FAQs
The Pound Sterling (GBP) is the oldest currency in the world (886 AD) and the official currency of the United Kingdom. It is the fourth most traded unit for foreign exchange (FX) in the world, accounting for 12% of all transactions, averaging $630 billion a day, according to 2022 data. Its key trading pairs are GBP/USD, aka ‘Cable’, which accounts for 11% of FX, GBP/JPY, or the ‘Dragon’ as it is known by traders (3%), and EUR/GBP (2%). The Pound Sterling is issued by the Bank of England (BoE).
The single most important factor influencing the value of the Pound Sterling is monetary policy decided by the Bank of England. The BoE bases its decisions on whether it has achieved its primary goal of “price stability” – a steady inflation rate of around 2%. Its primary tool for achieving this is the adjustment of interest rates. When inflation is too high, the BoE will try to rein it in by raising interest rates, making it more expensive for people and businesses to access credit. This is generally positive for GBP, as higher interest rates make the UK a more attractive place for global investors to park their money. When inflation falls too low it is a sign economic growth is slowing. In this scenario, the BoE will consider lowering interest rates to cheapen credit so businesses will borrow more to invest in growth-generating projects.
Data releases gauge the health of the economy and can impact the value of the Pound Sterling. Indicators such as GDP, Manufacturing and Services PMIs, and employment can all influence the direction of the GBP. A strong economy is good for Sterling. Not only does it attract more foreign investment but it may encourage the BoE to put up interest rates, which will directly strengthen GBP. Otherwise, if economic data is weak, the Pound Sterling is likely to fall.
Another significant data release for the Pound Sterling is the Trade Balance. This indicator measures the difference between what a country earns from its exports and what it spends on imports over a given period. If a country produces highly sought-after exports, its currency will benefit purely from the extra demand created from foreign buyers seeking to purchase these goods. Therefore, a positive net Trade Balance strengthens a currency and vice versa for a negative balance.
The US Dollar (USD) is likely to trade between 7.2930 and 7.3060. USD could break above 7.3100, but it is too early to tell if the next significant resistance at 7.3400 will come into view.
A breach below 7.2800 to stop the USD from advancing
24-HOUR VIEW: “We expected USD to test the major resistance at 7.3100 last Friday. Our view was incorrect, as after rising to 7.3066, USD fell sharply to a low of 7.2905. USD rebounded from the low and closed little changed at 7.3018 (-0.03%). The price action is likely part of a range trading phase. Today, USD is likely to trade between 7.2930 and 7.3060.”
1-3 WEEKS VIEW: “In our most recent narrative from last Thursday (27 Jun, spot at 7.2990), we indicated that USD could break above 7.3100, but it is too early to tell if the next significant resistance at 7.3400 will come into view. There is no change in our view. Overall, only a breach of 7.2800 (no change in ‘strong support’ level) would mean that the advance in USD from the middle of the month has ended.”
The US Dollar (USD) is likely to trade with an upward bias. Conditions remain overbought, but USD is likely to continue to rise. Resistance levels are at 161.50 and 162.00, UOB Group FX strategists note.
Next resistance level above 161.50 is 162.00
24-HOUR VIEW: “We expected USD to trade in a range between 160.20 and 161.00 last Friday. However, USD rose to 161.27, dropped to 160.25, and then rebounded to close little changed at 160.83 (+0.06%). USD traded on a firm note in early Asian trade, and the bias is on the upside, However, it is left to be seen if any advance can break above 161.50. The next resistance at 162.00 is unlikely to come into view. Support is at 160.70, followed by 160.30.”
1-3 WEEKS VIEW: “We have expected a higher USD since the middle of last month. In our latest narrative from last Thursday (27 Jun, spot at 160.60), we highlighted that ‘while conditions are severely overbought, strong momentum suggests further USD strength.’ We added, ‘resistance levels are at 161.00 and 161.50.’ On Friday, USD rose above 161.00, reaching a high of 161.27. Conditions remain oversold, but as long as 159.80 (’strong support’ level previously at 159.40) is not breached, USD is likely to continue to rise. The next resistance level above 161.50 is 162.00.”
- USD/CHF jumps to 0.9000 even though soft US core PCE inflation for May dampens US Dollar’s appeal.
- Fed officials want to see inflation declining for months before considering rate cuts.
- Investors await the Swiss CPI to get more cues about SNB’s interest rate outlook.
The USD/CHF pair moves higher to near the psychological resistance of 0.9000 in Monday’s European session. The Swiss Franc asset rises even though the US Dollar (USD) has faced a sharp sell-off after the United States (US) core Personal Consumption Expenditure Price Index (PCE) data for May fuelled expectations of early rate cuts by the Federal Reserve (Fed).
The US PCE report showed on Friday that price pressures declined expectedly. US annual core PCE price index, a Fed’s preferred inflation measure decelerated to 2.6% from the prior release of 2.8%.
The CME FedWatch tool shows that there will be two rate cuts this year and the policy-normalization process will begin from the September meeting.
Contrary to market expectations, Fed officials see only one rate cut this year and they want to see inflation declining for months before cutting interest rates.
After the US PCE inflation data release, San Francisco Fed Bank President Mary Daly told in an interview with CNBC that the soft PCE data is good news but we need more good data to gain confidence that inflation will decline to 2%.
Meanwhile, investors await the US ISM Manufacturing PMI data for June to know the health of the factory activities. The Manufacturing PMI report is expected to have improved to 49.0 from the prior release of 48.7 but will remain below the 50.0 threshold, which separates expansion from contraction.
On the Swiss Franc front, investors await the Swiss Consumer Price Index (CPI) data for June, which will be published on Thursday. The inflation data will indicate whether the Swiss National Bank (SNB) will extend its rate-cutting cycle in the September meeting. The SNB began reducing interest rates from March and delivered subsequent rate cuts in the June meeting.
Economic Indicator
Consumer Price Index (YoY)
The Consumer Price Index (CPI), released by the Swiss Federal Statistical Office on a monthly basis, measures the change in prices of goods and services which are representative of the private households’ consumption in Switzerland. The CPI is the main indicator to measure inflation and changes in purchasing trends. The YoY reading compares prices in the reference month to the same month a year earlier. Generally, a high reading is seen as bullish for the Swiss Franc (CHF), while a low reading is seen as bearish.
Read more.Next release: Thu Jul 04, 2024 06:30
Frequency: Monthly
Consensus: 1.4%
Previous: 1.4%
- Gold consolidates in a range amid investor uncertainty over when the Fed will cut interest rates.
- Despite falling inflation, Fed officials are reluctant to commit to interest-rate cuts.
- XAU/USD consolidates after breaching above a key trendline, invalidating the bearish H&S topping pattern that had been forming.
Gold (XAU/USD) edges lower to chart support on Monday as it continues trading in the range it has been in since it peaked at its all-time high of $2,450 on May 20.
Uncertainty over when the US Federal Reserve (Fed) will begin cutting interest rates keeps investors guessing and limits directionality. Most Fed officials have been reluctant to commit to a first-rate cut date until more data proves inflation is coming down sustainably.
Gold is sensitive to interest rates because it is a non-interest-paying asset, so there is an opportunity cost to holding it. As such, it tends to benefit from more demand when interest rates are lower rather than higher.
Gold stuck in holding pattern as Fed awaits more evidence
Gold is in a sideways consolidation as traders await clearer signaling from the Fed about its policy intentions. Although the Fed’s preferred gauge of inflation, the US Personal Consumption Expenditures (PCE) Price Index continued to fall in line with expectations, reaching 2.6% year-over-year (YoY) in May – closer to the Fed’s 2.0% target – Fed officials speaking after the event still remained cautious about committing to cuts.
Richmond Fed President Thomas Barkin said on Friday that there were “lags” in monetary tightening playing out and cautioned that "services and shelter price-setters still have room to push prices higher." Prior to him, San Francisco Fed President Mary Daly told CNBC that cooling inflation shows that the monetary policy is working, but it’s too early to tell when it will be appropriate to cut rates.
Friday’s inflation data also showed the core PCE also fell to 2.6% from 2.8% previously on a YoY basis and 0.1% from 0.3% on a MoM basis.
Market-based bets of when the Fed could cut interest rates, meanwhile, continue to flag up the September meeting for a possible first cut. According to the CME FedWatch tool, which calculates chances using 30-day Fed Funds futures prices, the probability of a cut in (or before) September stands at 63%, slightly down from the 64% probability of Friday.
Gold in a win-win situation – Zaye Capital Markets
Gold is in a win-win scenario according to Naeem Aslam, Chief Investment Officer at Zaye Capital Markets, who expects the precious metal to eventually appreciate.
Whether the Fed does or doesn’t signal a rate cut, the outcome is likely to be positive for Gold, Aslam told Kitco, since maintaining high interest rates will still be positive for Gold in the long run as they will weigh on sentiment and the property market, increasing demand for Gold as a safe haven.
"Inflation is as low as it can be given the circumstances, and the Fed really needs to move away from its current stance and start giving signals to the market that an interest rate cut is coming. This is because if they don't do that, sentiment in the market would become a lot worse — one evidence of this is already here in terms of pending home sales data and the default levels that we see in the commercial market. So we think, in the absence of assurance, risk could actually increase in the market and it could favor the price of Gold," Aslam said. "On the other hand, if the Fed does give a signal for a rate cut, we would see an upward movement in the gold price due to the weakness in the dollar index," said the CIO.
Technical Analysis: Gold consolidates above broken trendline, invalidating H&S
Gold pulls back to find support at the downsloping trendline that it broke above last week, which connects the “Head” and “Right Shoulder” of the now invalidated Head and Shoulders (H&S) pattern that formed during April, May, and June.
XAU/USD Daily Chart
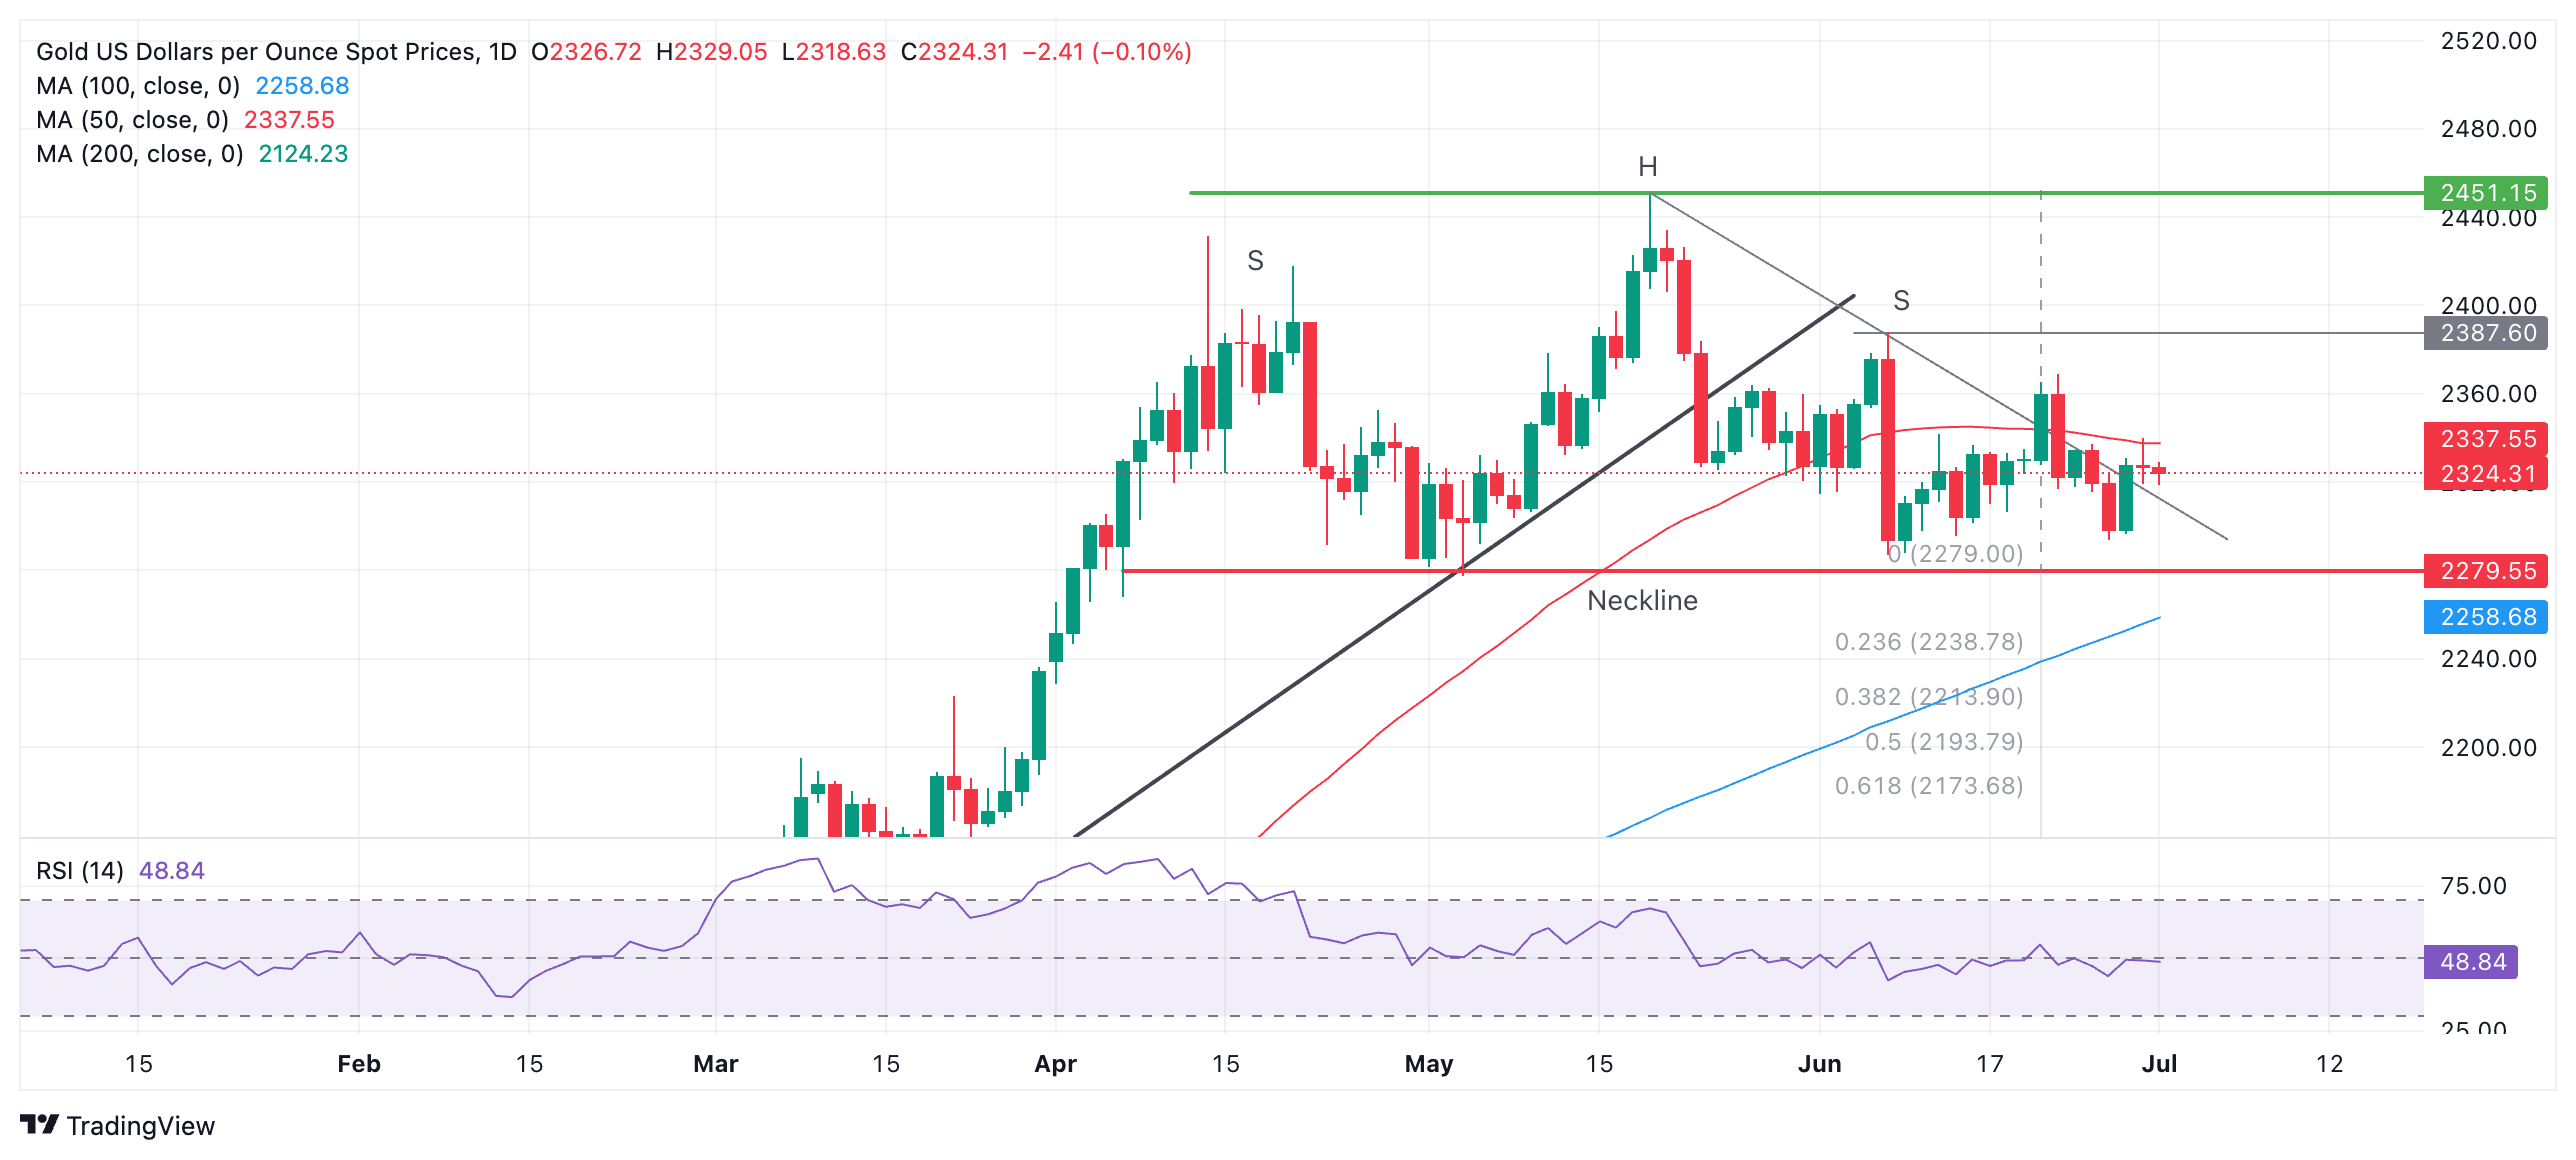
It is still possible a more complex “multi-shouldered” topping pattern has formed that might still prove bearish. Since the trendline break, however, the probabilities are lower.
There is a possibility Gold could rise to the $2,369 level (the June 21 high) if it breaks above $2,340. The next target above that would be $2,388, the June 7 high.
Alternatively, assuming the compromised topping pattern’s neckline at $2,279 is broken, a reversal lower may still follow, with a conservative target at $2,171 and a second target at $2,105 – the 0.618 ratio of the high of the pattern and the full ratio of the high of the pattern extrapolated lower.
There is a risk that the trend is now sideways in both the short and medium term. In the long term, Gold remains in an uptrend.
Gold FAQs
Gold has played a key role in human’s history as it has been widely used as a store of value and medium of exchange. Currently, apart from its shine and usage for jewelry, the precious metal is widely seen as a safe-haven asset, meaning that it is considered a good investment during turbulent times. Gold is also widely seen as a hedge against inflation and against depreciating currencies as it doesn’t rely on any specific issuer or government.
Central banks are the biggest Gold holders. In their aim to support their currencies in turbulent times, central banks tend to diversify their reserves and buy Gold to improve the perceived strength of the economy and the currency. High Gold reserves can be a source of trust for a country’s solvency. Central banks added 1,136 tonnes of Gold worth around $70 billion to their reserves in 2022, according to data from the World Gold Council. This is the highest yearly purchase since records began. Central banks from emerging economies such as China, India and Turkey are quickly increasing their Gold reserves.
Gold has an inverse correlation with the US Dollar and US Treasuries, which are both major reserve and safe-haven assets. When the Dollar depreciates, Gold tends to rise, enabling investors and central banks to diversify their assets in turbulent times. Gold is also inversely correlated with risk assets. A rally in the stock market tends to weaken Gold price, while sell-offs in riskier markets tend to favor the precious metal.
The price can move due to a wide range of factors. Geopolitical instability or fears of a deep recession can quickly make Gold price escalate due to its safe-haven status. As a yield-less asset, Gold tends to rise with lower interest rates, while higher cost of money usually weighs down on the yellow metal. Still, most moves depend on how the US Dollar (USD) behaves as the asset is priced in dollars (XAU/USD). A strong Dollar tends to keep the price of Gold controlled, whereas a weaker Dollar is likely to push Gold prices up.
The New Zealand Dollar (NZD) is likely to trade in a sideways range of 0.6080/0.6120. Room for further NZD weakness. Slowdown in momentum suggests 0.6040 could be out of reach, analysts at UOB Group suggest.
0.6040 mark is out of reach
24-HOUR VIEW: "We noted last Friday that 'the price action is likely part of a sideways trading phase.’ We held the view that NZD is likely to trade between 0.6065 and 0.6115. NZD then traded in a range of 0.6058/0.6104, closing at 0.6091 (+0.12%). We continue to expect NZD to sideways. That said, the slightly firmed underlying tone suggests a higher range of 0.6080/0.6120."
1-3 WEEKS VIEW: "We have held a negative NZD view for more than two weeks now. In our latest narrative from last Thursday (27 Jun, spot at 0.6080), we highlighted that NZD 'is likely to continue to weaken, and the next support level to watch is 0.6040.' Last Friday, NZD dipped to 0.6058 before rebounding. While there is still room for NZD to continue to weaken, the slowdown in momentum suggests 0.6040 could be out of reach this time. Conversely, if NZD breaks above 0.6135 (no change in ‘strong resistance’ level), it would mean that NZD is not weakening further."
Silver prices (XAG/USD) rose on Monday, according to FXStreet data. Silver trades at $29.22 per troy ounce, up 0.27% from the $29.14 it cost on Friday.
Silver prices have increased by 22.79% since the beginning of the year.
| Unit measure | Silver Price Today in USD |
|---|---|
| Troy Ounce | 29.22 |
| 1 Gram | 0.94 |
The Gold/Silver ratio, which shows the number of ounces of Silver needed to equal the value of one ounce of Gold, stood at 79.70 on Monday, down from 79.84 on Friday.
Silver FAQs
Silver is a precious metal highly traded among investors. It has been historically used as a store of value and a medium of exchange. Although less popular than Gold, traders may turn to Silver to diversify their investment portfolio, for its intrinsic value or as a potential hedge during high-inflation periods. Investors can buy physical Silver, in coins or in bars, or trade it through vehicles such as Exchange Traded Funds, which track its price on international markets.
Silver prices can move due to a wide range of factors. Geopolitical instability or fears of a deep recession can make Silver price escalate due to its safe-haven status, although to a lesser extent than Gold's. As a yieldless asset, Silver tends to rise with lower interest rates. Its moves also depend on how the US Dollar (USD) behaves as the asset is priced in dollars (XAG/USD). A strong Dollar tends to keep the price of Silver at bay, whereas a weaker Dollar is likely to propel prices up. Other factors such as investment demand, mining supply – Silver is much more abundant than Gold – and recycling rates can also affect prices.
Silver is widely used in industry, particularly in sectors such as electronics or solar energy, as it has one of the highest electric conductivity of all metals – more than Copper and Gold. A surge in demand can increase prices, while a decline tends to lower them. Dynamics in the US, Chinese and Indian economies can also contribute to price swings: for the US and particularly China, their big industrial sectors use Silver in various processes; in India, consumers’ demand for the precious metal for jewellery also plays a key role in setting prices.
Silver prices tend to follow Gold's moves. When Gold prices rise, Silver typically follows suit, as their status as safe-haven assets is similar. The Gold/Silver ratio, which shows the number of ounces of Silver needed to equal the value of one ounce of Gold, may help to determine the relative valuation between both metals. Some investors may consider a high ratio as an indicator that Silver is undervalued, or Gold is overvalued. On the contrary, a low ratio might suggest that Gold is undervalued relative to Silver.
(An automation tool was used in creating this post.)
- EUR/JPY gains upside traction as sentiment improves to the far-right sweep in the first round of the French election.
- HCOB Eurozone Manufacturing PMI was revised higher to 45.8 in June but remained below the survey average of 51.6.
- The Japanese Yen may limit its downside as an upbeat Japan’s business confidence data lifts market sentiment.
EUR/JPY continues its winning streak for the fourth consecutive day, trading around 173.30 during the European session on Monday. The Euro has gained upside traction as the traders reacted positively to the far-right sweep in the first round of the French snap election on Sunday.
Marine Le Pen’s National Rally confirmed its status as France’s leading political force, marking the highest turnout in three decades. While Le Pen’s party secured a clear but not definitive victory, uncertainty prevails ahead of the second round of voting on July 7, as reported by France 24.
HCOB Eurozone Manufacturing PMI was revised higher to 45.8 in June from a preliminary estimate of 45.6. Still, the PMI remains well below the survey average of 51.6, with output contracting at the fastest rate so far this year. European Central Bank (ECB) Governing Council member Olli Rehn suggested last week that the central bank might cut interest rates twice more this year.
In Japan, upbeat Japan’s business confidence data lifts market sentiment, which might support the Japanese Yen, limiting the upside of the EUR/JPY cross. Japan’s Tankan Large Manufacturing Index rose to 13 in the second quarter from the previous reading of 11. The index hit the highest level in two years amid an improving economic outlook. Meanwhile, Japan’s Jibun Bank Manufacturing PMI for June was revised slightly lower to 50 from a preliminary reading of 50.1 but remained expansionary for the second straight month.
Additionally, the expected speculations about an imminent intervention by Japanese authorities also support the JPY. Reuters reported on Friday that Japanese Finance Minister Shunichi Suzuki said that the authorities were "deeply concerned" about the impact of "rapid and one-sided" foreign exchange moves on the economy. Suzuki added that excessive volatility in the currency market is undesirable and that authorities will respond appropriately to such moves.
Risk sentiment FAQs
In the world of financial jargon the two widely used terms “risk-on” and “risk off'' refer to the level of risk that investors are willing to stomach during the period referenced. In a “risk-on” market, investors are optimistic about the future and more willing to buy risky assets. In a “risk-off” market investors start to ‘play it safe’ because they are worried about the future, and therefore buy less risky assets that are more certain of bringing a return, even if it is relatively modest.
Typically, during periods of “risk-on”, stock markets will rise, most commodities – except Gold – will also gain in value, since they benefit from a positive growth outlook. The currencies of nations that are heavy commodity exporters strengthen because of increased demand, and Cryptocurrencies rise. In a “risk-off” market, Bonds go up – especially major government Bonds – Gold shines, and safe-haven currencies such as the Japanese Yen, Swiss Franc and US Dollar all benefit.
The Australian Dollar (AUD), the Canadian Dollar (CAD), the New Zealand Dollar (NZD) and minor FX like the Ruble (RUB) and the South African Rand (ZAR), all tend to rise in markets that are “risk-on”. This is because the economies of these currencies are heavily reliant on commodity exports for growth, and commodities tend to rise in price during risk-on periods. This is because investors foresee greater demand for raw materials in the future due to heightened economic activity.
The major currencies that tend to rise during periods of “risk-off” are the US Dollar (USD), the Japanese Yen (JPY) and the Swiss Franc (CHF). The US Dollar, because it is the world’s reserve currency, and because in times of crisis investors buy US government debt, which is seen as safe because the largest economy in the world is unlikely to default. The Yen, from increased demand for Japanese government bonds, because a high proportion are held by domestic investors who are unlikely to dump them – even in a crisis. The Swiss Franc, because strict Swiss banking laws offer investors enhanced capital protection.
The Australian Dollar (AUD) is likely to trade sideways between 0.6630 and 0.6685. AUD is likely to edge higher; the likelihood of it breaking clearly above the major resistance zone of 0.6705/0.67816 is low for now.
Major resistance zone exists at 0.6705/0.6715
24-HOUR VIEW: “We expected AUD to trade in a 0.6625/0.6675 range last Friday. However, after dipping to a low of 0.6620, AUD rose sharply, reaching a high of 0.6685. AUD closed on a firm note at 0.6670 (+0.34%). The sharp rise appears to be overextended, and AUD is unlikely to advance much further. Today, it is more likely to trade sideways between 0.6630 and 0.6685.”
1-3 WEEKS VIEW: “In our most recent narrative from last Monday (24 Jun, spot at 0.6640), we were of the view that 'the current price action is likely part of a range-trading phase,' and we expected AUD to trade between 0.6600 and 0.6685. AUD traded within the range until last Friday, when it rose, touching 0.6685. There has been a slight increase in upward momentum, but not enough to suggest the start of a sustained advance. From here, as long as AUD remains above 0.6610, it is likely to edge higher, but the likelihood of it breaking clearly above the major resistance zone of 0.6705/0.6715 is low for now.”
Increase in momentum is beginning to fade. If the Pound Sterling (GBP) breaks above 1.2700, it would mean that it is not weakening further, analysts at UOB Group note.
A break above 1.2700 to turn GBP higher
24-HOUR VIEW: “We noted last Friday that 'the price movements are likely part of a sideways trading phase,' and we expected GBP to trade between 1.2620 and 1.2670. Our expectations turned out to be correct, as GBP traded in a range of 1.2620/1.2670, closing largely unchanged (1.2646, +0.05%). There has been no increase in downward or upward momentum, and further sideways trading seems likely. Expected range for today: 1.2625/1.2675.”
1-3 WEEKS VIEW: “We have held a negative view in GBP for about 2 weeks now. In our latest narrative from last Thursday (27 Jun, spot at 1.2620), we noted that 'downward momentum is picking up again, and a break of 1.2600 would not be surprising.' Since then, GBP has not been able to make any further headway on the downside. The increase in momentum is beginning to fade, and if GBP breaks above 1.2700, it would mean that GBP is not weakening further.”
EUR could edge higher, but any advance is unlikely to break above 1.0760. EUR is likely to trade in a range for now, probably between 1.0680 and 1.0785, UOB Group analysts suggest.
The pair is moving towards resistance at 1.0785
24-HOUR VIEW: “Last Friday, we indicated that “the price action is likely part of a consolidation phase,” and we expected EUR to trade in a range of 1.0685/1.0730. Our view was not wrong, as EUR subsequently traded between 1.0683 and 1.0724, closing at 1.0713 (+0.10%). However, EUR opened higher in Sydney trade today. Upward momentum has increased, albeit not much. Today, EUR could edge higher, but any advance is unlikely to break above 1.0760. On the downside, support levels are at 1.0720, followed by 1.0700.”
1-3 WEEKS VIEW: “After EUR fell to a low of 1.0664, in our most recent narrative from last Thursday (27 Jun, spot at 1.0702), we indicated that “provided that 1.0735 is not breached, EUR is likely to remain under pressure, but a sustained decline is likely only if it can break clearly below 1.0640.” EUR broke above 1.0735 when it opened on a strong note in early Sydney today. The price action suggests that EUR is likely to trade in a range for now, probably between 1.0680 and 1.0785.”
- Silver price may extend its winning streak as recent inflation raises the odds of the Fed’s rate cuts.
- US PCE Price Index increased by 2.6% YoY in May, down from 2.7% in April.
- Silver may limit its upside due to demand uncertainties in China, the largest consumer of grey metal.
Silver price (XAG/USD) remains stable with a positive outlook, it may extend its winning streak for the third consecutive day. The XAG/USD pair trades around $29.10 per troy ounce during early European hours on Monday. The non-yielding asset gains ground as investors assess the Federal Reserve's (Fed) monetary policy outlook amid signs of cooling US inflation.
On Friday, the US Bureau of Economic Analysis reported that US inflation had eased to its lowest annual rate in over three years. The US Personal Consumption Expenditures (PCE) Price Index increased by 2.6% year-over-year in May, down from 2.7% in April, meeting market expectations. Meanwhile, Core PCE inflation also rose by 2.6% year-over-year, down from April’s 2.8% reading, aligning with estimates.
On Friday, Federal Reserve Bank of San Francisco President Mary Daly stated that while monetary policy is proving effective, it is still too early to determine when it will be appropriate to cut interest rates. Daly remarked, "If inflation stays sticky or comes down slowly, rates would need to be higher for longer," according to Reuters.
Demand uncertainties in China, the largest consumer of Silver, also pressured prices after an official report indicated a second consecutive month of manufacturing downturn in June. China's National Bureau of Statistics (NBS) reported that the Manufacturing PMI remained at 49.5 in June, consistent with market forecasts and marking the fourth instance of contraction.
Conversely, a private survey indicated the fastest growth in the manufacturing sector in three years. The Caixin Manufacturing PMI for China rose to 51.8 in June, defying expectations of a decline to 51.2 from May’s 51.7.
Silver FAQs
Silver is a precious metal highly traded among investors. It has been historically used as a store of value and a medium of exchange. Although less popular than Gold, traders may turn to Silver to diversify their investment portfolio, for its intrinsic value or as a potential hedge during high-inflation periods. Investors can buy physical Silver, in coins or in bars, or trade it through vehicles such as Exchange Traded Funds, which track its price on international markets.
Silver prices can move due to a wide range of factors. Geopolitical instability or fears of a deep recession can make Silver price escalate due to its safe-haven status, although to a lesser extent than Gold's. As a yieldless asset, Silver tends to rise with lower interest rates. Its moves also depend on how the US Dollar (USD) behaves as the asset is priced in dollars (XAG/USD). A strong Dollar tends to keep the price of Silver at bay, whereas a weaker Dollar is likely to propel prices up. Other factors such as investment demand, mining supply – Silver is much more abundant than Gold – and recycling rates can also affect prices.
Silver is widely used in industry, particularly in sectors such as electronics or solar energy, as it has one of the highest electric conductivity of all metals – more than Copper and Gold. A surge in demand can increase prices, while a decline tends to lower them. Dynamics in the US, Chinese and Indian economies can also contribute to price swings: for the US and particularly China, their big industrial sectors use Silver in various processes; in India, consumers’ demand for the precious metal for jewellery also plays a key role in setting prices.
Silver prices tend to follow Gold's moves. When Gold prices rise, Silver typically follows suit, as their status as safe-haven assets is similar. The Gold/Silver ratio, which shows the number of ounces of Silver needed to equal the value of one ounce of Gold, may help to determine the relative valuation between both metals. Some investors may consider a high ratio as an indicator that Silver is undervalued, or Gold is overvalued. On the contrary, a low ratio might suggest that Gold is undervalued relative to Silver.
- EUR/USD rises to near 1.0770 as the first round of France’s legislative elections showed the far-right dominance, but by a small margin.
- The US Dollar declines as the expected fall in the US core PCE boosts Fed rate cut bets.
- Investors await the preliminary German HICP and US ISM Manufacturing PMI for June.
EUR/USD gains 0.50% and jumps to more than a two-week high near 1.0770 in Monday’s European session. The major currency pair strengthens as exit polls of the first round of France's parliamentary elections on Sunday showed that Marine Le Pen's far-right National Rally (RN) is in a comfortable position but with a smaller margin than projected and a significant correction in the US Dollar (USD).
The uncertainty over RN gaining an absolute majority has significantly improved the Euro’s appeal. “We might actually get less fears of more expansionary and unsustainable fiscal policy if the far-right party did a little bit worse," said Carol Kong, a currency strategist at Commonwealth Bank of Australia.
Now, investors will turn to the second-round runoffs, scheduled for July 7.
On the monetary policy front, investors look for cues about whether the European Central Bank (ECB) will deliver subsequent rate cuts. The ECB started reducing interest rates in early June after maintaining a restrictive interest rate stance for two years to tame price pressures prompted by pandemic-led stimulus.
In Monday’s session, the major trigger for the Euro will be the preliminary German Harmonized Index of Consumer Prices (HICP) data for June, which will be published at 12:00 GMT. Economists expect annual HICP in the Eurozone’s largest economy to rise at a slower pace of 2.6% from the prior release of 2.8%. The monthly Consumer Price Index (CPI) is expected to rise at a higher pace of 0.2% from 0.1% in May.
The scenario in which German inflation declines expectedly or at a faster pace will boost expectations of early rate cuts by the ECB, while hot numbers will ease the ECB’s subsequent rate cut hopes.
This week, the major trigger for the Euro will be the preliminary Eurozone’s HICP data for June, which will be published on Tuesday.
Daily digest market movers: EUR/USD moves higher as US Dollar weakens
- EUR/USD surges to 1.0770 as the US Dollar corrects after the expected decline in the United States (US) core Personal Consumption Expenditures Price Index (PCE) data for May cemented expectations of early rate cuts by the Federal Reserve (Fed). The US PCE report showed on Friday that the core PCE inflation data, the Fed’s preferred inflation measure, decelerated expectedly to 2.6% from the prior release of 2.8%.
- According to the CME FedWatch tool, 30-day Federal Fund futures pricing data shows that the probability for rate cuts in September is 63.4%. The data also suggest the Fed is expected to deliver two rate cuts this year against one projected by policymakers in their latest dot plot.
- The US Dollar Index (DXY), which tracks the Greenback’s value against six major currencies, declines to near 105.40.
- This week, the US Dollar is expected to remain highly volatile as various economic data are lined up for release. In Monday’s session, investors will keenly focus on the ISM Manufacturing Purchasing Managers’ Index (PMI) report for June, which will be published at 14:00 GMT.
- Economists expect factory activity to improve to 49.0 in June from the prior reading of 48.7 but remain contracted, as a figure below the 50.0 threshold separates expansion from contraction. However, the preliminary S&P Global PMI report released on June 21 showed that the US Manufacturing PMI rose to a three-month high at 51.7 from May’s reading of 51.3
- In the PMI report, investors will also focus on other sub-components, such as the New Orders Index and Price Paid, which indicate the factory outlook and change in input prices of the manufacturing sector, respectively, and will provide cues about inflation expectations.
Technical Analysis: EUR/USD recovers from upward-sloping border of triangle formation
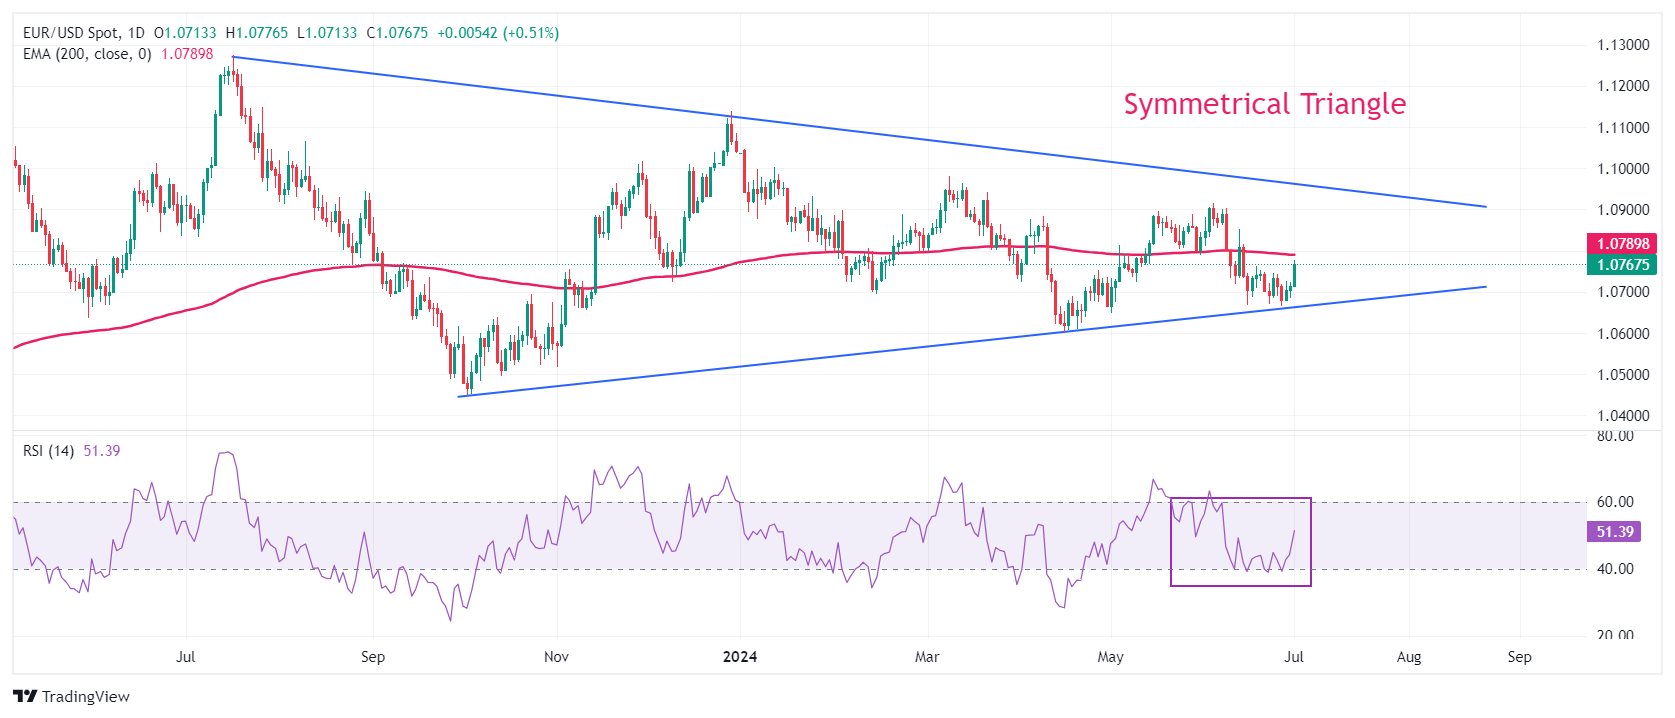
EUR/USD rebounds after discovering strong buying interest near the upward-sloping border of the Symmetrical Triangle formation on a daily timeframe near 1.0666, which is marked from 3 October 2023 low at 1.0448. The downward-sloping border of the above-mentioned chart pattern is plotted from 18 July 2023 high at 1.1276. The Symmetrical Triangle formation exhibits a sharp volatility contraction, which indicates low volume and narrow ticks.
The major currency pair remains below the 200-day Exponential Moving Average (EMA) near 1.0790, suggesting that the overall trend is bearish.
The 14-period Relative Strength Index (RSI) oscillates in the 40.00-60.00 range, suggesting indecisiveness among market participants.
Euro FAQs
The Euro is the currency for the 20 European Union countries that belong to the Eurozone. It is the second most heavily traded currency in the world behind the US Dollar. In 2022, it accounted for 31% of all foreign exchange transactions, with an average daily turnover of over $2.2 trillion a day. EUR/USD is the most heavily traded currency pair in the world, accounting for an estimated 30% off all transactions, followed by EUR/JPY (4%), EUR/GBP (3%) and EUR/AUD (2%).
The European Central Bank (ECB) in Frankfurt, Germany, is the reserve bank for the Eurozone. The ECB sets interest rates and manages monetary policy. The ECB’s primary mandate is to maintain price stability, which means either controlling inflation or stimulating growth. Its primary tool is the raising or lowering of interest rates. Relatively high interest rates – or the expectation of higher rates – will usually benefit the Euro and vice versa. The ECB Governing Council makes monetary policy decisions at meetings held eight times a year. Decisions are made by heads of the Eurozone national banks and six permanent members, including the President of the ECB, Christine Lagarde.
Eurozone inflation data, measured by the Harmonized Index of Consumer Prices (HICP), is an important econometric for the Euro. If inflation rises more than expected, especially if above the ECB’s 2% target, it obliges the ECB to raise interest rates to bring it back under control. Relatively high interest rates compared to its counterparts will usually benefit the Euro, as it makes the region more attractive as a place for global investors to park their money.
Data releases gauge the health of the economy and can impact on the Euro. Indicators such as GDP, Manufacturing and Services PMIs, employment, and consumer sentiment surveys can all influence the direction of the single currency. A strong economy is good for the Euro. Not only does it attract more foreign investment but it may encourage the ECB to put up interest rates, which will directly strengthen the Euro. Otherwise, if economic data is weak, the Euro is likely to fall. Economic data for the four largest economies in the euro area (Germany, France, Italy and Spain) are especially significant, as they account for 75% of the Eurozone’s economy.
Another significant data release for the Euro is the Trade Balance. This indicator measures the difference between what a country earns from its exports and what it spends on imports over a given period. If a country produces highly sought after exports then its currency will gain in value purely from the extra demand created from foreign buyers seeking to purchase these goods. Therefore, a positive net Trade Balance strengthens a currency and vice versa for a negative balance.
Here is what you need to know on Monday, July 1:
The US Dollar (USD) struggles to find demand at the beginning of the third quarter as investors adjust their positions ahead of this week's key macroeconomic events and data releases. Later in the session, preliminary Consumer Price Index (CPI) data for June from Germany will be watched closely by investors. The ISM Manufacturing PMI for June and Construction Spending data for May will be featured in the US economic calendar.
US Dollar PRICE Today
The table below shows the percentage change of US Dollar (USD) against listed major currencies today. US Dollar was the weakest against the Euro.
| USD | EUR | GBP | JPY | CAD | AUD | NZD | CHF | |
|---|---|---|---|---|---|---|---|---|
| USD | -0.45% | -0.23% | 0.16% | 0.00% | -0.08% | -0.08% | 0.11% | |
| EUR | 0.45% | -0.01% | 0.31% | 0.15% | 0.25% | 0.05% | 0.25% | |
| GBP | 0.23% | 0.01% | 0.29% | 0.16% | 0.26% | 0.07% | 0.26% | |
| JPY | -0.16% | -0.31% | -0.29% | -0.15% | -0.18% | -0.24% | -0.03% | |
| CAD | -0.01% | -0.15% | -0.16% | 0.15% | -0.05% | -0.09% | 0.10% | |
| AUD | 0.08% | -0.25% | -0.26% | 0.18% | 0.05% | -0.20% | 0.07% | |
| NZD | 0.08% | -0.05% | -0.07% | 0.24% | 0.09% | 0.20% | 0.21% | |
| CHF | -0.11% | -0.25% | -0.26% | 0.03% | -0.10% | -0.07% | -0.21% |
The heat map shows percentage changes of major currencies against each other. The base currency is picked from the left column, while the quote currency is picked from the top row. For example, if you pick the US Dollar from the left column and move along the horizontal line to the Japanese Yen, the percentage change displayed in the box will represent USD (base)/JPY (quote).
The US Bureau of Economic Analysis reported on Friday that the Personal Consumption Expenditures (PCE) Price Index, the Federal Reserve's (Fed) preferred gauge of inflation, rose 2.6% on a yearly basis in May. On a monthly basis, the PCE Price Index remained unchanged. These readings matched analysts' estimates and the USD Index closed the last trading day of the second quarter in negative territory on Friday. Early Monday, the USD Index continues to push lower and was last seen fluctuating deep in negative territory near 105.50. Meanwhile, the benchmark 10-year US Treasury bond yield holds steady at around 4.4% and US stock index futures gain between 0.25% and 0.4% in the early European session.
France held the first round of parliamentary election on Sunday. Exit polls showed that Marine Le Pen's far-right National Rally (RN) party won around 34% of the vote, ahead of the left-wing coalition New Popular Front (NFP) and President Emmanuel Macron's Together alliance, which are projected to receive 29% and 20.5%-23% of the vote, respectively, according to Reuters. The second round of election will take place on July 7. EUR/USD started the week on a bullish note and was last seen gaining about 0.5% on the day at 1.0770.
GBP/USD benefits from the selling pressure surrounding the USD and rises toward 1.2700 after closing the previous week virtually unchanged.
AUD/USD started the week with a bullish gap but struggled to gather momentum. After edging higher toward 0.6700, AUD/USD lost its traction and was last seen trading flat on the day at around 0.6670.
USD/JPY fluctuates in a tight range near 161.00 in the European morning on Monday. On Friday, the pair touched a multi-decade high near 161.30 but retreated afterward, with investors refraining from betting on further Japanese Yen weakness amid risk of intervention.
Economic Indicator
ISM Manufacturing PMI
The Institute for Supply Management (ISM) Manufacturing Purchasing Managers Index (PMI), released on a monthly basis, is a leading indicator gauging business activity in the US manufacturing sector. The indicator is obtained from a survey of manufacturing supply executives based on information they have collected within their respective organizations. Survey responses reflect the change, if any, in the current month compared to the previous month. A reading above 50 indicates that the manufacturing economy is generally expanding, a bullish sign for the US Dollar (USD). A reading below 50 signals that factory activity is generally declining, which is seen as bearish for USD.
Read more.Last release: Mon Jun 03, 2024 14:00
Frequency: Monthly
Actual: 48.7
Consensus: 49.6
Previous: 49.2
Source: Institute for Supply Management
The Institute for Supply Management’s (ISM) Manufacturing Purchasing Managers Index (PMI) provides a reliable outlook on the state of the US manufacturing sector. A reading above 50 suggests that the business activity expanded during the survey period and vice versa. PMIs are considered to be leading indicators and could signal a shift in the economic cycle. Stronger-than-expected prints usually have a positive impact on the USD. In addition to the headline PMI, the Employment Index and the Prices Paid Index numbers are watched closely as they shine a light on the labour market and inflation.
Gold prices remained broadly unchanged in India on Monday, according to data compiled by FXStreet.
The price for Gold stood at 6,237.85 Indian Rupees (INR) per gram, broadly stable compared with the INR 6,239.41 it cost on Friday.
The price for Gold was broadly steady at INR 72,757.09 per tola from INR 72,775.23 per tola on friday.
| Unit measure | Gold Price in INR |
|---|---|
| 1 Gram | 6,237.85 |
| 10 Grams | 62,378.52 |
| Tola | 72,757.09 |
| Troy Ounce | 194,018.20 |
FXStreet calculates Gold prices in India by adapting international prices (USD/INR) to the local currency and measurement units. Prices are updated daily based on the market rates taken at the time of publication. Prices are just for reference and local rates could diverge slightly.
Gold FAQs
Gold has played a key role in human’s history as it has been widely used as a store of value and medium of exchange. Currently, apart from its shine and usage for jewelry, the precious metal is widely seen as a safe-haven asset, meaning that it is considered a good investment during turbulent times. Gold is also widely seen as a hedge against inflation and against depreciating currencies as it doesn’t rely on any specific issuer or government.
Central banks are the biggest Gold holders. In their aim to support their currencies in turbulent times, central banks tend to diversify their reserves and buy Gold to improve the perceived strength of the economy and the currency. High Gold reserves can be a source of trust for a country’s solvency. Central banks added 1,136 tonnes of Gold worth around $70 billion to their reserves in 2022, according to data from the World Gold Council. This is the highest yearly purchase since records began. Central banks from emerging economies such as China, India and Turkey are quickly increasing their Gold reserves.
Gold has an inverse correlation with the US Dollar and US Treasuries, which are both major reserve and safe-haven assets. When the Dollar depreciates, Gold tends to rise, enabling investors and central banks to diversify their assets in turbulent times. Gold is also inversely correlated with risk assets. A rally in the stock market tends to weaken Gold price, while sell-offs in riskier markets tend to favor the precious metal.
The price can move due to a wide range of factors. Geopolitical instability or fears of a deep recession can quickly make Gold price escalate due to its safe-haven status. As a yield-less asset, Gold tends to rise with lower interest rates, while higher cost of money usually weighs down on the yellow metal. Still, most moves depend on how the US Dollar (USD) behaves as the asset is priced in dollars (XAU/USD). A strong Dollar tends to keep the price of Gold controlled, whereas a weaker Dollar is likely to push Gold prices up.
(An automation tool was used in creating this post.)
- GBP/USD trades on a stronger note near 1.2680 in Monday’s early European session.
- The pair maintains the negative stance on the 4-hour chart, with the bearish RSI indicator.
- The key resistance level will emerge in the 1.2680-1.2685 region; the initial support level is located at 1.2610.
The GBP/USD pair attracts some buyers around 1.2680 during the early European session on Monday. The decline of the Greenback after softer US Personal Consumption Expenditures (PCE) Price Index data creates a tailwind for the major pair. Investors will keep an eye on the US ISM Manufacturing PMI for June on Monday. The general election in the United Kingdom is scheduled for Thursday.
According to the 4-hour chart, the bearish outlook of GBP/USD remains intact as it holds below the key 100-period Exponential Moving Average (EMA). However, the Relative Strength Index (RSI) crosses above the 50-midline, indicating that further upside looks favorable.
The key resistance level for GBP/USD will emerge in the 1.2680-1.2685 zone, portraying the confluence of the upper boundary of the Bollinger Band and the 100-period EMA. A decisive break above this level will see a rally to 1.2700, the psychological level and a high of June 25. Further north, the next hurdle is seen at 1.2740, a high of June 19.
On the flip side, the initial support level for the major pair is located at 1.2610, the lower limit of the Bollinger Band. The additional downside filter to watch is 1.2583, a low of May 15. The next contention level is seen at 1.2502, a low of May 10.
GBP/USD 4-hour chart
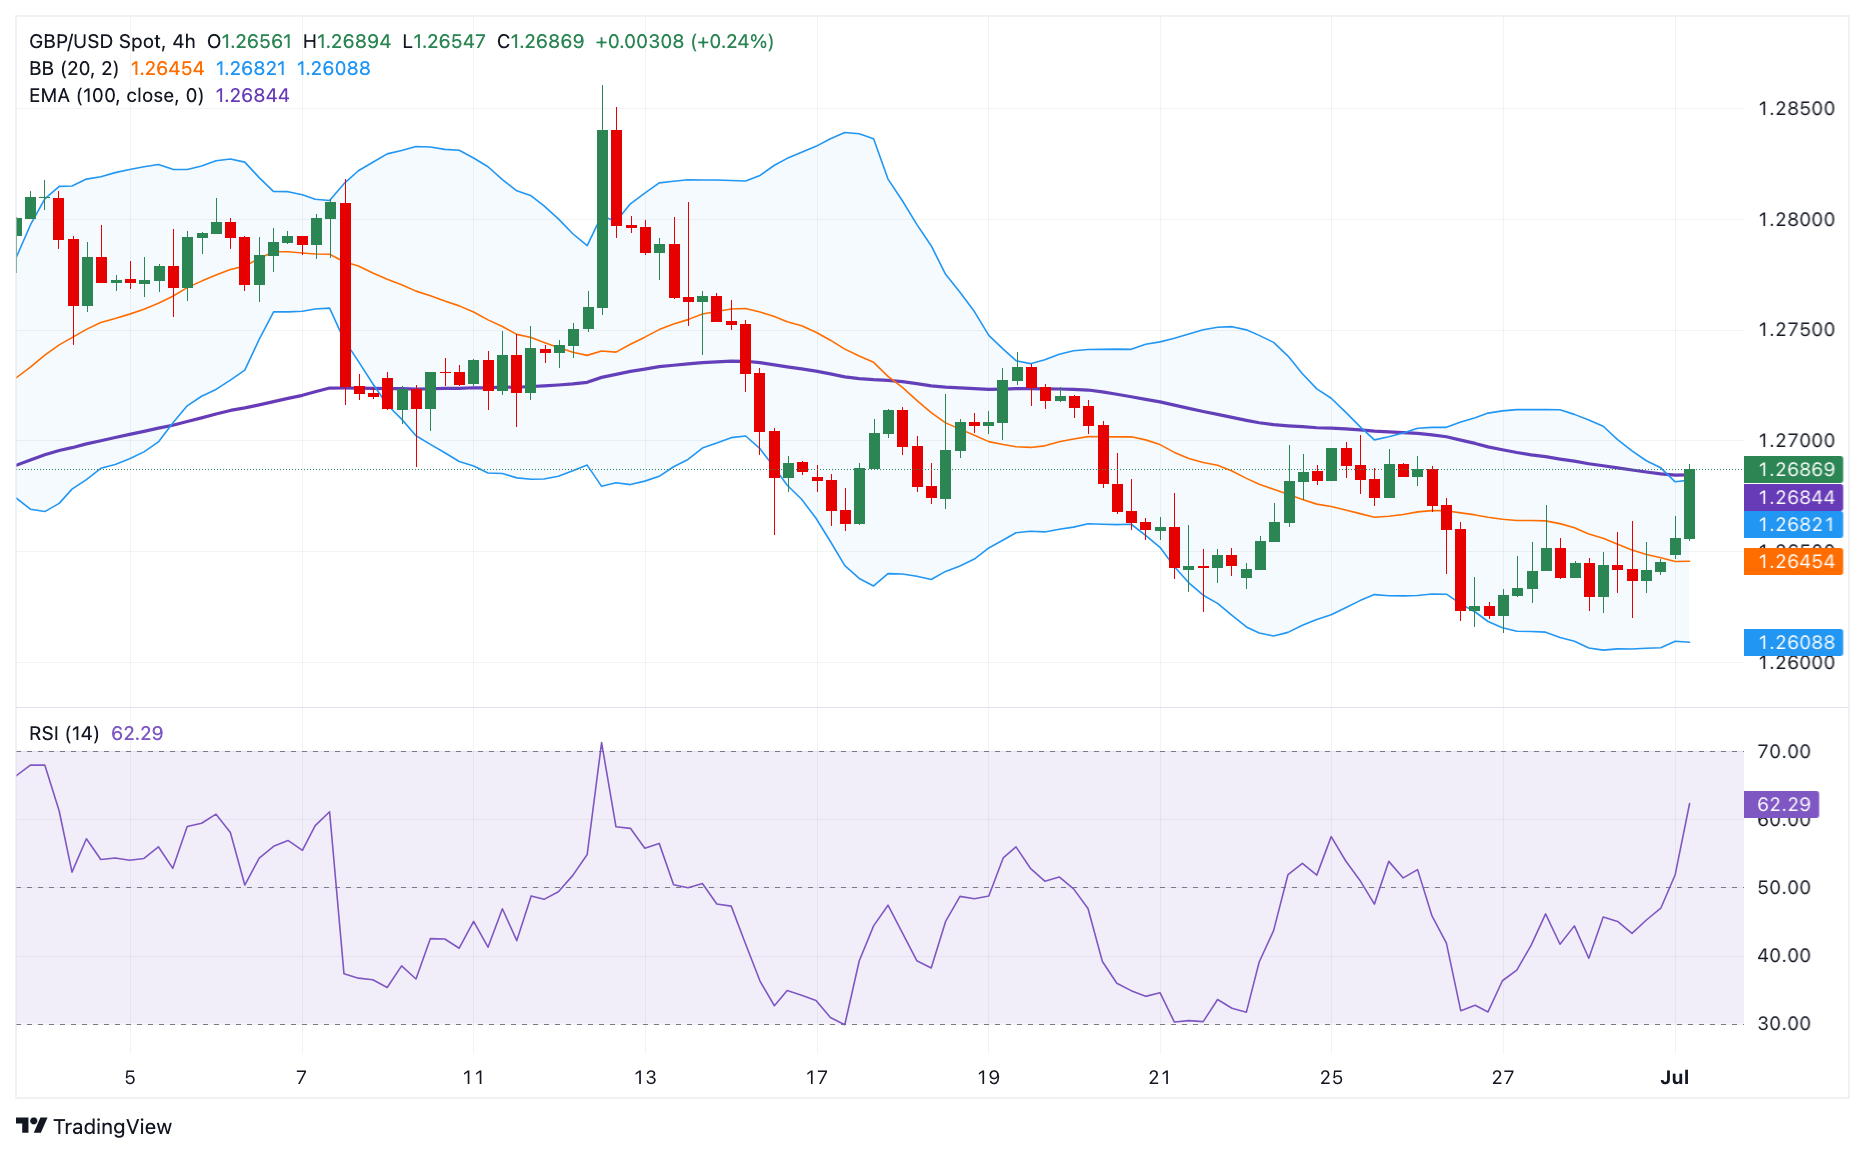
Pound Sterling FAQs
The Pound Sterling (GBP) is the oldest currency in the world (886 AD) and the official currency of the United Kingdom. It is the fourth most traded unit for foreign exchange (FX) in the world, accounting for 12% of all transactions, averaging $630 billion a day, according to 2022 data. Its key trading pairs are GBP/USD, aka ‘Cable’, which accounts for 11% of FX, GBP/JPY, or the ‘Dragon’ as it is known by traders (3%), and EUR/GBP (2%). The Pound Sterling is issued by the Bank of England (BoE).
The single most important factor influencing the value of the Pound Sterling is monetary policy decided by the Bank of England. The BoE bases its decisions on whether it has achieved its primary goal of “price stability” – a steady inflation rate of around 2%. Its primary tool for achieving this is the adjustment of interest rates. When inflation is too high, the BoE will try to rein it in by raising interest rates, making it more expensive for people and businesses to access credit. This is generally positive for GBP, as higher interest rates make the UK a more attractive place for global investors to park their money. When inflation falls too low it is a sign economic growth is slowing. In this scenario, the BoE will consider lowering interest rates to cheapen credit so businesses will borrow more to invest in growth-generating projects.
Data releases gauge the health of the economy and can impact the value of the Pound Sterling. Indicators such as GDP, Manufacturing and Services PMIs, and employment can all influence the direction of the GBP. A strong economy is good for Sterling. Not only does it attract more foreign investment but it may encourage the BoE to put up interest rates, which will directly strengthen GBP. Otherwise, if economic data is weak, the Pound Sterling is likely to fall.
Another significant data release for the Pound Sterling is the Trade Balance. This indicator measures the difference between what a country earns from its exports and what it spends on imports over a given period. If a country produces highly sought-after exports, its currency will benefit purely from the extra demand created from foreign buyers seeking to purchase these goods. Therefore, a positive net Trade Balance strengthens a currency and vice versa for a negative balance.
French Finance Minister Bruno Le Maire said on Monday that “(we) will do all to ensure the far-right National Rally party does not get absolute majority.”
Additional quotes
The first round of parliament election marks a defeat for the presidential majority.
The real risk would be if far right national rally party wins an absolute majority.
Market reaction
The Euro has regained upside traction, as the European traders hit their desks early Monday and reacted positively to the far-right sweep in the first round of the French snap election on Sunday. At the time of writing, EUR/USD is trading 0.55% higher on the day at 1.0770.
FX option expiries for July 1 NY cut at 10:00 Eastern Time, via DTCC, can be found below
- EUR/USD: EUR amounts
- 1.0600 895m
- 1.0630 1.4b
- 1.0685 1.8b
- 1.0700 2.9b
- 1.0845 707m
- USD/JPY: USD amounts
- 159.50 1.2b
- 160.55 660m
- USD/CHF: USD amounts
- 0.9070 801m
- 0.9150 1.4b
- AUD/USD: AUD amounts
- 0.6750 695m
- EUR/GBP gains ground as investors’ sentiment improves due to Marine Le Pen’s National Rally leading the first round of legislative elections.
- Last week, ECB Governing Council member Olli Rehn hinted that the central bank could reduce interest rates twice more in 2024.
- The UK GDP (QoQ) recorded a 0.7% expansion in Q1, marking its strongest growth in over two years and mitigating expectations of rate cuts.
EUR/GBP continues its upward trend for the third consecutive day, hovering around 0.8500 during Monday's Asian session. The Euro advances as investors’ sentiment improves amidst Marine Le Pen’s National Rally confirming its status as France’s leading political force in the initial round of legislative elections, marking the highest turnout in three decades. While Le Pen’s party secured a clear but not definitive victory, uncertainty prevails ahead of the second round of voting on July 7, as reported by France 24.
Meanwhile, European Central Bank (ECB) Governing Council member Olli Rehn suggested last week that the central bank might cut interest rates twice more this year. Recent data showed that France's annual inflation rate matched expectations, slowing to 2.5%, while Spain's rate fell to 3.5%, slightly above forecasts. Conversely, Italy's inflation accelerated as anticipated to 0.9%. Moreover, Germany’s Consumer Price Index (CPI) data is scheduled for release on Monday.
In the United Kingdom (UK), the upcoming general election on Thursday may induce volatility in the EUR/GBP cross. According to the latest exit polls, the Opposition Labour Party is anticipated to prevail over the Conservative Party led by UK Prime Minister Rishi Sunak.
UK GDP (QoQ) figures have been upwardly revised, showing a 0.7% expansion in the first quarter, up from the previous quarter's 0.6% growth. This marks the strongest growth in over two years and has caused the UK's 10-year Gilt yield to rise to 4.17%, tempering expectations of rate cuts.
Inflation FAQs
Inflation measures the rise in the price of a representative basket of goods and services. Headline inflation is usually expressed as a percentage change on a month-on-month (MoM) and year-on-year (YoY) basis. Core inflation excludes more volatile elements such as food and fuel which can fluctuate because of geopolitical and seasonal factors. Core inflation is the figure economists focus on and is the level targeted by central banks, which are mandated to keep inflation at a manageable level, usually around 2%.
The Consumer Price Index (CPI) measures the change in prices of a basket of goods and services over a period of time. It is usually expressed as a percentage change on a month-on-month (MoM) and year-on-year (YoY) basis. Core CPI is the figure targeted by central banks as it excludes volatile food and fuel inputs. When Core CPI rises above 2% it usually results in higher interest rates and vice versa when it falls below 2%. Since higher interest rates are positive for a currency, higher inflation usually results in a stronger currency. The opposite is true when inflation falls.
Although it may seem counter-intuitive, high inflation in a country pushes up the value of its currency and vice versa for lower inflation. This is because the central bank will normally raise interest rates to combat the higher inflation, which attract more global capital inflows from investors looking for a lucrative place to park their money.
Formerly, Gold was the asset investors turned to in times of high inflation because it preserved its value, and whilst investors will often still buy Gold for its safe-haven properties in times of extreme market turmoil, this is not the case most of the time. This is because when inflation is high, central banks will put up interest rates to combat it. Higher interest rates are negative for Gold because they increase the opportunity-cost of holding Gold vis-a-vis an interest-bearing asset or placing the money in a cash deposit account. On the flipside, lower inflation tends to be positive for Gold as it brings interest rates down, making the bright metal a more viable investment alternative.
- EUR/USD gains strong positive traction after the first round of France's snap election.
- September Fed rate cut bets undermine the USD and contribute to the strong move.
- The technical setup supports prospects for a further intraday appreciation for the pair.
The EUR/USD pair builds on last week's rebound from the 1.0665 region, or a nearly two-month low and gains strong positive traction for the third successive day on Monday. The momentum lifts spot prices to the 1.0760 area, or a two-week high during the Asian session and is sponsored by a combination of factors.
Exit polls showed that Marine Le Pen's far-right National Rally (RN) party won the first round of France's snap elections on Sunday, though by a smaller margin than projected. This, in turn, provides a goodish lift to the shared currency, which, along with some follow-through US Dollar (USD) selling, fueled by rising bets for a September rate cut by the Federal Reserve (Fed), acts as a tailwind for the EUR/USD pair.
From a technical perspective, strength beyond the 100-period Simple Moving Average (SMA), along with positive oscillators on the 4-hour chart, favour bullish traders and support prospects for additional gains. Some follow-through buying beyond the 50% Fibonacci retracement level of the 1.0910-1.0666 downfall could lift the EUR/USD pair beyond the 50% Fibo. level, towards the 1.0800 mark, or the 200-period SMA.
The latter is closely followed by the 61.8% Fibo. level, around the 1.0815 region, which if cleared decisively will suggest that spot prices have formed a near-term bottom and pave the way for additional gains. The subsequent move up could extend further towards the 1.0855-1.0860 intermediate hurdle en route to the 1.0900 round-figure mark.
On the flip side, any meaningful slide now seems to find decent support near the 1.0720 region, or the 23.6% Fibo. level, ahead of the 1.0700 mark. Failure to defend the said support levels might expose last week's swing low, around the 1.0665 area, below which the EUR/USD pair is more likely to prolong its recent well-established downtrend witnessed over the past four weeks or so.
EUR/USD daily chart
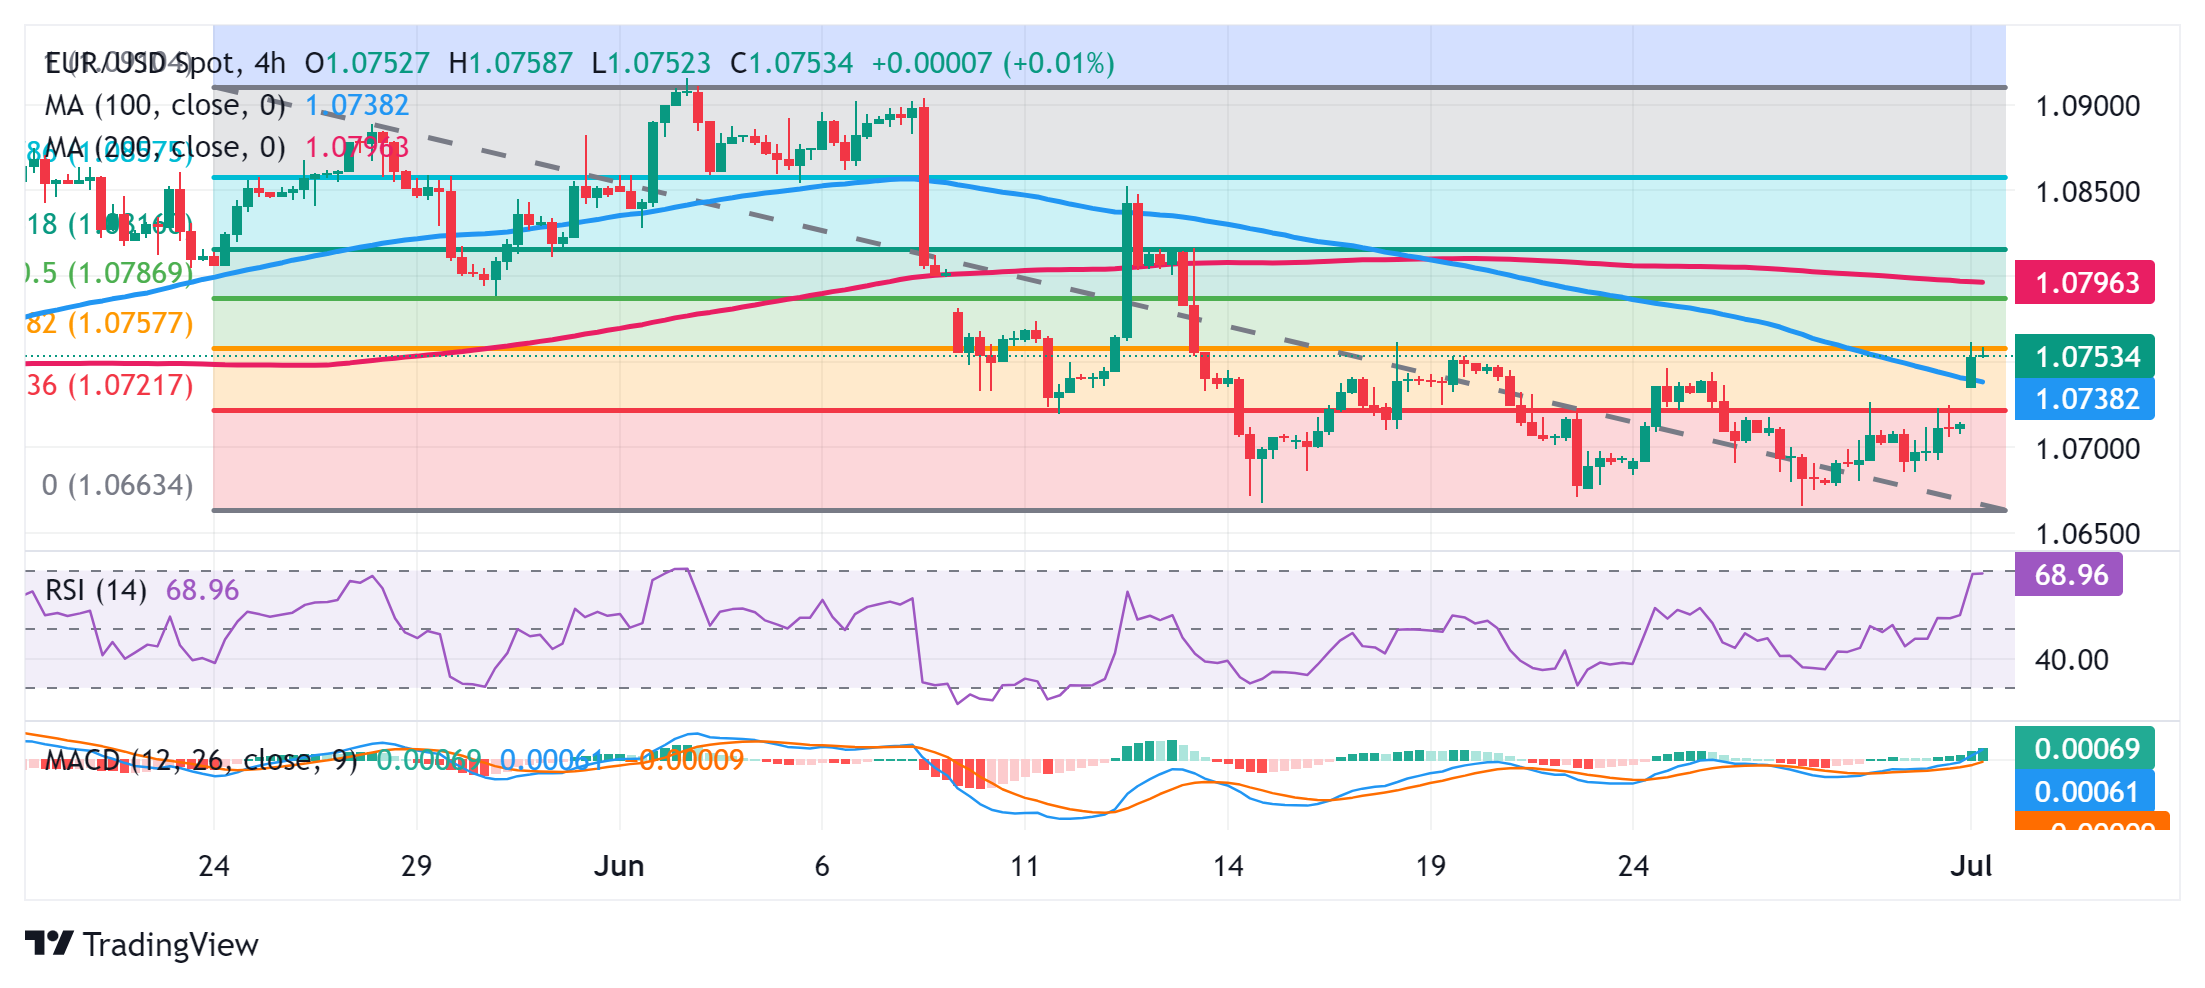
Euro FAQs
The Euro is the currency for the 20 European Union countries that belong to the Eurozone. It is the second most heavily traded currency in the world behind the US Dollar. In 2022, it accounted for 31% of all foreign exchange transactions, with an average daily turnover of over $2.2 trillion a day. EUR/USD is the most heavily traded currency pair in the world, accounting for an estimated 30% off all transactions, followed by EUR/JPY (4%), EUR/GBP (3%) and EUR/AUD (2%).
The European Central Bank (ECB) in Frankfurt, Germany, is the reserve bank for the Eurozone. The ECB sets interest rates and manages monetary policy. The ECB’s primary mandate is to maintain price stability, which means either controlling inflation or stimulating growth. Its primary tool is the raising or lowering of interest rates. Relatively high interest rates – or the expectation of higher rates – will usually benefit the Euro and vice versa. The ECB Governing Council makes monetary policy decisions at meetings held eight times a year. Decisions are made by heads of the Eurozone national banks and six permanent members, including the President of the ECB, Christine Lagarde.
Eurozone inflation data, measured by the Harmonized Index of Consumer Prices (HICP), is an important econometric for the Euro. If inflation rises more than expected, especially if above the ECB’s 2% target, it obliges the ECB to raise interest rates to bring it back under control. Relatively high interest rates compared to its counterparts will usually benefit the Euro, as it makes the region more attractive as a place for global investors to park their money.
Data releases gauge the health of the economy and can impact on the Euro. Indicators such as GDP, Manufacturing and Services PMIs, employment, and consumer sentiment surveys can all influence the direction of the single currency. A strong economy is good for the Euro. Not only does it attract more foreign investment but it may encourage the ECB to put up interest rates, which will directly strengthen the Euro. Otherwise, if economic data is weak, the Euro is likely to fall. Economic data for the four largest economies in the euro area (Germany, France, Italy and Spain) are especially significant, as they account for 75% of the Eurozone’s economy.
Another significant data release for the Euro is the Trade Balance. This indicator measures the difference between what a country earns from its exports and what it spends on imports over a given period. If a country produces highly sought after exports then its currency will gain in value purely from the extra demand created from foreign buyers seeking to purchase these goods. Therefore, a positive net Trade Balance strengthens a currency and vice versa for a negative balance.
- USD/CAD edges lower to 1.3675 amid Monday’s Asian session.
- The softer US PCE inflation boosts the Fed rate cut hopes, weighing on the pair.
- Higher crude oil prices continue to underpin the commodity-linked Canadian Dollar.
The USD/CAD pair trades on a softer note around 1.3675 during the Asian session on Monday. The signs of easing inflation in the United States boost the Fed rate cut hopes, which undermine the US Dollar (USD). Investors will take more cues from the US ISM Manufacturing PMI for June, which is due on Monday.
Data released from the Commerce Department on Friday revealed that the US core PCE, the Federal Reserve’s (Fed) preferred inflation measure, rose 2.6% year over year in May from 2.8% in April, matching the forecast. Meanwhile, the headline PCE climbed 2.6% YoY in May from 2.7% prior, in line with the estimation. The softer US inflation data drags the Greenback lower against the Loonie. San Francisco Federal Reserve Bank President Mary Daly said that it's really challenging to look anywhere and not see monetary policy working: we have growth slowing, spending slowing, the labor market slowing, inflation coming down.”
On the Loonie front, the rise in crude oil prices provides some support to the commodity-linked Canadian Dollar (CAD). It's worth noting that higher oil prices could support the CAD, as Canada is the major crude oil exporter to the United States.
Additionally, inflation remained elevated in Canada in May, raising doubts about the Bank of Canada's (BoC) next interest rate decision. “The Bank of Canada will hold off until September for a second rate cut and then move again in December. Rate cuts are expected to continue throughout 2025 before the overnight rate settles at a neutral level of 2.75% by the end of next year,” according to Deloitte’s Economic Outlook Summer 2024.
Canadian Dollar FAQs
The key factors driving the Canadian Dollar (CAD) are the level of interest rates set by the Bank of Canada (BoC), the price of Oil, Canada’s largest export, the health of its economy, inflation and the Trade Balance, which is the difference between the value of Canada’s exports versus its imports. Other factors include market sentiment – whether investors are taking on more risky assets (risk-on) or seeking safe-havens (risk-off) – with risk-on being CAD-positive. As its largest trading partner, the health of the US economy is also a key factor influencing the Canadian Dollar.
The Bank of Canada (BoC) has a significant influence on the Canadian Dollar by setting the level of interest rates that banks can lend to one another. This influences the level of interest rates for everyone. The main goal of the BoC is to maintain inflation at 1-3% by adjusting interest rates up or down. Relatively higher interest rates tend to be positive for the CAD. The Bank of Canada can also use quantitative easing and tightening to influence credit conditions, with the former CAD-negative and the latter CAD-positive.
The price of Oil is a key factor impacting the value of the Canadian Dollar. Petroleum is Canada’s biggest export, so Oil price tends to have an immediate impact on the CAD value. Generally, if Oil price rises CAD also goes up, as aggregate demand for the currency increases. The opposite is the case if the price of Oil falls. Higher Oil prices also tend to result in a greater likelihood of a positive Trade Balance, which is also supportive of the CAD.
While inflation had always traditionally been thought of as a negative factor for a currency since it lowers the value of money, the opposite has actually been the case in modern times with the relaxation of cross-border capital controls. Higher inflation tends to lead central banks to put up interest rates which attracts more capital inflows from global investors seeking a lucrative place to keep their money. This increases demand for the local currency, which in Canada’s case is the Canadian Dollar.
Macroeconomic data releases gauge the health of the economy and can have an impact on the Canadian Dollar. Indicators such as GDP, Manufacturing and Services PMIs, employment, and consumer sentiment surveys can all influence the direction of the CAD. A strong economy is good for the Canadian Dollar. Not only does it attract more foreign investment but it may encourage the Bank of Canada to put up interest rates, leading to a stronger currency. If economic data is weak, however, the CAD is likely to fall.
- The Japanese Yen hovers around its 38-year low of 161.28.
- The JPY may limit its downside due to possible intervention by Japanese authorities.
- The US Dollar struggles as recent inflation data raise expectations of Fed rate cuts in 2024.
The Japanese Yen (JPY) remains tepid on Monday near its lowest level of 161.28 since 1986. However, its downside seems limited as an upbeat Japan’s business confidence data lifted market sentiment. Additionally, the expected speculations about an imminent intervention by Japanese authorities support the JPY.
Japan’s Tankan Large Manufacturing Index rose to 13 in the second quarter from the previous reading of 11. The index hit the highest level in two years amid an improving economic outlook. Meanwhile, Japan’s Jibun Bank Manufacturing PMI for June was revised slightly lower to 50 from a preliminary reading of 50.1 but remained expansionary for the second straight month.
The US Dollar (USD) depreciates as recent inflation data raises expectations of the US Federal Reserve’s (Fed) deducting interest rates in 2024. The CME FedWatch Tool indicates that the likelihood of a Fed rate cut in December by 25 basis points has increased to nearly 32.0%, up from 28.7% a week earlier.
Daily Digest Market Movers: Japanese Yen declines despite upbeat business confidence data
- Japan’s Tankan Large Manufacturing Outlook rose to 14 in the second quarter from the previous reading of 10. Meanwhile, Large All Industry Capex increased to 11.1% in the second quarter from the previous 4.0% reading.
- On Friday, the Federal Reserve Bank of San Francisco President Mary Daly said that monetary policy is working. Still, it’s too early to tell when it will be appropriate to cut the interest rate. Daly stated, "If inflation stays sticky or comes down slowly, rates would need to be higher for longer,” per Reuters.
- On Friday, the US Bureau of Economic Analysis reported that US inflation eased to its lowest annual rate in over three years. The US Personal Consumption Expenditures (PCE) Price Index increased by 2.6% year-over-year in May, down from 2.7% in April, meeting market expectations. Core PCE inflation also rose by 2.6% year-over-year in May, down from 2.8% in April, aligning with estimates.
- Reuters reported on Friday that Japanese Finance Minister Shunichi Suzuki said that the authorities were "deeply concerned" about the impact of "rapid and one-sided" foreign exchange moves on the economy. Suzuki added that excessive volatility in the currency market is undesirable and that authorities will respond appropriately to such moves.
- On Friday, the data showed that Consumer Price Index (CPI) inflation in Tokyo rose to 2.3% year-over-year in June, up from the previous period's 2.2%. Core Tokyo CPI inflation, which excludes volatile food prices, also increased during the same period, reaching 2.1% YoY compared to the previous 1.9%, surpassing the median market forecast of 2.0% YoY.
Technical Analysis: USD/JPY hovers around 161.00
USD/JPY trades around 161.00 on Monday. The analysis of the daily chart shows a bullish bias, with the pair hovering near the upper boundary of an ascending channel pattern. The 14-day Relative Strength Index (RSI) is positioned above the 50 level, indicating upward momentum.
Surpassing the upper boundary of the ascending channel pattern around 161.50 will reinforce the bullish sentiment, potentially driving the USD/JPY pair toward the psychological level of 162.00.
On the downside, immediate support appears at the nine-day Exponential Moving Average (EMA) at 159.98. A breach below this level could intensify downward pressure on the USD/JPY pair, potentially driving it toward the lower boundary of the ascending channel around 158.20. A break below this level could push the pair to test June’s low at 154.55.
USD/JPY: Daily Chart
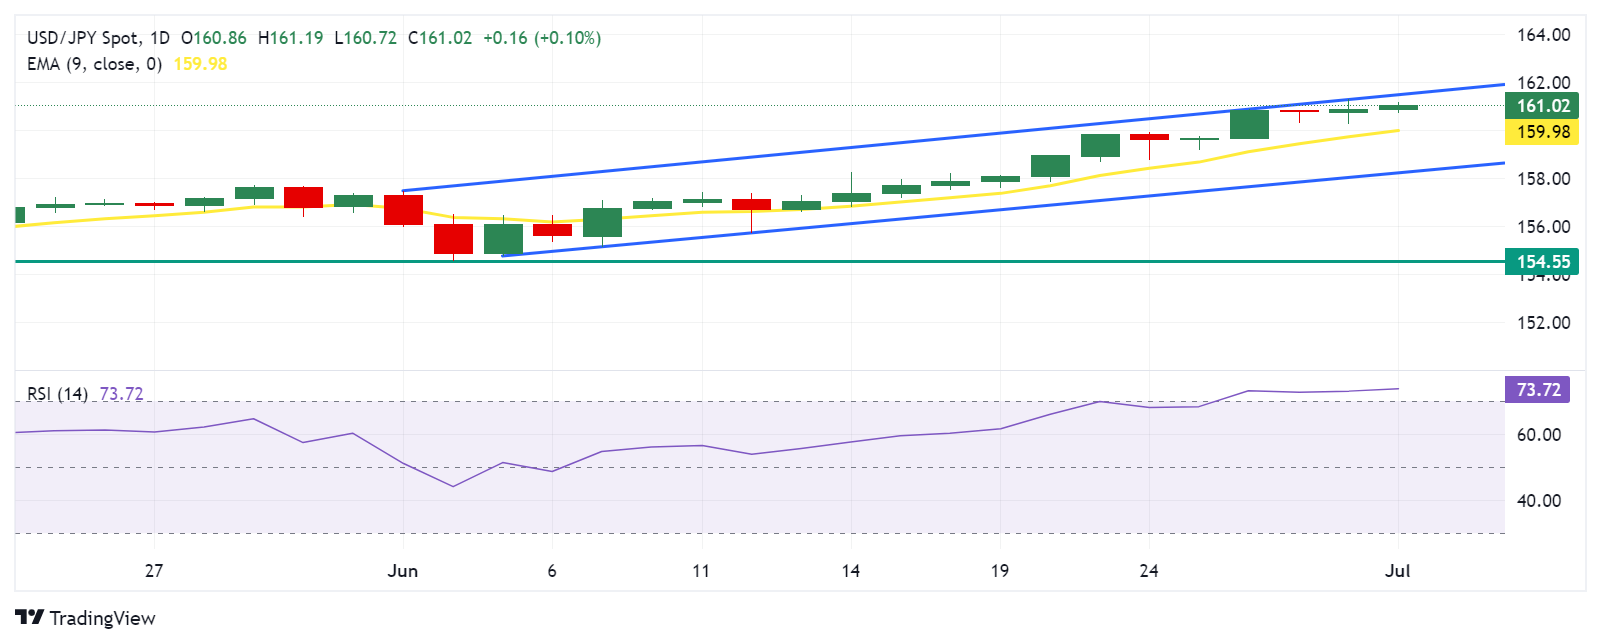
Japanese Yen PRICE Today
The table below shows the percentage change of Japanese Yen (JPY) against listed major currencies today. Japanese Yen was the strongest against the Swiss Franc.
| USD | EUR | GBP | JPY | CAD | AUD | NZD | CHF | |
|---|---|---|---|---|---|---|---|---|
| USD | -0.40% | -0.09% | 0.16% | 0.00% | 0.04% | -0.05% | 0.14% | |
| EUR | 0.40% | 0.07% | 0.24% | 0.09% | 0.32% | 0.03% | 0.23% | |
| GBP | 0.09% | -0.07% | 0.16% | 0.03% | 0.25% | -0.04% | 0.16% | |
| JPY | -0.16% | -0.24% | -0.16% | -0.15% | -0.06% | -0.22% | 0.00% | |
| CAD | -0.00% | -0.09% | -0.03% | 0.15% | 0.07% | -0.06% | 0.14% | |
| AUD | -0.04% | -0.32% | -0.25% | 0.06% | -0.07% | -0.28% | -0.01% | |
| NZD | 0.05% | -0.03% | 0.04% | 0.22% | 0.06% | 0.28% | 0.22% | |
| CHF | -0.14% | -0.23% | -0.16% | -0.01% | -0.14% | 0.00% | -0.22% |
The heat map shows percentage changes of major currencies against each other. The base currency is picked from the left column, while the quote currency is picked from the top row. For example, if you pick the Japanese Yen from the left column and move along the horizontal line to the US Dollar, the percentage change displayed in the box will represent JPY (base)/USD (quote).
Japanese Yen FAQs
The Japanese Yen (JPY) is one of the world’s most traded currencies. Its value is broadly determined by the performance of the Japanese economy, but more specifically by the Bank of Japan’s policy, the differential between Japanese and US bond yields, or risk sentiment among traders, among other factors.
One of the Bank of Japan’s mandates is currency control, so its moves are key for the Yen. The BoJ has directly intervened in currency markets sometimes, generally to lower the value of the Yen, although it refrains from doing it often due to political concerns of its main trading partners. The current BoJ ultra-loose monetary policy, based on massive stimulus to the economy, has caused the Yen to depreciate against its main currency peers. This process has exacerbated more recently due to an increasing policy divergence between the Bank of Japan and other main central banks, which have opted to increase interest rates sharply to fight decades-high levels of inflation.
The BoJ’s stance of sticking to ultra-loose monetary policy has led to a widening policy divergence with other central banks, particularly with the US Federal Reserve. This supports a widening of the differential between the 10-year US and Japanese bonds, which favors the US Dollar against the Japanese Yen.
The Japanese Yen is often seen as a safe-haven investment. This means that in times of market stress, investors are more likely to put their money in the Japanese currency due to its supposed reliability and stability. Turbulent times are likely to strengthen the Yen’s value against other currencies seen as more risky to invest in.
- WTI regains positive traction on Monday and stalls its corrective slide from a two-month top.
- Forecasts of a peak summer fuel demand and OPEC+ cuts in the third quarter lend support.
- September Fed rate cut bets undermine the USD and further seem to benefit the commodity.
West Texas Intermediate (WTI) US crude Oil prices attract some dip-buyers on the first day of a new week and remain well within the striking distance of a two-month peak touched on Friday. The commodity, however, seems confined in a familiar range held over the past two weeks or so and currently trades around mid-$81.00s, up over 0.50% for the day.
Persistent geopolitical risks stemming from the ongoing conflicts in the Middle East and Ukrainian attacks on Russian refineries continue to fuel concerns about supply disruptions from the key Oil producing countries. Furthermore, expectations of a peak summer fuel consumption and OPEC+ cuts in the third quarter could lead to a global oil market supply deficit, which, in turn, is seen as a key factor acting as a tailwind for Crude Oil prices.
Meanwhile, the US Personal Consumption Expenditures (PCE) Price Index released on Friday confirmed the disinflationary trend and lifted bets for a September interest rate cut by the Federal Reserve (Fed). This drags the US Dollar (USD) away from a two-month peak touched on Friday and lends additional support to the commodity. That said, China's economic woes warrant some caution for bulls and before positioning for any further gains.
Data released over the weekend showed that China's manufacturing activity fell for a second month in June while services activity slipped to a five-month low. This suggested that the world's second-largest economy remains fragile, which, in turn, could cap the upside for Crude Oil prices. Traders might also prefer to wait on the sidelines ahead of this week's important US macro releases, including the NFP report, for cues about the Fed's rate-cut path.
WTI Oil FAQs
WTI Oil is a type of Crude Oil sold on international markets. The WTI stands for West Texas Intermediate, one of three major types including Brent and Dubai Crude. WTI is also referred to as “light” and “sweet” because of its relatively low gravity and sulfur content respectively. It is considered a high quality Oil that is easily refined. It is sourced in the United States and distributed via the Cushing hub, which is considered “The Pipeline Crossroads of the World”. It is a benchmark for the Oil market and WTI price is frequently quoted in the media.
Like all assets, supply and demand are the key drivers of WTI Oil price. As such, global growth can be a driver of increased demand and vice versa for weak global growth. Political instability, wars, and sanctions can disrupt supply and impact prices. The decisions of OPEC, a group of major Oil-producing countries, is another key driver of price. The value of the US Dollar influences the price of WTI Crude Oil, since Oil is predominantly traded in US Dollars, thus a weaker US Dollar can make Oil more affordable and vice versa.
The weekly Oil inventory reports published by the American Petroleum Institute (API) and the Energy Information Agency (EIA) impact the price of WTI Oil. Changes in inventories reflect fluctuating supply and demand. If the data shows a drop in inventories it can indicate increased demand, pushing up Oil price. Higher inventories can reflect increased supply, pushing down prices. API’s report is published every Tuesday and EIA’s the day after. Their results are usually similar, falling within 1% of each other 75% of the time. The EIA data is considered more reliable, since it is a government agency.
OPEC (Organization of the Petroleum Exporting Countries) is a group of 13 Oil-producing nations who collectively decide production quotas for member countries at twice-yearly meetings. Their decisions often impact WTI Oil prices. When OPEC decides to lower quotas, it can tighten supply, pushing up Oil prices. When OPEC increases production, it has the opposite effect. OPEC+ refers to an expanded group that includes ten extra non-OPEC members, the most notable of which is Russia.
- Gold price struggles for a firm intraday direction on Monday amid mixed fundamental cues.
- Rising bets for a September Fed rate cut weigh on the USD and lend support to the metal.
- Geopolitics and political uncertainty also act as a tailwind, though rising bond yields cap gains.
Gold price (XAU/USD) kicks off the new week on a subdued note and oscillates in a range below a multi-day peak, around the $2,340 region touched following the release of the US Personal Consumption Expenditures (PCE) Price Index on Friday. The key US inflation data reaffirmed market expectations that the Federal Reserve (Fed) could cut interest rates in September and again in December. This, in turn, drags the US Dollar (USD) further away from a nearly two-month top touched last week and turns out to be a key factor acting as a tailwind for the commodity.
Apart from this, persistent geopolitical tensions and the uncertainty over the final outcome of France's shock snap election lend some support to the safe-haven Gold price. Meanwhile, the Fed projected only one interest rate cut in 2024, while officials have been arguing in favor of keeping rates higher for longer. Moreover, the increasing odds of a Trump presidency raised worries about the imposition of aggressive tariffs, which could fuel inflation and trigger higher interest rates. This lifts the US Treasury bond yields to a multi-week high and caps the non-yielding yellow metal.
Daily Digest Market Movers: Gold price struggles to lure buyers amid the Fed rate-cut uncertainty
- A combination of diverging forces fails to provide any meaningful impetus to the Gold price and leads to subdued range-bound price action on the first day of a new week.
- Data published on Friday showed that inflation in May slowed to its lowest annual rate in more than three years, lifting bets for a rate cut by the Federal Reserve in September.
- The US Bureau of Economic Analysis reported that the Personal Consumption Expenditures (PCE) Price Index edged lower to 2.6% on a yearly basis in May from 2.7% in April.
- The core PCE Price Index, which excludes volatile food and energy prices, decelerated from 2.8% in April to 2.6% in May, marking the lowest annual rate since March 2021.
- The US Dollar retreats sharply from a nearly two-month peak in reaction to the in-line inflation data and drops to a multi-day low on Monday, lending support to the commodity.
- The first round of France's parliamentary election on Sunday provided little clarity on whether the far-right party will be able to form a government after next Sunday's run-off.
- Moreover, President Joe Biden's disastrous debate with Republican opponent Donald Trump adds to the political uncertainty amid geopolitical risks and lends support to the XAU/USD.
- Meanwhile, an official survey showed on Sunday that China's manufacturing activity fell for the second straight month in June, and services activity slipped to a five-month low.
- However, the latest data released on Monday revealed that China's Caixin Manufacturing PMI unexpectedly edged higher from 51.7 to 51.8 in June against the 51.2 expected.
- Meanwhile, the recent hawkish comments by influential FOMC members raise uncertainty about the Fed's rate-cut path, leading to a further rise in the US Treasury bond yields.
- Richmond Fed President Thomas Barkin said on Friday that he will proceed deliberately on monetary policy as services and shelter price-setters still have room to push prices higher.
- San Francisco Fed President Mary Daly told CNBC that cooling inflation shows that the monetary policy is working, but it’s too early to tell when it will be appropriate to cut rates.
- This, in turn, should keep a lid on any meaningful appreciating move for the non-yielding yellow metal ahead of this week's key US macro releases, including the NFP report on Friday.
- In the meantime, traders will take cues from the release of the US ISM Manufacturing PMI, which, along with the broader risk sentiment, should influence the commodity on Monday.
Technical Analysis: Gold price must find acceptance above 50-day SMA for bulls to seize control
From a technical perspective, Friday’s failure near the 50-day Simple Moving Average (SMA) support breakpoint, now turned resistance, favors bearish traders. That said, the lack of any follow-through selling, along with neutral oscillators on the daily chart, warrants some caution before positioning for any further depreciating move.
Meanwhile, the 50-day SMA, currently pegged around the $2,338-2,340 region, might continue to act as an immediate hurdle and a key pivotal point. A sustained strength beyond has the potential to lift the Gold price back towards the $2,360-2,365 supply zone, which if cleared, should allow bulls to reclaim the $2,400 round-figure mark. The momentum could extend further towards challenging the all-time peak, around the $2,450 area touched in May.
On the flip side, any meaningful slide is likely to find some support near the $2,300 round-figure mark ahead of the $2,285 horizontal zone. A convincing break below the latter will be seen as a fresh trigger for bearish traders and drag the Gold price to the 100-day SMA, currently near the $2,259 area. The XAU/USD could eventually drop to the $2,225-2,220 region en route to the $2,200 round-figure mark.
Gold FAQs
Gold has played a key role in human’s history as it has been widely used as a store of value and medium of exchange. Currently, apart from its shine and usage for jewelry, the precious metal is widely seen as a safe-haven asset, meaning that it is considered a good investment during turbulent times. Gold is also widely seen as a hedge against inflation and against depreciating currencies as it doesn’t rely on any specific issuer or government.
Central banks are the biggest Gold holders. In their aim to support their currencies in turbulent times, central banks tend to diversify their reserves and buy Gold to improve the perceived strength of the economy and the currency. High Gold reserves can be a source of trust for a country’s solvency. Central banks added 1,136 tonnes of Gold worth around $70 billion to their reserves in 2022, according to data from the World Gold Council. This is the highest yearly purchase since records began. Central banks from emerging economies such as China, India and Turkey are quickly increasing their Gold reserves.
Gold has an inverse correlation with the US Dollar and US Treasuries, which are both major reserve and safe-haven assets. When the Dollar depreciates, Gold tends to rise, enabling investors and central banks to diversify their assets in turbulent times. Gold is also inversely correlated with risk assets. A rally in the stock market tends to weaken Gold price, while sell-offs in riskier markets tend to favor the precious metal.
The price can move due to a wide range of factors. Geopolitical instability or fears of a deep recession can quickly make Gold price escalate due to its safe-haven status. As a yield-less asset, Gold tends to rise with lower interest rates, while higher cost of money usually weighs down on the yellow metal. Still, most moves depend on how the US Dollar (USD) behaves as the asset is priced in dollars (XAU/USD). A strong Dollar tends to keep the price of Gold controlled, whereas a weaker Dollar is likely to push Gold prices up.
- The Indian Rupee gains ground amid the weaker US Dollar in Monday’s early Asian session.
- Indian bonds were included in the JPMorgan Emerging Market Debt Index, boosting India’s foreign inflows and the INR.
- India’s HSBC Manufacturing PMI and US ISM Manufacturing reports will be in the spotlight on Monday.
The Indian Rupee (INR) strengthens on Monday on the softer US Dollar (USD). The foreign inflows by the inclusion of India's bonds into the JPMorgan emerging market debt index are expected to trigger billions of dollars into the world's fifth-largest economy, boosting the INR. Furthermore, the softer US Personal Consumption Expenditures (PCE) Price Index for May, which has its lowest annual rate in more than three years, weighs on the Greenback and acts as a headwind against the pair.
Meanwhile, further gains in crude oil prices might exert some selling pressure on the pair, as India is the world’s third-largest oil consumer after the United States (US) and China. On Monday, investors will focus on India’s HSBC Manufacturing PMI, which is estimated to improve from 57.5 to 58.5. Any signs of India’s weakness could exert some selling pressure on the Indian Rupee. On the US docket, ISM Manufacturing for June will be published.
Daily Digest Market Movers: Indian Rupee remains firm amid strong macroeconomic fundamentals
- Foreign currency market indicators had pointed to inflows, most likely owing to passive funds purchasing bonds, but many market players said inflows were lower than expected. Traders estimated inflows of up to $2 billion spread over Thursday and Friday.
- India’s equity benchmarks, the Sensex and the Nifty 50, ended the first half of the current calendar year on a positive note. The Nifty 50 rose 10.5%, while the Sensex gained 9.4% in the first six months of 2024, hitting record highs of 24,174 and 79,671.58, respectively.
- The US Personal Consumption Expenditures (PCE) Price Index increased 2.6% YoY in May, compared to 2.7% in April. This figure came in line with the market expectations. The core PCE inflation rose 2.6% YoY in May from 2.8% in April, which is in line with the estimation.
- San Francisco Fed President Mary Daly said on Friday that monetary policy is working, but it’s too early to tell when it will be appropriate to cut the interest rate. Daly further stated, "If inflation stays sticky or comes down slowly, rates would need to be higher for longer.”
- The US ISM Purchasing Managers Index (PMI) is estimated to improve to 49.0 in June from 48.7 in May.
Technical analysis: USD/INR might face some sell-off or consolidation in the near term
The Indian Rupee trades with mild gains on the day. The bullish outlook of the USD/INR pair remains intact on the daily timeframe as the pair holds above the key 100-day Exponential Moving Average (EMA). However, USD/INR could resume its downside journey if the pair crosses below the 100-day EMA. Additionally, the 14-day Relative Strength Index (RSI) stands below the 50-midline, indicating that further downside or consolidation cannot be ruled out.
Extended gains above 83.65, a high of June 26, will see a rally to the all-time high of 83.75. Any follow-through buying above this level will pave the way to the 84.00 psychological level.
On the other hand, the key support level for the pair is seen at the 83.30-83.35 region, the 100-day EMA. The additional downside level will expose the 83.00 round figure.
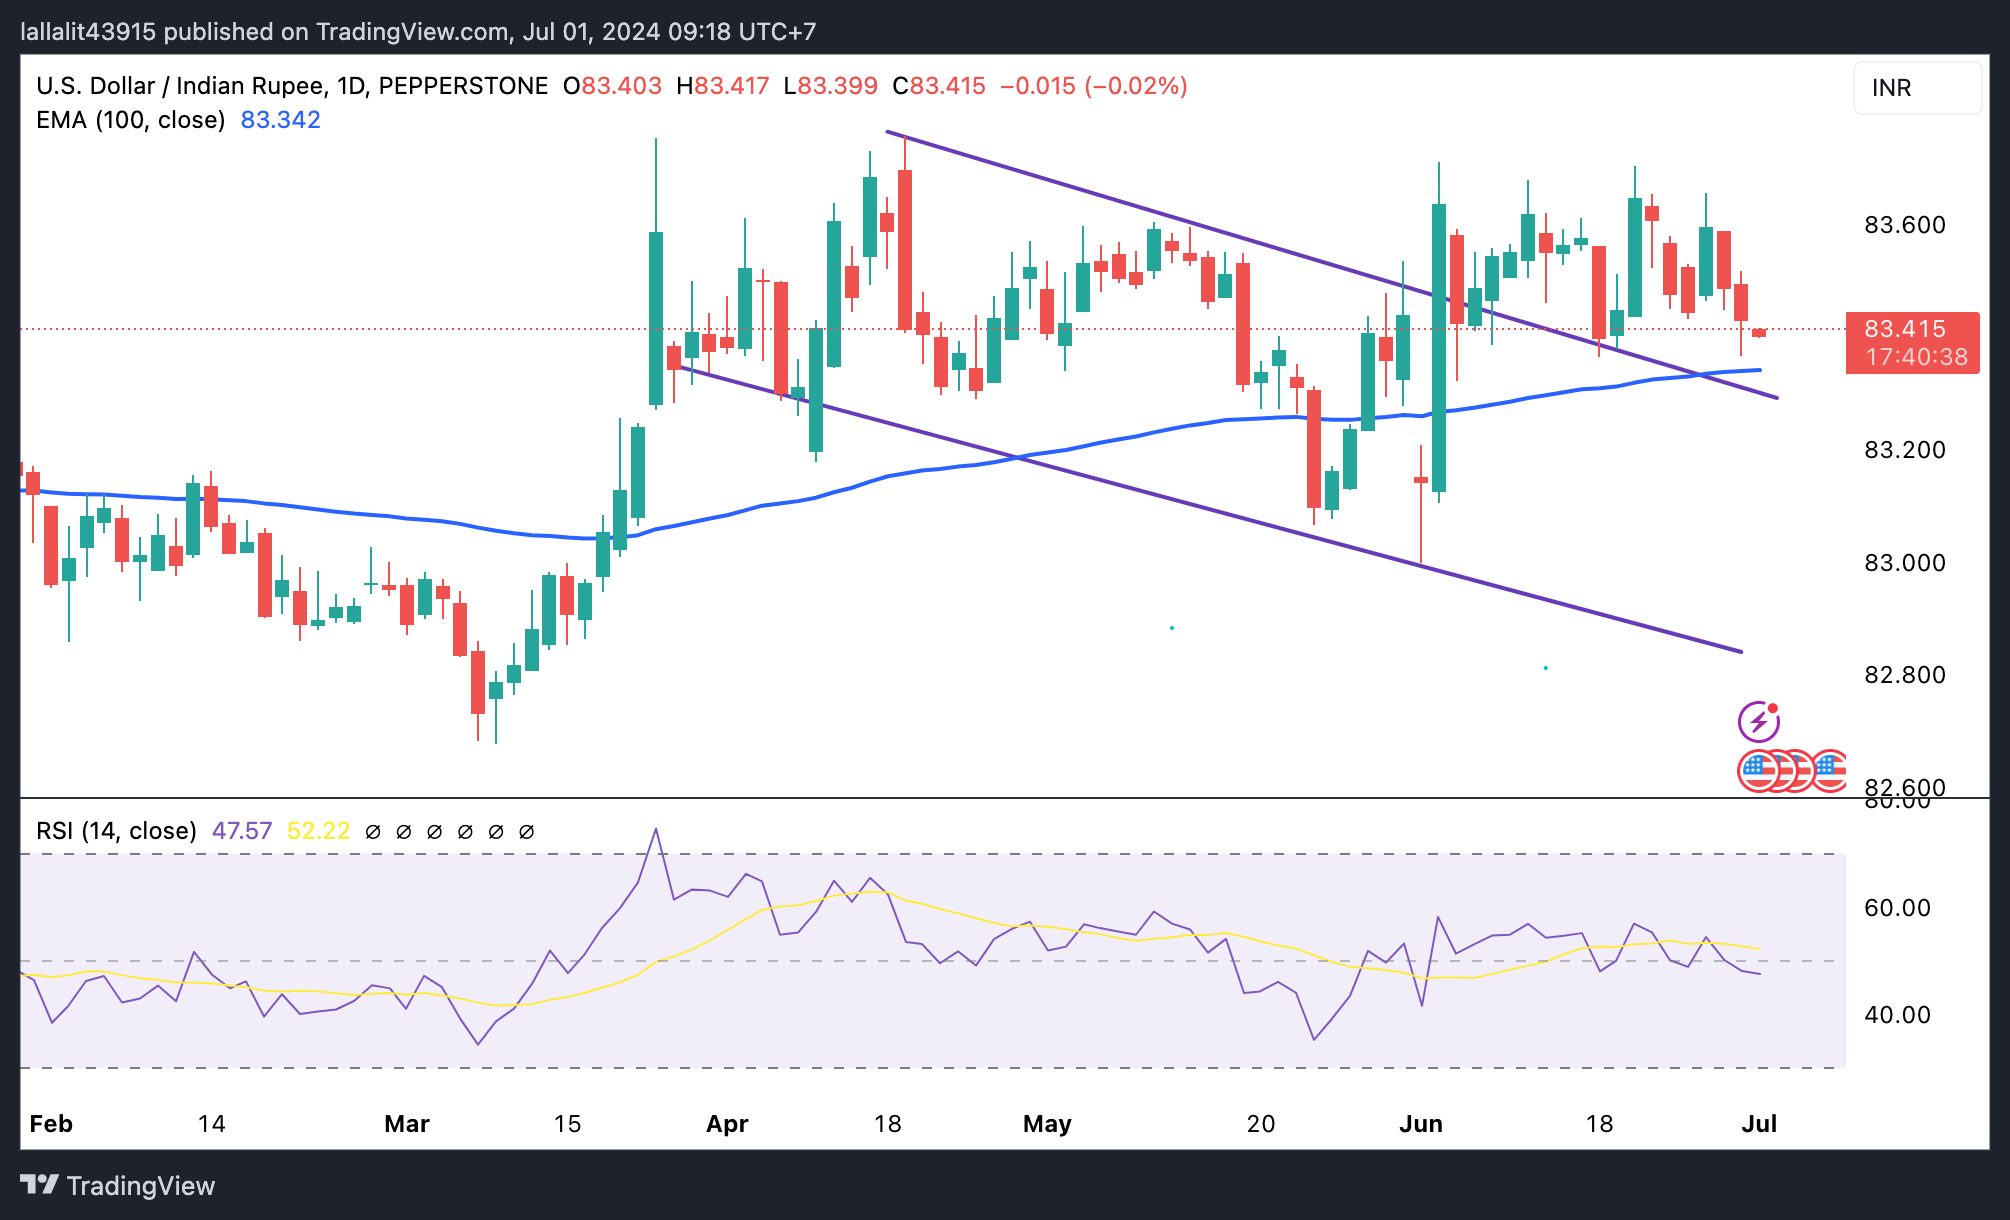
US Dollar price today
The table below shows the percentage change of US Dollar (USD) against listed major currencies today. US Dollar was the weakest against the Euro.
| USD | EUR | GBP | CAD | AUD | JPY | NZD | CHF | |
| USD | -0.15% | -0.10% | -0.01% | 0.04% | -0.01% | -0.04% | -0.13% | |
| EUR | 0.14% | 0.05% | 0.13% | 0.20% | 0.16% | 0.12% | 0.02% | |
| GBP | 0.09% | -0.07% | 0.08% | 0.14% | 0.10% | 0.06% | -0.04% | |
| CAD | 0.01% | -0.16% | -0.09% | 0.06% | 0.03% | -0.01% | -0.12% | |
| AUD | -0.04% | -0.20% | -0.14% | -0.06% | -0.04% | -0.08% | -0.18% | |
| JPY | 0.00% | -0.16% | -0.10% | 0.01% | 0.06% | -0.02% | -0.15% | |
| NZD | 0.04% | -0.12% | -0.06% | 0.01% | 0.08% | 0.04% | -0.09% | |
| CHF | 0.13% | -0.02% | 0.04% | 0.12% | 0.18% | 0.14% | 0.10% |
The heat map shows percentage changes of major currencies against each other. The base currency is picked from the left column, while the quote currency is picked from the top row. For example, if you pick the Euro from the left column and move along the horizontal line to the Japanese Yen, the percentage change displayed in the box will represent EUR (base)/JPY (quote).
Indian Rupee FAQs
The Indian Rupee (INR) is one of the most sensitive currencies to external factors. The price of Crude Oil (the country is highly dependent on imported Oil), the value of the US Dollar – most trade is conducted in USD – and the level of foreign investment, are all influential. Direct intervention by the Reserve Bank of India (RBI) in FX markets to keep the exchange rate stable, as well as the level of interest rates set by the RBI, are further major influencing factors on the Rupee.
The Reserve Bank of India (RBI) actively intervenes in forex markets to maintain a stable exchange rate, to help facilitate trade. In addition, the RBI tries to maintain the inflation rate at its 4% target by adjusting interest rates. Higher interest rates usually strengthen the Rupee. This is due to the role of the ‘carry trade’ in which investors borrow in countries with lower interest rates so as to place their money in countries’ offering relatively higher interest rates and profit from the difference.
Macroeconomic factors that influence the value of the Rupee include inflation, interest rates, the economic growth rate (GDP), the balance of trade, and inflows from foreign investment. A higher growth rate can lead to more overseas investment, pushing up demand for the Rupee. A less negative balance of trade will eventually lead to a stronger Rupee. Higher interest rates, especially real rates (interest rates less inflation) are also positive for the Rupee. A risk-on environment can lead to greater inflows of Foreign Direct and Indirect Investment (FDI and FII), which also benefit the Rupee.
Higher inflation, particularly, if it is comparatively higher than India’s peers, is generally negative for the currency as it reflects devaluation through oversupply. Inflation also increases the cost of exports, leading to more Rupees being sold to purchase foreign imports, which is Rupee-negative. At the same time, higher inflation usually leads to the Reserve Bank of India (RBI) raising interest rates and this can be positive for the Rupee, due to increased demand from international investors. The opposite effect is true of lower inflation.
- The Australian Dollar halts its losses after the release of the higher-than-expected China’s Manufacturing PMI.
- Australia’s Manufacturing PMI dropped for the fifth consecutive month to 47.2 in June.
- The US Dollar declines as recent inflation data raises the odds of the Fed’s rate cuts in 2024.
The Australian Dollar (AUD) holds ground as the Caixin Manufacturing PMI from China increased to 51.8 in June, defying the expectations of a decline to 51.2 from May’s 51.7. Any change in the Chinese economy could impact the Australian market as both nations are close trade partners.
The AUD received pressure as investors’ sentiment soured following data indicating that Australia's June manufacturing PMI contracted at its fastest rate since May 2020. Market focus now turns to the Reserve Bank of Australia's (RBA) upcoming policy meeting minutes on Tuesday for insights into the monetary policy direction.
The US Dollar (USD) depreciates due to the heightened expectations of the US Federal Reserve’s (Fed) deducting interest rates in 2024. The CME FedWatch Tool indicates that the likelihood of a Fed rate cut in December by 25 basis points has increased to nearly 32.0%, up from 28.7% a week earlier.
Daily Digest Market Movers: Australian Dollar holds ground after stronger China’s PMI
- The Judo Bank Australia Manufacturing PMI dropped for the fifth consecutive month to 47.2 in June from 49.7 in May. This decline is the fastest deterioration since May 2020.
- Australia’s 10-year government bond yield surged above 4.4%, as a hot inflation reading fueled fears that the Reserve Bank of Australia might raise interest rates again in the next meeting in August.
- NBS China’s Manufacturing PMI remained at 49.5 in June, consistent with market forecasts and marking the second consecutive month at this level. This result indicates the fourth instance of contraction. Meanwhile, the Non-Manufacturing PMI fell to 50.5 from the previous reading of 51.1, below market expectations of 51.0. Despite marking the 18th consecutive month of expansion in the service sector, this is the slowest growth rate since last December.
- On Friday, the US Bureau of Economic Analysis reported that US inflation eased to its lowest annual rate in over three years. The US Personal Consumption Expenditures (PCE) Price Index increased by 2.6% year-over-year in May, down from 2.7% in April, meeting market expectations. Core PCE inflation also rose by 2.6% year-over-year in May, down from 2.8% in April, aligning with estimates.
- The Reserve Bank of Australia’s (RBA) Deputy Governor Andrew Hauser. Hauser said it would be a “bad mistake” to formulate policy in response to a single inflation report. He emphasized that there is still a suite of economic data to come that will require detailed analysis, per Bloomberg.
- Last week, the Australian Bureau of Statistics showed that the monthly Consumer Price Index (CPI) increased by 4.0% in the year to May 2024, up from 3.6% in April and exceeding market forecasts of 3.8%. This marks the highest level since November 2023.
Technical Analysis: Australian Dollar edges lower toward 0.6650
The Australian Dollar trades around 0.6670 on Monday. The daily chart analysis indicates a neutral bias for the AUD/USD pair as it consolidates within a rectangle formation. The 14-day Relative Strength Index (RSI) is positioned slightly above the 50 level, suggesting a potential for bullish bias.
The AUD/USD pair may encounter resistance near the upper boundary of the rectangle formation around 0.6690, followed by the psychological level of 0.6700. Additional resistance is seen at 0.6714, the highest level since January.
On the downside, the AUD/USD pair finds support around the 50-day Exponential Moving Average (EMA) at 0.6621. A break below this level could lead the pair to test the lower boundary of the rectangle formation near 0.6585.
AUD/USD: Daily Chart
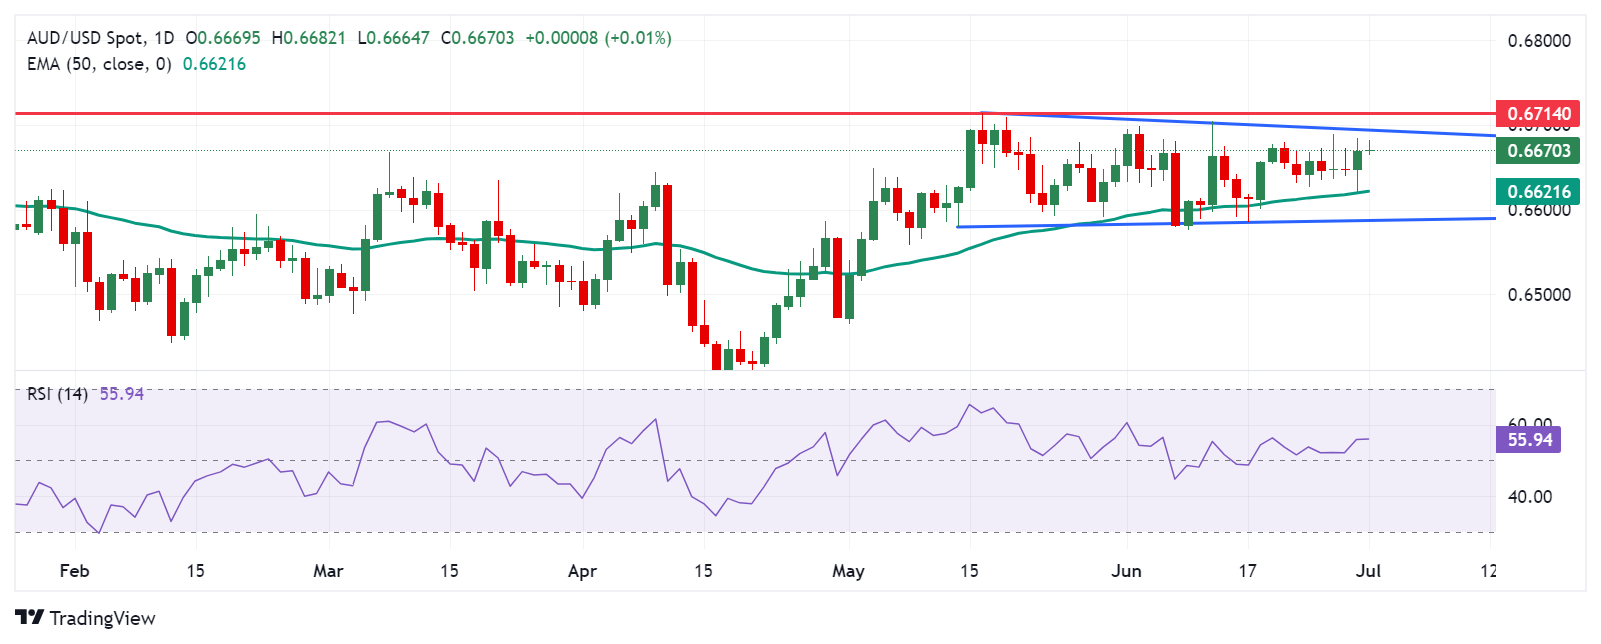
Australian Dollar PRICE Today
The table below shows the percentage change of Australian Dollar (AUD) against listed major currencies today. Australian Dollar was the strongest against the Japanese Yen.
| USD | EUR | GBP | JPY | CAD | AUD | NZD | CHF | |
|---|---|---|---|---|---|---|---|---|
| USD | -0.32% | -0.09% | 0.11% | 0.01% | 0.00% | -0.05% | 0.10% | |
| EUR | 0.32% | -0.00% | 0.14% | 0.03% | 0.21% | -0.03% | 0.12% | |
| GBP | 0.09% | 0.00% | 0.12% | 0.04% | 0.22% | -0.03% | 0.12% | |
| JPY | -0.11% | -0.14% | -0.12% | -0.12% | -0.06% | -0.16% | 0.01% | |
| CAD | -0.01% | -0.03% | -0.04% | 0.12% | 0.03% | -0.07% | 0.09% | |
| AUD | -0.00% | -0.21% | -0.22% | 0.06% | -0.03% | -0.23% | -0.01% | |
| NZD | 0.05% | 0.03% | 0.03% | 0.16% | 0.07% | 0.23% | 0.17% | |
| CHF | -0.10% | -0.12% | -0.12% | -0.01% | -0.09% | 0.01% | -0.17% |
The heat map shows percentage changes of major currencies against each other. The base currency is picked from the left column, while the quote currency is picked from the top row. For example, if you pick the Australian Dollar from the left column and move along the horizontal line to the US Dollar, the percentage change displayed in the box will represent AUD (base)/USD (quote).
Australian Dollar FAQs
One of the most significant factors for the Australian Dollar (AUD) is the level of interest rates set by the Reserve Bank of Australia (RBA). Because Australia is a resource-rich country another key driver is the price of its biggest export, Iron Ore. The health of the Chinese economy, its largest trading partner, is a factor, as well as inflation in Australia, its growth rate and Trade Balance. Market sentiment – whether investors are taking on more risky assets (risk-on) or seeking safe-havens (risk-off) – is also a factor, with risk-on positive for AUD.
The Reserve Bank of Australia (RBA) influences the Australian Dollar (AUD) by setting the level of interest rates that Australian banks can lend to each other. This influences the level of interest rates in the economy as a whole. The main goal of the RBA is to maintain a stable inflation rate of 2-3% by adjusting interest rates up or down. Relatively high interest rates compared to other major central banks support the AUD, and the opposite for relatively low. The RBA can also use quantitative easing and tightening to influence credit conditions, with the former AUD-negative and the latter AUD-positive.
China is Australia’s largest trading partner so the health of the Chinese economy is a major influence on the value of the Australian Dollar (AUD). When the Chinese economy is doing well it purchases more raw materials, goods and services from Australia, lifting demand for the AUD, and pushing up its value. The opposite is the case when the Chinese economy is not growing as fast as expected. Positive or negative surprises in Chinese growth data, therefore, often have a direct impact on the Australian Dollar and its pairs.
Iron Ore is Australia’s largest export, accounting for $118 billion a year according to data from 2021, with China as its primary destination. The price of Iron Ore, therefore, can be a driver of the Australian Dollar. Generally, if the price of Iron Ore rises, AUD also goes up, as aggregate demand for the currency increases. The opposite is the case if the price of Iron Ore falls. Higher Iron Ore prices also tend to result in a greater likelihood of a positive Trade Balance for Australia, which is also positive of the AUD.
The Trade Balance, which is the difference between what a country earns from its exports versus what it pays for its imports, is another factor that can influence the value of the Australian Dollar. If Australia produces highly sought after exports, then its currency will gain in value purely from the surplus demand created from foreign buyers seeking to purchase its exports versus what it spends to purchase imports. Therefore, a positive net Trade Balance strengthens the AUD, with the opposite effect if the Trade Balance is negative.
| Raw materials | Closed | Change, % |
|---|---|---|
| Silver | 29.139 | 0.67 |
| Gold | 232.629 | -0.03 |
| Palladium | 969.51 | 4.07 |
China's Caixin Manufacturing Purchasing Managers' Index (PMI) unexpectedly rose to 51.8 in June, against the 51.7 reading in May, according to the latest data released on Monday.
The data beat the market forecast of 51.2 in the reported month.
Key highlights (via Caixin)
Output rises at quickest pace since June 2022 as new orders increase.
Employment broadly stable.
Output price inflation at eight-month high.
“Both supply and demand continued to expand. The pace of manufacturing output growth has increased for five straight months, with the production subindex hitting a two-year high,” said Wang Zhe, an economist at Caixin Insight Group.
Wang added, “demand also rose, keeping the subindex for total new orders in expansionary territory for the 11th consecutive month.”
Data released by China’s National Bureau of Statistics (NBS) showed Sunday that the official Manufacturing Purchasing Managers' Index (PMI) held steady at 49.5 in June, as expected. The Non-Manufacturing PMI dipped to 50.5 in the same period vs. May’s 51.0 and the estimated 51.0 figure.
AUD/USD reaction to China’s PMI data
The upbeat Chinese Manufacturing PMI fails to positively impact the Aussie Dollar, as AUD/USD flirts with intraday lows near 0.6665 at the time of writing, modestly flat on the day.
Australian Dollar PRICE Today
The table below shows the percentage change of Australian Dollar (AUD) against listed major currencies today. Australian Dollar was the weakest against the New Zealand Dollar.
| USD | EUR | GBP | JPY | CAD | AUD | NZD | CHF | |
|---|---|---|---|---|---|---|---|---|
| USD | -0.32% | -0.11% | 0.08% | -0.01% | 0.00% | -0.07% | 0.10% | |
| EUR | 0.32% | -0.02% | 0.10% | 0.00% | 0.21% | -0.06% | 0.11% | |
| GBP | 0.11% | 0.02% | 0.10% | 0.04% | 0.23% | -0.04% | 0.13% | |
| JPY | -0.08% | -0.10% | -0.10% | -0.10% | -0.02% | -0.16% | 0.03% | |
| CAD | 0.01% | -0.00% | -0.04% | 0.10% | 0.06% | -0.06% | 0.11% | |
| AUD | -0.01% | -0.21% | -0.23% | 0.02% | -0.06% | -0.27% | -0.02% | |
| NZD | 0.07% | 0.06% | 0.04% | 0.16% | 0.06% | 0.27% | 0.19% | |
| CHF | -0.10% | -0.11% | -0.13% | -0.03% | -0.11% | 0.02% | -0.19% |
The heat map shows percentage changes of major currencies against each other. The base currency is picked from the left column, while the quote currency is picked from the top row. For example, if you pick the Australian Dollar from the left column and move along the horizontal line to the US Dollar, the percentage change displayed in the box will represent AUD (base)/USD (quote).
- NZD/USD draws support from a modest US weakness and a positive risk tone.
- Fed rate cut uncertainty should limit the USD losses and cap gains for the pair.
- China’s economic woes further warrant caution for aggressive bullish traders.
The NZD/USD pair attracts some dip-buying during the Asian session on Monday and looks to build on Friday's modest bounce from the vicinity of mid-0.6000s, or its lowest level since mid-May touched on Friday. Spot prices currently trade around the 0.6100 mark amid a modest US Dollar (USD) weakness, though lack bullish conviction amid the uncertainty over the Federal Reserve's (Fed) rate-cut path.
The US Personal Consumption Expenditures (PCE) Price Index released on Friday confirmed the disinflationary trend as shown by the Consumer Price Index (CPI) and Producer Price Index (PPI) for May. The data reaffirmed market bets that the Fed will start cutting interest rates at the September policy meeting, which keeps the USD bulls on the defensive. Apart from this, a positive tone around the US equity futures undermines the safe-haven buck and lends support to the NZD/USD pair.
That said, the Fed adopted a more hawkish stance at the end of the June policy meeting and forecasted only one interest rate cut in 2024. Furthermore, President Joe Biden's disastrous debate with his Republican opponent increased the odds of a Trump presidency. This, in turn, fueled worries that the imposition of aggressive tariffs by the Trump administration could fuel inflation and trigger higher rates, which remains supportive of elevated US Treasury bond yields and should limit the USD losses.
Adding to this, expectations that the Reserve Bank of New Zealand (RBNZ) will cut rates earlier than projected and China's economic woes might hold back bullish traders from placing fresh bets around the NZD/USD pair. In fact, official data released on Sunday showed that China's manufacturing activity fell for a second month in June while services activity slipped to a five-month low. This, in turn, warrants some caution before confirming that spot prices have formed a near-term bottom.
Moving ahead, traders now look forward to important US macro releases scheduled at the start of a new month, starting with the ISM Manufacturing PMI, for short-term opportunities later during the North American session. The focus, however, will remain glued to the closely-watched US monthly employment details, popularly known as the Nonfarm Payrolls (NFP) report on Friday. The latter will play a key role in influencing the near-term USD price dynamics and driving the NZD/USD pair.
US Dollar FAQs
The US Dollar (USD) is the official currency of the United States of America, and the ‘de facto’ currency of a significant number of other countries where it is found in circulation alongside local notes. It is the most heavily traded currency in the world, accounting for over 88% of all global foreign exchange turnover, or an average of $6.6 trillion in transactions per day, according to data from 2022. Following the second world war, the USD took over from the British Pound as the world’s reserve currency. For most of its history, the US Dollar was backed by Gold, until the Bretton Woods Agreement in 1971 when the Gold Standard went away.
The most important single factor impacting on the value of the US Dollar is monetary policy, which is shaped by the Federal Reserve (Fed). The Fed has two mandates: to achieve price stability (control inflation) and foster full employment. Its primary tool to achieve these two goals is by adjusting interest rates. When prices are rising too quickly and inflation is above the Fed’s 2% target, the Fed will raise rates, which helps the USD value. When inflation falls below 2% or the Unemployment Rate is too high, the Fed may lower interest rates, which weighs on the Greenback.
In extreme situations, the Federal Reserve can also print more Dollars and enact quantitative easing (QE). QE is the process by which the Fed substantially increases the flow of credit in a stuck financial system. It is a non-standard policy measure used when credit has dried up because banks will not lend to each other (out of the fear of counterparty default). It is a last resort when simply lowering interest rates is unlikely to achieve the necessary result. It was the Fed’s weapon of choice to combat the credit crunch that occurred during the Great Financial Crisis in 2008. It involves the Fed printing more Dollars and using them to buy US government bonds predominantly from financial institutions. QE usually leads to a weaker US Dollar.
Quantitative tightening (QT) is the reverse process whereby the Federal Reserve stops buying bonds from financial institutions and does not reinvest the principal from the bonds it holds maturing in new purchases. It is usually positive for the US Dollar.
The People’s Bank of China (PBOC) set the USD/CNY central rate on Monday at 7.1265, as against the previous day's fix of 7.1268 and 7.2558 Reuters estimate.
- GBP/USD edges higher to 1.2655 in Monday’s early Asian session.
- The softer US PCE inflation data prompted speculation that the Fed will cut the rate this year.
- The Opposition Labor Party is expected to win over the UK Prime Minister Rishi Sunak-led Conservative Party.
The GBP/USD pair trades on a stronger note around 1.2655 during the early Asian session on Monday. The US Dollar (USD) edges lower as the US Personal Consumption Expenditures (PCE) Price Index for May eased to its lowest annual rate in more than three years, which provides some support to the major pair. Traders await the US June ISM Purchasing Managers Index (PMI) for fresh impetus, which is due on Monday.
The US core PCE, the Federal Reserve’s (Fed) preferred inflation measure, continued to cool in May, prompting speculation that the Fed will cut the interest rate this year. The core PCE figure climbed 2.6% from 2.8% in April, matching the forecast. The headline PCE increased 2.6% YoY in May from 2.7% prior, in line with the estimation.
The Fed officials emphasized in recent weeks that they will cut interest rates when they gain confidence that inflation has decelerated to the 2% target. New York Fed President John Williams said that inflation is still at problematic levels and the US central bank will act to lower it. Fed Governor Michelle Bowman noted that while current Fed policies should be enough to bring inflation back to target, adding that the central bank shouldn't be unwilling to weigh further rate cuts if inflation data remains stubborn.
The general election in the United Kingdom will be held on Thursday and this event is likely to trigger the volatility in the pair. According to the latest exit polls, the Opposition Labor Party is expected to win over the UK Prime Minister Rishi Sunak-led Conservative Party.
Pound Sterling FAQs
The Pound Sterling (GBP) is the oldest currency in the world (886 AD) and the official currency of the United Kingdom. It is the fourth most traded unit for foreign exchange (FX) in the world, accounting for 12% of all transactions, averaging $630 billion a day, according to 2022 data. Its key trading pairs are GBP/USD, aka ‘Cable’, which accounts for 11% of FX, GBP/JPY, or the ‘Dragon’ as it is known by traders (3%), and EUR/GBP (2%). The Pound Sterling is issued by the Bank of England (BoE).
The single most important factor influencing the value of the Pound Sterling is monetary policy decided by the Bank of England. The BoE bases its decisions on whether it has achieved its primary goal of “price stability” – a steady inflation rate of around 2%. Its primary tool for achieving this is the adjustment of interest rates. When inflation is too high, the BoE will try to rein it in by raising interest rates, making it more expensive for people and businesses to access credit. This is generally positive for GBP, as higher interest rates make the UK a more attractive place for global investors to park their money. When inflation falls too low it is a sign economic growth is slowing. In this scenario, the BoE will consider lowering interest rates to cheapen credit so businesses will borrow more to invest in growth-generating projects.
Data releases gauge the health of the economy and can impact the value of the Pound Sterling. Indicators such as GDP, Manufacturing and Services PMIs, and employment can all influence the direction of the GBP. A strong economy is good for Sterling. Not only does it attract more foreign investment but it may encourage the BoE to put up interest rates, which will directly strengthen GBP. Otherwise, if economic data is weak, the Pound Sterling is likely to fall.
Another significant data release for the Pound Sterling is the Trade Balance. This indicator measures the difference between what a country earns from its exports and what it spends on imports over a given period. If a country produces highly sought-after exports, its currency will benefit purely from the extra demand created from foreign buyers seeking to purchase these goods. Therefore, a positive net Trade Balance strengthens a currency and vice versa for a negative balance.
- EUR/USD continues its winning streak as recent inflation data raises the odds of the Fed’s rate cuts in 2024.
- US Core PCE inflation rose by 2.6% YoY in May, down from 2.8% in April.
- The Euro received support as Marine Le Pen’s National Rally (RN) confirmed its status as the country’s leading political force.
EUR/USD extends its gains for the third successive day, trading around 1.0750 during the Asian hours on Monday. Speculation that the US Federal Reserve (Fed) might cut interest rates in 2024 is weighing on the US Dollar (USD), supporting the EUR/USD pair.
On Friday, the US Bureau of Economic Analysis reported that US inflation eased to its lowest annual rate in over three years. The US Personal Consumption Expenditures (PCE) Price Index increased by 2.6% year-over-year in May, down from 2.7% in April, meeting market expectations. Core PCE inflation also rose by 2.6% year-over-year in May, down from 2.8% in April, aligning with estimates.
On Friday, the Federal Reserve Bank of San Francisco President Mary Daly said that monetary policy is working. Still, it’s too early to tell when it will be appropriate to cut the interest rate. Daly stated, "If inflation stays sticky or comes down slowly, rates would need to be higher for longer,” per Reuters.
On the Euro's front, European Central Bank (ECB) Governing Council member Olli Rehn indicated last week that the central bank could lower interest rates two more times this year. Recent data showed that France's annual inflation rate slowed to 2.5%, in line with expectations, while Spain's rate decreased to 3.5%, slightly above expectations. In contrast, Italy's inflation accelerated to 0.9%, as anticipated. Additionally, Germany’s Consumer Price Index (CPI) data is scheduled to be released on Monday.
In France, Marine Le Pen’s National Rally (RN) confirmed its status as the country’s leading political force in the first round of legislative elections, which saw the highest turnout in three decades. Le Pen’s party secured a clear victory, though not a decisive one, leaving the outcome uncertain ahead of the second round of voting on July 7, according to France 24.
Euro FAQs
The Euro is the currency for the 20 European Union countries that belong to the Eurozone. It is the second most heavily traded currency in the world behind the US Dollar. In 2022, it accounted for 31% of all foreign exchange transactions, with an average daily turnover of over $2.2 trillion a day. EUR/USD is the most heavily traded currency pair in the world, accounting for an estimated 30% off all transactions, followed by EUR/JPY (4%), EUR/GBP (3%) and EUR/AUD (2%).
The European Central Bank (ECB) in Frankfurt, Germany, is the reserve bank for the Eurozone. The ECB sets interest rates and manages monetary policy. The ECB’s primary mandate is to maintain price stability, which means either controlling inflation or stimulating growth. Its primary tool is the raising or lowering of interest rates. Relatively high interest rates – or the expectation of higher rates – will usually benefit the Euro and vice versa. The ECB Governing Council makes monetary policy decisions at meetings held eight times a year. Decisions are made by heads of the Eurozone national banks and six permanent members, including the President of the ECB, Christine Lagarde.
Eurozone inflation data, measured by the Harmonized Index of Consumer Prices (HICP), is an important econometric for the Euro. If inflation rises more than expected, especially if above the ECB’s 2% target, it obliges the ECB to raise interest rates to bring it back under control. Relatively high interest rates compared to its counterparts will usually benefit the Euro, as it makes the region more attractive as a place for global investors to park their money.
Data releases gauge the health of the economy and can impact on the Euro. Indicators such as GDP, Manufacturing and Services PMIs, employment, and consumer sentiment surveys can all influence the direction of the single currency. A strong economy is good for the Euro. Not only does it attract more foreign investment but it may encourage the ECB to put up interest rates, which will directly strengthen the Euro. Otherwise, if economic data is weak, the Euro is likely to fall. Economic data for the four largest economies in the euro area (Germany, France, Italy and Spain) are especially significant, as they account for 75% of the Eurozone’s economy.
Another significant data release for the Euro is the Trade Balance. This indicator measures the difference between what a country earns from its exports and what it spends on imports over a given period. If a country produces highly sought after exports then its currency will gain in value purely from the extra demand created from foreign buyers seeking to purchase these goods. Therefore, a positive net Trade Balance strengthens a currency and vice versa for a negative balance.
- USD/JPY stands tall near a multi-decade high amid the big US-Japan rate differential.
- Intervention fears might hold back bulls from placing fresh bets around the major.
- Traders now look forward to the US ISM Manufacturing PMI for short-term impetus.
The USD/JPY pair kicks off the new week on a subdued note and consolidates its recent strong gains to the highest level since December 1986 touched on Friday. Spot prices currently trade with a mild positive bias around the 161.00 mark, though the upside seems limited in the wake of speculations about an imminent intervention by Japanese authorities to support the domestic currency.
In fact, Japan's Finance minister Shunichi Suzuki told a news conference on Friday that excessive volatility in the currency market is undesirable and that authorities will respond appropriately to such moves. Meanwhile, Japan appointed Atsushi Mimura as the new top foreign exchange diplomat on Friday. The move, however, does little to provide any respite to the Japanese Yen (JPY) as investors are uncertain about Atsushi's stance on currency policy. This, along with the wide interest rate differential between the United States and Japan, might continue to act as a tailwind for the USD/JPY pair.
The Bank of Japan (BoJ), so far, has failed to provide any cues about the timing of the next rate increase. In contrast, the Federal Reserve (Fed) sounded more hawkish at the end of the June policy meeting and forecasted only one interest rate cut in 2024. Moreover, the increasing odds of a Trump presidency raise worries about the imposition of aggressive tariffs, which could fuel inflation and trigger higher interest rates. This, in turn, lifts the US Treasury bond yields to a multi-week top and continues to underpin the US Dollar, lending additional support to the USD/JPY pair and validating the positive outlook.
The markets, meanwhile, are still pricing in a greater chance of a September Fed rate cut amid signs of easing inflation. The bets were reaffirmed by the US Personal Consumption Expenditures (PCE) Price Index, which confirmed the disinflationary trend as shown by the Consumer Price Index (CPI) and Producer Price Index (PPI) for May. This might hold back the USD bulls from placing aggressive bets and cap the upside for the USD/JPY pair. Traders now look to important US macro releases scheduled at the start of a new month, starting with the ISM Manufacturing PMI later this Monday, for a fresh impetus.
Japanese Yen FAQs
The Japanese Yen (JPY) is one of the world’s most traded currencies. Its value is broadly determined by the performance of the Japanese economy, but more specifically by the Bank of Japan’s policy, the differential between Japanese and US bond yields, or risk sentiment among traders, among other factors.
One of the Bank of Japan’s mandates is currency control, so its moves are key for the Yen. The BoJ has directly intervened in currency markets sometimes, generally to lower the value of the Yen, although it refrains from doing it often due to political concerns of its main trading partners. The current BoJ ultra-loose monetary policy, based on massive stimulus to the economy, has caused the Yen to depreciate against its main currency peers. This process has exacerbated more recently due to an increasing policy divergence between the Bank of Japan and other main central banks, which have opted to increase interest rates sharply to fight decades-high levels of inflation.
The BoJ’s stance of sticking to ultra-loose monetary policy has led to a widening policy divergence with other central banks, particularly with the US Federal Reserve. This supports a widening of the differential between the 10-year US and Japanese bonds, which favors the US Dollar against the Japanese Yen.
The Japanese Yen is often seen as a safe-haven investment. This means that in times of market stress, investors are more likely to put their money in the Japanese currency due to its supposed reliability and stability. Turbulent times are likely to strengthen the Yen’s value against other currencies seen as more risky to invest in.
- Gold prices trades in negative territory near $2,325 in Monday’s early Asian session.
- Inflation in the US eased to its lowest annual rate in more than three years.
- The Middle East geopolitical tensions and the political uncertainty of France’s parliamentary election drag the Greenback lower.
Gold prices (XAU/USD) edges lower to $2,325 on Monday during the early Asian trading hours. The precious metal loses ground amid a continuation of the Federal Reserve’s (Fed) cautious stance. Investors will keep an eye on the US June ISM Purchasing Managers Index (PMI), which is expected to improve to 49.0 in June from 48.7 in May.
The US Personal Consumption Expenditures (PCE) Price Index readings fell as expected but remain elevated, triggering the US Fed to maintain its cautious stance. Data released from the US Bureau of Economic Analysis on Friday showed that the headline US PCE rose 2.6% on a yearly basis in May, compared to 2.7% in April, in line with the market estimation. Meanwhile, the core PCE inflation increased 2.6% YoY in May from 2.8% in April, matching expectations.
The Federal Reserve Bank of San Francisco President Mary Daly said on Friday that monetary policy is working, but it’s too early to tell when it will be appropriate to cut the interest rate. Daly further stated, "If inflation stays sticky or comes down slowly, rates would need to be higher for longer.” It’s worth noting that a higher interest rate generally weighs on the Gold price as it increases the opportunity cost of holding non-yielding assets.
Additionally, the Federal Reserve Bank of New York President John Williams said that inflation is still at problematic levels and the US central bank will act to lower it. The Fed Governor Michelle Bowman noted that while current Fed policies should be enough to drag inflation back to target, adding that the central bank shouldn't be unwilling to weigh further rate cuts in inflation data proves sticky.
Nonetheless, the ongoing geopolitical tensions and the uncertainty after the first round of France’s parliamentary election might boost the safe-haven flows and drag the Greenback lower, per CNN.
| Index | Change, points | Closed | Change, % |
|---|---|---|---|
| NIKKEI 225 | 241.54 | 39583.08 | 0.61 |
| Hang Seng | 2.14 | 17718.61 | 0.01 |
| KOSPI | 13.76 | 2797.82 | 0.49 |
| ASX 200 | 7.9 | 7767.5 | 0.1 |
| DAX | 24.9 | 18235.45 | 0.14 |
| CAC 40 | -51.32 | 7479.4 | -0.68 |
| Dow Jones | -45.2 | 39118.86 | -0.12 |
| S&P 500 | -22.39 | 5460.48 | -0.41 |
| NASDAQ Composite | -126.08 | 17732.6 | -0.71 |
| Pare | Closed | Change, % |
|---|---|---|
| AUDUSD | 0.66693 | 0.35 |
| EURJPY | 172.348 | 0.19 |
| EURUSD | 1.0713 | 0.09 |
| GBPJPY | 203.409 | 0.14 |
| GBPUSD | 1.26433 | 0.04 |
| NZDUSD | 0.60903 | 0.15 |
| USDCAD | 1.36765 | -0.17 |
| USDCHF | 0.89865 | 0 |
| USDJPY | 160.882 | 0.1 |


© 2000-2026. All rights reserved.
This site is managed by Teletrade D.J. LLC 2351 LLC 2022 (Euro House, Richmond Hill Road, Kingstown, VC0100, St. Vincent and the Grenadines).
The information on this website is for informational purposes only and does not constitute any investment advice.
The company does not serve or provide services to customers who are residents of the US, Canada, Iran, The Democratic People's Republic of Korea, Yemen and FATF blacklisted countries.
Making transactions on financial markets with marginal financial instruments opens up wide possibilities and allows investors who are willing to take risks to earn high profits, carrying a potentially high risk of losses at the same time. Therefore you should responsibly approach the issue of choosing the appropriate investment strategy, taking the available resources into account, before starting trading.
Use of the information: full or partial use of materials from this website must always be referenced to TeleTrade as the source of information. Use of the materials on the Internet must be accompanied by a hyperlink to teletrade.org. Automatic import of materials and information from this website is prohibited.
Please contact our PR department if you have any questions or need assistance at pr@teletrade.global.
transfers