- Analytics
- News and Tools
- Market News
CFD Markets News and Forecasts — 01-04-2021
| Time | Country | Event | Period | Previous value | Forecast |
|---|---|---|---|---|---|
| 12:30 (GMT) | U.S. | Manufacturing Payrolls | March | 21 | 33 |
| 12:30 (GMT) | U.S. | Average workweek | March | 34.6 | 34.8 |
| 12:30 (GMT) | U.S. | Government Payrolls | March | -86 | |
| 12:30 (GMT) | U.S. | Average hourly earnings | March | 0.2% | 0.2% |
| 12:30 (GMT) | U.S. | Labor Force Participation Rate | March | 61.4% | |
| 12:30 (GMT) | U.S. | Private Nonfarm Payrolls | March | 465 | 550 |
| 12:30 (GMT) | U.S. | Unemployment Rate | March | 6.2% | 6.1% |
| 12:30 (GMT) | U.S. | Nonfarm Payrolls | March | 379 | 500 |
| 15:00 (GMT) | U.S. | FOMC Member Bostic Speaks |
Statistics
Canada announced on Thursday that the value of building permits issued by the
Canadian municipalities increased 2.1 percent m-o-m in February, following a
revised 6.9 percent m-o-m surge in January (originally a climb of 8.2 percent
m-o-m).
Economists had
forecast a 1.4 percent decrease in February from the previous month.
According to
the report, the value of residential permits fell 2.9 percent m-o-m in February,
as single-family permits decreased 1.0 percent m-o-m and permits for
multi-family dwellings plunged 4.9 percent m-o-m.
At the same
time, the value of non-residential building permits surged 14.2 percent m-o-m
in February, due to gains in institutional (+27.9 percent m-o-m), commercial (+11.4
percent m-o-m) and industrial (+1.9 percent m-o-m) permits.
In y-o-y terms,
building permits climbed 20.5 percent in February.
The Commerce
Department announced on Thursday that construction spending fell 0.8 percent
m-o-m in February after a revised 1.2 percent m-o-m gain in January (originally
a 1.7 percent m-o-m advance). This was the first monthly decrease in
construction spending since September 2020.
Economists had
forecast construction spending declining 1.0 percent m-o-m in February.
According to
the report, investment in public construction fell 1.7 percent m-o-m, while spending
on private construction dropped 0.5 percent m-o-m.
A report from
the Institute for Supply Management (ISM) showed on Thursday the U.S.
manufacturing sector’s activity expanded more than expected in March.
The ISM's index
of manufacturing activity came in at 64.7 percent last month, up 3.9 percentage
points from an unrevised February reading of 60.8 percent. The March reading pointed to the fastest
expansion in factory activity since December of 1983.
Economists' had
forecast the indicator to increase to 61.3 percent.
A reading above
50 percent indicates expansion, while a reading below 50 percent indicates
contraction.
According to
the report, the New Orders Index stood at 68.0 percent, up 3.2 percentage
points from the February reading, while the Production Index came in at 68.1 percent,
a climb of 4.9 percentage points compared to the February reading, the
Employment Index was at 59.6 percent, 5.2 percentage points higher from the February
reading, the Backlog of Orders Index registered 67.5 percent, 3.5 percentage
points above the February reading, the Supplier Deliveries Index recorded 76.6
percent, up 4.6 percentage points from the February figure, and the Inventories
Index registered 50.8 percent, 1.1 percentage points higher than the February
reading. On the price front, the Prices Index posted 85.6 percent, down 0.4
percentage point compared to the February reading.
Timothy R.
Fiore, Chair of the ISM Manufacturing Business Survey Committee, noted that the
manufacturing economy continued its recovery in March but Survey Committee members
reported that their companies and suppliers continue to struggle to meet
increasing rates of demand due to COVID-19 impacts limiting availability of
parts and materials. “Extended lead times, wide-scale shortages of critical
basic materials, rising commodities prices and difficulties in transporting
products are affecting all segments of the manufacturing economy,” he said. “Worker
absenteeism, short-term shutdowns due to part shortages, and difficulties in
filling open positions continue to be issues that limit manufacturing-growth
potential.” Fiore also said that the past relationship between the PMI and the
overall economy indicated that the PMI for March (64.7 percent) corresponds to
a 6.2-percent increase in real gross domestic product (GDP) on an annualized
basis.
The latest
report by IHS Markit revealed on Thursday the seasonally adjusted IHS Markit
final U.S. Manufacturing Purchasing Managers’ Index(PMI) came in at 59.1 in March,
up from 58.6 in February but broadly in line with the earlier released “flash”
estimate of 59.0. The March reading pointed to the
second-strongest improvement in the health of the U.S. manufacturing sector
since data collection began in May 2007.
Economists had
forecast the index to stay unrevised at 59.0.
According to the report, the headline figure was supported by the sharpest rise in new orders since June 2014, although production was reportedly held back by supply shortages. In addition, inflationary pressures intensified, with cost burdens rising at the fastest rate for a decade. Finally, output expectations strengthened, with the degree of confidence being the second-highest for over six years, as businesses were buoyed by hopes of a successful vaccine roll-out, fresh stimulus and a resulting boost to new sales.
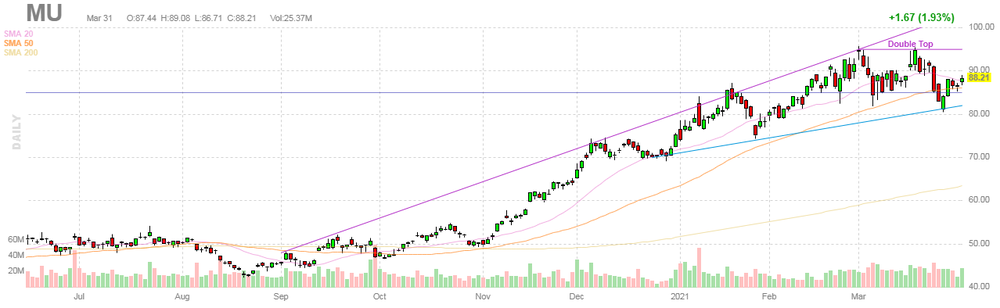
U.S. stock-index futures rose on Thursday, as a pullback in the U.S. Treasury yields and upbeat guidance by Micron (MU) provided support to the IT stocks, while Biden's massive infrastructure proposal added to the recovery narrative.
Global Stocks:
Index/commodity | Last | Today's Change, points | Today's Change, % |
Nikkei | 29,388.87 | +210.07 | +0.72% |
Hang Seng | 28,938.74 | +560.39 | +1.97% |
Shanghai | 3,466.33 | +24.42 | +0.71% |
S&P/ASX | 6,828.70 | +38.00 | +0.56% |
FTSE | 6,746.77 | +33.14 | +0.49% |
CAC | 6,096.45 | +29.22 | +0.48% |
DAX | 15,092.03 | +83.69 | +0.56% |
Crude oil | $60.30 | +1.93% | |
Gold | $1,719.40 | +0.22% |
(company / ticker / price / change ($/%) / volume)
3M Co | MMM | 193.05 | 0.37(0.19%) | 7483 |
ALCOA INC. | AA | 32.56 | 0.07(0.22%) | 26152 |
ALTRIA GROUP INC. | MO | 50.98 | -0.18(-0.35%) | 15682 |
Amazon.com Inc., NASDAQ | AMZN | 3,118.00 | 23.92(0.77%) | 27559 |
American Express Co | AXP | 141.18 | -0.26(-0.18%) | 2334 |
AMERICAN INTERNATIONAL GROUP | AIG | 46.18 | -0.03(-0.06%) | 1050 |
Apple Inc. | AAPL | 123.52 | 1.37(1.12%) | 930700 |
AT&T Inc | T | 30.36 | 0.09(0.30%) | 117287 |
Boeing Co | BA | 255.75 | 1.03(0.40%) | 71611 |
Caterpillar Inc | CAT | 231.47 | -0.40(-0.17%) | 15599 |
Chevron Corp | CVX | 105.18 | 0.39(0.37%) | 10738 |
Cisco Systems Inc | CSCO | 51.86 | 0.15(0.29%) | 42974 |
Citigroup Inc., NYSE | C | 72.52 | -0.23(-0.32%) | 43953 |
Exxon Mobil Corp | XOM | 56.15 | 0.32(0.57%) | 119046 |
Facebook, Inc. | FB | 298 | 3.47(1.18%) | 145137 |
FedEx Corporation, NYSE | FDX | 285.34 | 1.30(0.46%) | 1701 |
Ford Motor Co. | F | 12.3 | 0.05(0.41%) | 265388 |
Freeport-McMoRan Copper & Gold Inc., NYSE | FCX | 33 | 0.07(0.21%) | 114586 |
General Electric Co | GE | 13.21 | 0.08(0.61%) | 268861 |
General Motors Company, NYSE | GM | 57.73 | 0.27(0.47%) | 72977 |
Goldman Sachs | GS | 324.49 | -2.51(-0.77%) | 22915 |
Google Inc. | GOOG | 2,094.00 | 25.37(1.23%) | 6198 |
Hewlett-Packard Co. | HPQ | 31.98 | 0.23(0.72%) | 536 |
Home Depot Inc | HD | 306.3 | 1.05(0.34%) | 4663 |
Intel Corp | INTC | 64.65 | 0.65(1.02%) | 81900 |
International Business Machines Co... | IBM | 133.45 | 0.19(0.14%) | 19649 |
Johnson & Johnson | JNJ | 162.82 | -1.53(-0.93%) | 20625 |
JPMorgan Chase and Co | JPM | 151.9 | -0.33(-0.22%) | 56492 |
Microsoft Corp | MSFT | 238.4 | 2.63(1.12%) | 235543 |
Nike | NKE | 133.5 | 0.61(0.46%) | 16445 |
Pfizer Inc | PFE | 36.38 | 0.15(0.41%) | 76524 |
Procter & Gamble Co | PG | 135.55 | 0.12(0.09%) | 6830 |
Starbucks Corporation, NASDAQ | SBUX | 109.6 | 0.33(0.30%) | 8652 |
Tesla Motors, Inc., NASDAQ | TSLA | 687.55 | 19.62(2.94%) | 711584 |
The Coca-Cola Co | KO | 52.83 | 0.12(0.23%) | 37001 |
Twitter, Inc., NYSE | TWTR | 64.86 | 1.23(1.93%) | 73156 |
UnitedHealth Group Inc | UNH | 373.5 | 1.43(0.38%) | 7982 |
Verizon Communications Inc | VZ | 58.24 | 0.09(0.15%) | 46654 |
Visa | V | 212.98 | 1.25(0.59%) | 22991 |
Wal-Mart Stores Inc | WMT | 136.1 | 0.27(0.20%) | 16571 |
Walt Disney Co | DIS | 185 | 0.48(0.26%) | 85598 |
Yandex N.V., NASDAQ | YNDX | 64.32 | 0.26(0.41%) | 3004 |
FXStreet reports that Credit Suisse notes that S&P 500 has ended the quarter strongly and at record highs with the spotlight on its two-month channel top at 3994. Support at 3949/43 holding can keep the immediate bias higher for a clear break above here and then the psychological 4000 barrier for a move to the 4070/75 region.
“Whilst above support from the rising 13-day exponential average and price support at 3949/43 the immediate risk is seen staying higher for a clear break above 3994/4000 to mark an acceleration in the uptrend. We would then see Fibonacci projection resistance at 4008 next, ahead of the top of the weekly Bollinger Band at 4025/27 and eventually our 4070/75 next core objective.”
“Near-term support moves to 3959. Below 3943 can mark a minor top to raise the prospect of lengthier sideways ranging and a fall back to the price gap from last Friday morning at 3918/10, with fresh buyers expected here.”
Alphabet (GOOG) initiated with an Outperform at Wolfe Research; target $2450
Amazon (AMZN) initiated with an Outperform at Wolfe Research; target $3720
Facebook (FB) initiated with an Outperform at Wolfe Research
Twitter (TWTR) initiated with a Peer Perform at Wolfe Research; target $65
Lyft (LYFT) initiated with a Peer Perform at Wolfe Research; target $54
Uber (UBER) initiated with an Outperform at Wolfe Research; target $73
Uber (UBER) initiated with a Buy at Jefferies; target $75
Netflix (NFLX) initiated with an Overweight at Piper Sandler; target $605
Goldman Sachs (GS) downgraded to Neutral from Buy at UBS; target raised to $340
Micron Technology (MU) reported Q2 FY 2021 earnings of $0.98 per share (versus $0.45 per share in Q2 FY 2020), beating analysts’ consensus estimate of $0.95 per share.
The company’s quarterly revenues amounted to $6.2 bln (+30.0% y/y), in line with analysts’ consensus estimate of $6.2 bln.
The company also issued upside guidance for Q3 FY 2021, projecting EPS of $1.55-$1.69 versus analysts’ consensus estimate of $1.33 and revenues of $6.9-$7.3 bln versus analysts’ consensus estimate of $6.86 bln.
MU rose to $92.75 (+5.15%) in pre-market trading.
The data from
the Labor Department revealed on Thursday the number of applications for
unemployment was higher than expected last week.
According to the report, the initial claims for unemployment benefits increased by 61,000 to 719,000 for the week ended March 27.
Economists had expected 680,000 new claims last week.
Claims for the
prior week were revised downwardly to 658,000 from the initial estimate of 684,000.
Meanwhile, the
four-week moving average of jobless claims declined to 719,000 from a downwardly
revised 729,500 in the previous week.
Continuing
claims dropped to 3,794,000 from a downwardly revised 3,840,000 in the previous
week.
| Time | Country | Event | Period | Previous value | Forecast | Actual |
|---|---|---|---|---|---|---|
| 06:00 | Germany | Retail sales, real unadjusted, y/y | February | -9.3% | -6.3% | -9% |
| 06:00 | Germany | Retail sales, real adjusted | February | -6.5% | 2% | 1.2% |
| 06:30 | Switzerland | Retail Sales (MoM) | February | -5.3% | -5.2% | |
| 06:30 | Switzerland | Retail Sales Y/Y | February | -0.5% | -6.3% | |
| 06:30 | Switzerland | Consumer Price Index (MoM) | March | 0.2% | 0.4% | 0.3% |
| 06:30 | Switzerland | Consumer Price Index (YoY) | March | -0.5% | -0.3% | -0.2% |
| 07:30 | Switzerland | Manufacturing PMI | March | 61.3 | 64.5 | 66.3 |
| 07:50 | France | Manufacturing PMI | March | 56.1 | 58.8 | 59.3 |
| 07:55 | Germany | Manufacturing PMI | March | 60.7 | 66.6 | 66.6 |
| 08:00 | Eurozone | Manufacturing PMI | March | 57.9 | 62.4 | 62.5 |
| 08:30 | United Kingdom | Purchasing Manager Index Manufacturing | March | 55.1 | 57.9 | 58.9 |
| 12:00 | OPEC | OPEC Meetings |
EUR strengthened against its major counterparts in the European session on Thursday as the announcement of a massive infrastructure spending plan in the U.S. and the Eurozone's March factory PMI data, which were the strongest on record, bolstered markets’ sentiment.
On Wednesday, U.S. President Joe Biden announced a $2.25 trillion infrastructure spending plan, which includes proposals of a doubling of federal funding for public transportation, $650 billion for clean water and high-speed broadband and more than $500 billion in spending on manufacturing. Biden's infrastructure proposal underscored the recovery narrative, prevailing in markets.
The latest report from IHS Markit revealed on Thursday that the Eurozone's manufacturing sector expanded at a survey record rate in March. According to the report, the final Eurozone manufacturing PMI came in at 62.5 in March, up from February’s 57.9 and the flash reading of 62.4. The March PMI reading indicated that operating conditions in Eurozone’s manufacturing economy improved to the greatest degree in nearly 24 years of survey history. Output and new orders rose at record rates. New export orders also increased for the ninth consecutive month and at a series record pace. In addition, purchasing activity posted the quickest expansion ever and the pace of job creation was the strongest since August 2018.
However, the announcement of a new - third - national lockdown in France reminded investors that the EU struggles in both curbing the spread of the COVID-19 and extending its vaccine rollout. This limits the further growth of the euro.
FXStreet reports that in the view of economists at Deutsche Bank, cash will not likely disappear soon. In fact, the amount of cash in circulation has been surging and, more recently, the COVID-19 pandemic has caused the demand for cash to skyrocket.
“Last week, the European Central Bank (ECB) reported that the circulation of euro banknotes surged 12% over the past year. That was the highest growth rate in a decade and more than double the growth rate of 2019.”
“Among consumers, cash remains king. People regard cash as a ‘store of value’ and a ‘safe-haven.’ According to our proprietary survey of 3,600 individuals across the UK, US, China, Germany, France and Italy, one-third of Americans and Europeans rank cash as their favourite payment method.”
“Moving cash from under the mattress into a bank account is unlikely to happen (at scale) in the near-term. In normal times (i.e., when there is no pandemic), consumers have little incentive to deposit or save money in a context of low or negative interest rates... Looking ahead, in a context of low inflation rates, most central bank interest rates in advanced economies are expected to remain unchanged until at least 2022.”
“Low-interest rates are a barrier that hinders populations in advanced economies from adopting central bank digital currencies (CBDCs). This barrier is less of a concern in most emerging economies (especially China) because they have higher interest rates.”
FXStreet notes that the recent drop in the price of gold below $1,700/oz has illustrated its greater sensitivity to US long than short-dated real yields. Although the yellow metal has nudged back up above this level, strategists at Capital Economics expect XAU/USD to fall back to an even lower level as the U.S. real yield curve steepens more.
“In the past, short and long-dated real Treasury yields have often moved in the same direction, with the result that both variables have had a close inverse relationship with the price of gold. Since the good news on vaccines against COVID-19 began to emerge in November, however, short and long-dated real Treasury yields have moved in opposite directions.”
“The pivoting of the real yield curve has been accompanied by a slump in gold. We think this is logical."
“Our expectation is that the real Treasury curve will continue to steepen. Indeed, we suspect most of the ~50bp increase we project in the nominal yield of 10-year conventional Treasuries between now and the end of this year will result from a higher real yield. We expect this to heap more pressure on the price of gold, which we doubt will get any offsetting boost from a flight-to-safety given our view that the US stock market will stay strong this year.”
“Our end-2021 forecast for the price of the yellow metal is $1,600/oz.”
FXStreet reports that economists at Westpac notes that the clean break of the 0.7560 area suddenly makes a correction as far as the 200-day moving average at 0.7389 plausible. Broad USD mood is set to be key though, with H2 21 global growth prospects still robust, underpinning commodities.
“The big dollar is arguably the key factor at the moment, as the fiscal ‘rescue’ package stokes bank accounts, spending and confidence, only for President Biden to propose another huge spending boost, albeit more long term.”
“If CNH is at a low vs USD since November then no surprise AUD/USD is also breaking ranges to the downside despite domestic positives such as hefty trade surpluses.”
“Momentum should remain with USD for now, opening up 0.7450/70 or below (even near 200-DMA at 0.7389) but longer-term, A$ cyclical upswing looks intact.”
FXStreet reports that the NZD/USD pair maintains a “head and shoulders” top and analysts at Credit Suisse stay bearish for a test of the 200-day average at 0.6883.
“Although we do not exclude further short-term sideways trading, with a large ‘head and shoulders’ top in place as well as daily momentum still pointing lower, we look for a resumption of the downmove in due course.”
“Below 0.6943 should open the door to a fall back to the 200-day average, currently at 0.6883, where we would expect to see a more concerted pause.”
“Resistance moves to 0.6988 initially, then 0.7025/34, which ideally caps to keep the immediate downside bias intact."
- Eurozone 2021 growth forecasts might be missed if virus restrictions are extended
- U.S. stimulus cannot be a model for Europe
Reuters reports that Chinese central bank official said that stimulus measures implemented by the Federal Reserve’s over the past year and future policy changes that the U.S. central bank has signalled will have limited impact on China’s financial markets.
“The positive effect of China’s normal monetary policy stance is emerging,” said Sun Guofeng, head of the People’s Bank of China’s (PBOC) monetary policy department.
“The next step is to manage our own affairs well, and we must keep our monetary policy steady.
“We’re happy to see efforts by other economies to return to normal monetary policy which will be beneficial for the long-term healthy development of the global economy.”
Sun added that PBOC will keep the yuan’s exchange rate basically stable at a reasonable level, and step up prudent management of cross-border capital flows and guide expectations.
FXStreet reports that economists at Westpac see further tests and a possible GBP/USD break of 1.35 before strength returns later in the second quarter.
“The combination of a burst of warm weather, the first stages of reopening in England, the Easter holidays and the prospects of more easing of restrictions in non-essential retail in coming weeks should help lift sentiment towards the pound through Q2. And this should remain in stark contrast to the developing lockdown situation in France and across Europe.”
“This more positive domestic backdrop should leave the GBP well supported on dips towards 1.35, and continued outperformance versus EUR appears locked and loaded. The strength of DXY points to risks; we see further tests and a possible break of 1.35 before strength returns later in Q2.”
Reuters reports that France’s CCFA association of carmakers said that new car registrations in France jumped 192% year on year in March, having been hit heavily by the country’s first two-month COVID-19 lockdown in the corresponding month last year.
According to the report, registrations of passenger vehicles were 182,775 last month. That figure remains lower than the average 210,000 total usually registered for March.
Over the first quarter the French car market is up 21.1% year on year after the first two months of the year had been down 14.2%.
FXStreet reports that economists at Westpac discusses US Dollar Index prospects.
“Stretch targets of 94.50, the top-end of the DXY’s 2020Q3 range look increasingly achievable in coming weeks as the US and Europe slip into dramatically diverging recovery paths.”
“US rebound hopes have risen sharply but adaptive expectations have a habit of falling short when growth momentum shifts as rapidly as it has in the US. The medium-term USD bear trend has been adjourned, until sometime in 2021H2. EC President von der Leyen says European vaccine deliveries will hit 100M doses per month by April, so Europe should have her vaccination act together by Q3. By then, second derivative US rebound measures will probably be cresting too.”
According to the report from IHS Markit/CIPS, the upturn in the UK manufacturing sector gained further momentum at the end of the third quarter. March saw the fastest output growth since late-2020, as inflows of new business from both domestic and overseas markets strengthened. The sector remained beset by severe supply chain and logistic issues, however, leading to delivery delays from suppliers and disruption to production and distribution schedules.
The seasonally adjusted PMI rose to a decade-high of 58.9 in March, its best outcome since February 2011. The PMI level was supported by improved growth of output, new orders and employment along with increased supplier lead times.
A slower decrease in stocks of purchases also had a positive impact on the latest reading compared to one month ago. Manufacturing output increased for the tenth successive month and at the quickest pace since last November. Solid and accelerated growth was signalled in both the intermediate and investment goods industries. Consumer goods production returned to expansion following back to back contractions.
Higher output was linked to improved new order intakes, the vaccine roll-out and preparations for the planned loosening of lockdown restrictions. New business rose at the second fastest pace for over three years, with growth registered at consumer, intermediate and investment goods producers alike.
The ongoing rebound in domestic and global economic conditions underpinned increased optimism and job creation at UK factories. Business sentiment was at its most elevated for seven years, hitting unsurpassed levels at both consumer and investment goods producers. Almost two-thirds of manufacturers expect output to rise over the coming year (only 6% expect a contraction).
According to the report from IHS Markit, the eurozone’s manufacturing economy performed extremely strongly during March, with operating conditions improving to the greatest degree in nearly 24 years of data collection.
After accounting for seasonal factors, the headline PMI surged to 62.5, up from February’s 57.9 and indicative of a considerable strengthening of sector performance. The index has now registered above the 50.0 nochange mark that separates growth from contraction for nine months in succession.
Once again, all three broad market groups recorded a month-on month strengthening of operating conditions. Growth rates were also higher in all instances, although gains were especially strong amongst investment and intermediate goods producers with series record highs seen in each case during March.
Underpinning the headline Eurozone PMI were record rises in both output and new orders in March. A general strengthening in demand, on the back of increasing confidence about future economic conditions, helped to drive the record increases in production and output. Latest data showed that new export orders* rose for a ninth successive month and at a series record pace.
The further strengthening of trade, orders and production placed further strain on already stretched supply chains. According to the latest data, average lead times for the delivery of inputs lengthened at an unprecedented rate as challenges in sourcing inputs due to product shortages, stronger global demand and ongoing logistical challenges linked to COVID-19 continued in March. This all served to add to inflationary pressures. Input costs were reported to have risen in March to the greatest degree for a decade.
Finally, confidence about output over the next 12 months held broadly steady on February’s record high. Of the nations covered by the survey, optimism was highest in the Netherlands and Ireland.
| Time | Country | Event | Period | Previous value | Forecast | Actual |
|---|---|---|---|---|---|---|
| 00:30 | Australia | Home Loans | February | 10.9% | -1.8% | |
| 00:30 | Australia | Retail Sales, M/M | February | 0.3% | -1.1% | -0.8% |
| 00:30 | Australia | Trade Balance | February | 9.616 | 9.7 | 7.529 |
| 00:30 | Japan | Manufacturing PMI | March | 51.4 | 52 | 52.7 |
| 01:45 | China | Markit/Caixin Manufacturing PMI | March | 50.9 | 51.3 | 50.6 |
| 06:00 | Germany | Retail sales, real unadjusted, y/y | February | -9.3% | -6.3% | -9% |
| 06:00 | Germany | Retail sales, real adjusted | February | -6.5% | 2% | 1.2% |
| 06:30 | Switzerland | Retail Sales (MoM) | February | -5.3% | -5.2% | |
| 06:30 | Switzerland | Retail Sales Y/Y | February | -0.5% | -6.3% | |
| 06:30 | Switzerland | Consumer Price Index (MoM) | March | 0.2% | 0.4% | 0.3% |
| 06:30 | Switzerland | Consumer Price Index (YoY) | March | -0.5% | -0.3% | -0.2% |
During today's Asian trading, the U.S. dollar consolidated near a multi-month high against other major currencies as investors bet on fiscal stimulus and aggressive vaccination that will help the United States grow faster than other economies.
The ICE index, which tracks the dollar's performance against six currencies (euro, Swiss franc, yen, Canadian dollar, pound sterling and Swedish krona), rose 0.04%, to 93.26, close to a five-month high of 93.439 reached on Wednesday.
The rise came as the euro, the largest component of the index, suffers from concerns that the euro zone's economic recovery is being hampered by a third wave of COVID-19 contagion.
President Emmanuel Macron ordered France to impose a third national blockade and said schools would close for three weeks, while the currency bloc also lags behind the United States in vaccination programs.
"The dollar's growth is likely to slow down, but the dollar's propensity to strengthen is still there," said Masaru Ishibashi, joint general manager of trading at Sumitomo Mitsui Bank.
The dollar rose 0.05% against the yen, reaching its highest level in a year. "Yen-selling due to Japanese companies' foreign direct investment is coming back after a slowdown due to the pandemic last year," said Yujiro Goto, chief FX strategist at Nomura Securities.
U.S. President Joe Biden announced his long awaited $2 trillion-plus job plan, including $621 billion to rebuild infrastructure. But the effort sets the stage for the next partisan clash in the Congress where members are divided on the total size and inclusion of programmes traditionally seen as social services.
FXStreet reports that Bart Melek, Head of Commodity Strategy at TD Securities, discusses WTI oil prospects.
“The expectations that OPEC+ commitment to keeping the supply cut regime in place into May likely means that demand will outpace inventories by another 500k b/d over the next three months. This means that there will be little reason to sell in response to the European woes.”
“Considering the OPEC+ commitment to keeping markets tight suggests that there may well be room for WTI crude to test recent highs near $65/b, as we move into Q3, when demand is likely to jump by over 3 million b/d.”
According to the report from the Federal Statistical Office (FSO), the consumer price index (CPI) increased by 0.3% in March 2021 compared with the previous month, reaching 100.6 points (December 2020 = 100). Inflation was –0.2% compared with the same month of the previous year.
The 0.3% increase compared with the previous month can be explained by several factors including rising prices for clothing and footwear due to the end of the seasonal sales. Heating oil also recorded a price increase, as did fuel. In contrast, prices for fruiting vegetables and pasta decreased.
In March 2021, the Swiss Harmonised Index of Consumer Prices (HICP) stood at 100.53 points (base 2015 = 100). This corresponds to a rate of change of +0.2% compared with the previous month and of –0.2% compared with the same month the previous year. Due to the effects of the pandemic, the same missing price imputation techniques used for the CPI were introduced for the HICP. The HICP is a supplementary indicator for inflation based on a harmonised method across EU member countries. It enables inflation in Switzerland to be compared with that of European countries.
EUR/USD
Resistance levels (open interest**, contracts)
$1.1859 (246)
$1.1818 (347)
$1.1786 (236)
Price at time of writing this review: $1.1714
Support levels (open interest**, contracts):
$1.1677 (2033)
$1.1639 (3194)
$1.1595 (1161)
Comments:
- Overall open interest on the CALL options and PUT options with the expiration date April, 9 is 65693 contracts (according to data from March, 31) with the maximum number of contracts with strike price $1,1750 (4851);
GBP/USD
$1.3917 (830)
$1.3880 (126)
$1.3809 (553)
Price at time of writing this review: $1.3754
Support levels (open interest**, contracts):
$1.3705 (1240)
$1.3672 (1092)
$1.3648 (431)
Comments:
- Overall open interest on the CALL options with the expiration date April, 9 is 9728 contracts, with the maximum number of contracts with strike price $1,4100 (1179);
- Overall open interest on the PUT options with the expiration date April, 9 is 16064 contracts, with the maximum number of contracts with strike price $1,3750 (1240);
- The ratio of PUT/CALL was 1.65 versus 1.60 from the previous trading day according to data from March, 31
* - The Chicago Mercantile Exchange bulletin (CME) is used for the calculation.
** - Open interest takes into account the total number of option contracts that are open at the moment.
According to provisional data of the Federal Statistical Office (Destatis), turnover in retail trade in February 2021 was in real terms 1.2% and in nominal terms 1.3% higher than in January 2021 (both adjusted for calendar and seasonal influences). These results can be explained by the second COVID-19 lockdown, which led to a partial retail closure starting on 16 December 2020. Economists had expected a 2.0% increase in real terms
In February 2021, the turnover in retail declined by 9.0% in real terms and by 7.7% in nominal terms compared to the same month of the previous year. In comparison to February 2020, the month before the outbreak of Covid 19 in Germany, the turnover in February 2021 was 5.4% in real terms, calendar and seasonally adjusted lower. The number of days open for sale was 24 in February 2021, whereas 25 days were open for sale in February 2020.
CNBC reports that President Joe Biden unveiled a more than $2 trillion infrastructure package as his administration shifts its focus to bolstering the post-pandemic economy.
The plan Biden outlined Wednesday includes roughly $2 trillion in spending over eight years and would raise the corporate tax rate to 28% to fund it.
The White House said the tax hike, combined with measures designed to stop offshoring of profits, would fund the infrastructure plan within 15 years.
The proposal would:
Put $621 billion into transportation infrastructure such as bridges, roads, public transit, ports, airports and electric vehicle development
Direct $400 billion to care for elderly and disabled Americans
Inject more than $300 billion into improving drinking-water infrastructure, expanding broadband access and upgrading electric grids
Put more than $300 billion into building and retrofitting affordable housing, along with constructing and upgrading schools
Invest $580 billion in American manufacturing, research and development and job training efforts
The announcement kicks off Biden’s second major initiative after passage of a $1.9 trillion coronavirus relief plan earlier this month. In the new move, the administration aims to approve a first proposal designed to create jobs, revamp U.S. infrastructure and fight climate change before it turns toward a second plan to improve education and expand paid leave and health-care coverage.
| Raw materials | Closed | Change, % |
|---|---|---|
| Brent | 62.99 | -2.02 |
| Silver | 24.378 | 1.58 |
| Gold | 1707.557 | 1.35 |
| Palladium | 2611.22 | 1.53 |
| Time | Country | Event | Period | Previous value | Forecast |
|---|---|---|---|---|---|
| 00:30 (GMT) | Australia | Home Loans | February | 10.9% | |
| 00:30 (GMT) | Australia | Retail Sales, M/M | February | 0.3% | -1.1% |
| 00:30 (GMT) | Australia | Trade Balance | February | 10.142 | |
| 00:30 (GMT) | Japan | Manufacturing PMI | March | 51.4 | |
| 01:45 (GMT) | China | Markit/Caixin Manufacturing PMI | March | 50.9 | |
| 06:00 (GMT) | Germany | Retail sales, real unadjusted, y/y | February | -8.7% | |
| 06:00 (GMT) | Germany | Retail sales, real adjusted | February | -4.5% | |
| 06:30 (GMT) | Switzerland | Retail Sales (MoM) | February | -5.3% | |
| 06:30 (GMT) | Switzerland | Retail Sales Y/Y | February | -0.5% | |
| 06:30 (GMT) | Switzerland | Consumer Price Index (MoM) | March | 0.2% | |
| 06:30 (GMT) | Switzerland | Consumer Price Index (YoY) | March | -0.5% | |
| 07:30 (GMT) | Switzerland | Manufacturing PMI | March | 61.3 | |
| 07:50 (GMT) | France | Manufacturing PMI | March | 56.1 | 58.8 |
| 07:55 (GMT) | Germany | Manufacturing PMI | March | 60.7 | 66.6 |
| 08:00 (GMT) | Eurozone | Manufacturing PMI | March | 57.9 | 62.4 |
| 08:30 (GMT) | United Kingdom | Purchasing Manager Index Manufacturing | March | 55.1 | 57.9 |
| 12:00 (GMT) | OPEC | OPEC Meetings | |||
| 12:30 (GMT) | U.S. | Continuing Jobless Claims | March | ||
| 12:30 (GMT) | Canada | Building Permits (MoM) | February | 8.2% | |
| 12:30 (GMT) | U.S. | Initial Jobless Claims | March | ||
| 13:45 (GMT) | U.S. | Manufacturing PMI | March | 58.6 | |
| 14:00 (GMT) | U.S. | Construction Spending, m/m | February | 1.7% | -1% |
| 14:00 (GMT) | U.S. | ISM Manufacturing | March | 60.8 | 61 |
| 17:00 (GMT) | U.S. | Baker Hughes Oil Rig Count | April | 324 | |
| 17:00 (GMT) | U.S. | FOMC Member Harker Speaks | |||
| 22:05 (GMT) | U.S. | FOMC Member Kaplan Speak |
| Pare | Closed | Change, % |
|---|---|---|
| AUDUSD | 0.75935 | -0.01 |
| EURJPY | 129.814 | 0.4 |
| EURUSD | 1.17263 | 0.09 |
| GBPJPY | 152.562 | 0.67 |
| GBPUSD | 1.37787 | 0.32 |
| NZDUSD | 0.698 | 0 |
| USDCAD | 1.25603 | -0.5 |
| USDCHF | 0.94349 | 0.16 |
| USDJPY | 110.711 | 0.33 |


© 2000-2026. All rights reserved.
This site is managed by Teletrade D.J. LLC 2351 LLC 2022 (Euro House, Richmond Hill Road, Kingstown, VC0100, St. Vincent and the Grenadines).
The information on this website is for informational purposes only and does not constitute any investment advice.
The company does not serve or provide services to customers who are residents of the US, Canada, Iran, The Democratic People's Republic of Korea, Yemen and FATF blacklisted countries.
Making transactions on financial markets with marginal financial instruments opens up wide possibilities and allows investors who are willing to take risks to earn high profits, carrying a potentially high risk of losses at the same time. Therefore you should responsibly approach the issue of choosing the appropriate investment strategy, taking the available resources into account, before starting trading.
Use of the information: full or partial use of materials from this website must always be referenced to TeleTrade as the source of information. Use of the materials on the Internet must be accompanied by a hyperlink to teletrade.org. Automatic import of materials and information from this website is prohibited.
Please contact our PR department if you have any questions or need assistance at pr@teletrade.global.
transfers