- Analytics
- News and Tools
- Market News
- Australian Dollar holds gains following China’s economic figures
Australian Dollar holds gains following China’s economic figures
- The Australian Dollar remains steady following the release of key economic data from China on Monday.
- China's Retail Sales rose 4% YoY in January-February, up from December’s 3.7% increase.
- Market expectations suggest that the Fed will keep its current policy stance unchanged on Wednesday.
The Australian Dollar (AUD) remains steady against the US Dollar (USD) following the release of China’s economic data on Monday. Additionally, the AUD/USD pair gained ground as the US Dollar (USD) edges lower ahead of Retail Sales data release later in the North American session.
China's retail sales grew by 4% year-over-year in January-February, improving from December’s 3.7% increase. Meanwhile, industrial production rose 5.9% YoY during the same period, exceeding the 5.3% forecast but slightly lower than the previous reading of 6.2%.
The AUD could gain ground as China unveiled a special action plan over the weekend to revive consumption, lifting market sentiment across the region. The plan includes measures to increase wages, boost household spending, and stabilize stock and real estate markets. Any positive developments surrounding the Chinese stimulus plan could boost the Australian Dollar, as China is a major trading partner to Australia.
The AUD/USD pair may receive support from improving risk sentiment amid reports of a potential ceasefire discussion between US President Donald Trump and Russian President Vladimir Putin this week. Trump’s envoy, Steve Witkoff, stated on Sunday that he expects the two leaders to speak, adding that Putin “accepts the philosophy” of Trump’s ceasefire and peace terms, according to The Guardian.
Australian Dollar gains ground amid improved risk sentiment
- The US Dollar Index (DXY), which measures the USD against six major currencies, edges lower and is trading around 103.70 at the time of writing. However, the Greenback faced headwinds after the University of Michigan (UoM) reported a decline in its preliminary Consumer Sentiment Index for March on Friday, falling to 57.9—the lowest since November 2022—from the previous reading of 64.7. This figure also came in below the consensus estimate of 63.1. Meanwhile, the UoM five-year Consumer Inflation Expectation jumped to 3.9% in March, compared to 3.5% in February.
- Markets widely anticipate that the Federal Reserve (Fed) will maintain its current policy stance when it concludes its two-day meeting on Wednesday. According to the CME FedWatch tool, traders have priced in nearly a 75% probability of a quarter-point rate cut by June.
- On Sunday, the Houthis declared that they had launched an assault involving 18 ballistic and cruise missiles, along with drones, aimed at the USS Harry S. Truman aircraft carrier and its escorting warships in the northern Red Sea. Meanwhile, the US defense secretary stated that the United States would continue striking Yemen's Houthis until they cease attacks on shipping, as the Iran-aligned group vowed to escalate in retaliation for deadly US strikes the previous day.
- US Treasury Secretary Scott Bessent said late Sunday that he was not concerned about the stock market despite multiple declines triggered by Trump's tariff threats. "I've been in the investment business for 35 years, and I can tell you that corrections are healthy. They're normal. What's not healthy is a market that only moves straight up," Bessent stated.
- US President Donald Trump’s decision to uphold a 25% tariff on Australian aluminum and steel exports, valued at nearly $1 billion. This move adds strain to Australia’s trade outlook, impacting major exports.
- Australian Prime Minister Anthony Albanese confirmed that Australia will not impose reciprocal tariffs on the US, emphasizing that retaliatory measures would only raise costs for Australian consumers and fuel inflation.
Technical Analysis: Australian Dollar maintains position above 0.6300, nine-day EMA
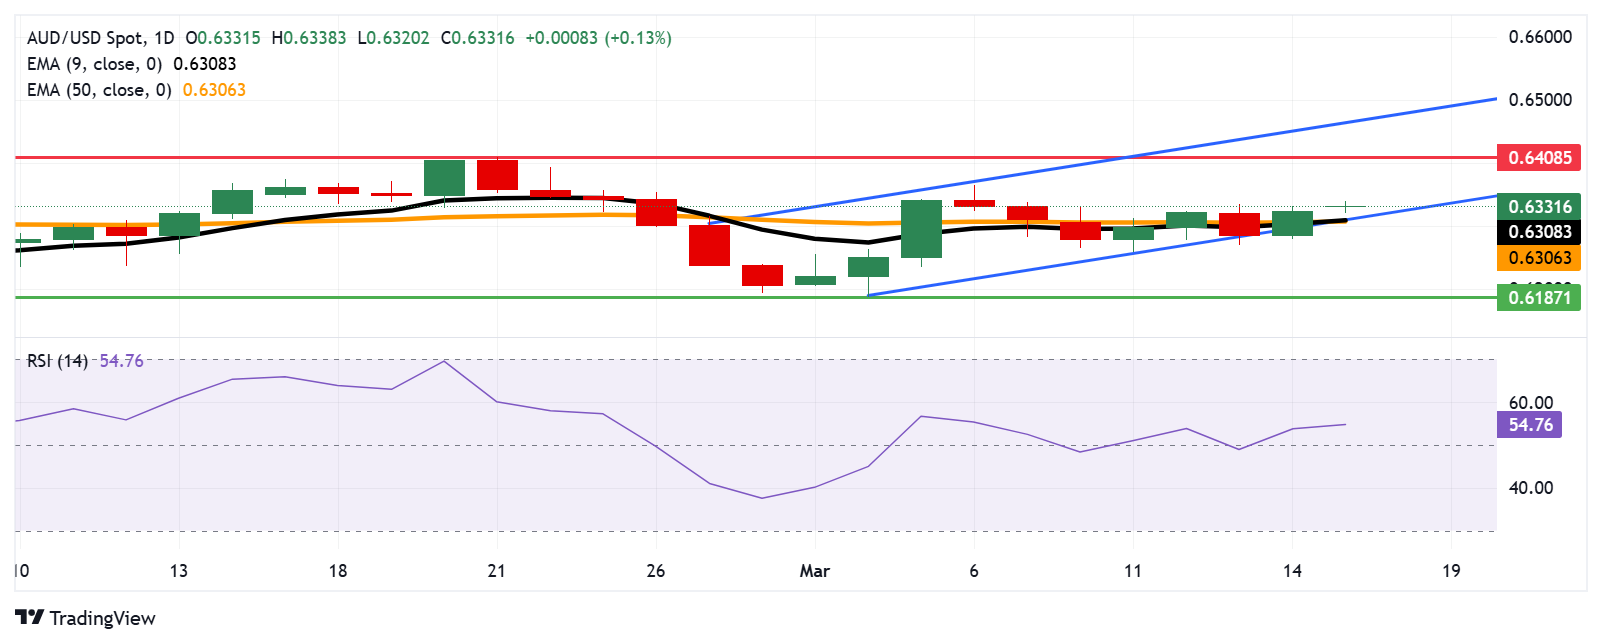
The AUD/USD pair is hovering around 0.6340 on Monday, maintaining a bullish outlook after reclaiming its position within the ascending channel on the daily chart. The 14-day Relative Strength Index (RSI) has also rebounded above 50, further supporting the positive momentum.
Immediate support is seen at the nine-day Exponential Moving Average (EMA) of 0.6309, followed by the 50-day EMA at 0.6306 and the lower boundary of the ascending channel. A decisive break below this critical support zone could weaken the bullish bias, exposing the AUD/USD pair to downward pressure toward the six-week low of 0.6187, recorded on March 5.
On the upside, the AUD/USD pair may attempt to retest the three-month high of 0.6408, last seen on February 21. A breakout above this level would reinforce the bullish bias, potentially driving the pair toward the ascending channel’s upper boundary near 0.6470.
AUD/USD: Daily Chart
Australian Dollar PRICE Today
The table below shows the percentage change of Australian Dollar (AUD) against listed major currencies today. Australian Dollar was the strongest against the Canadian Dollar.
| USD | EUR | GBP | JPY | CAD | AUD | NZD | CHF | |
|---|---|---|---|---|---|---|---|---|
| USD | -0.02% | 0.02% | -0.07% | -0.04% | 0.00% | -0.22% | -0.07% | |
| EUR | 0.02% | -0.08% | -0.47% | -0.01% | -0.11% | -0.21% | -0.07% | |
| GBP | -0.02% | 0.08% | -0.06% | -0.15% | -0.05% | -0.14% | -0.07% | |
| JPY | 0.07% | 0.47% | 0.06% | 0.04% | -0.13% | -0.09% | -0.12% | |
| CAD | 0.04% | 0.01% | 0.15% | -0.04% | -0.16% | -0.18% | -0.58% | |
| AUD | -0.00% | 0.11% | 0.05% | 0.13% | 0.16% | -0.07% | 0.06% | |
| NZD | 0.22% | 0.21% | 0.14% | 0.09% | 0.18% | 0.07% | 0.13% | |
| CHF | 0.07% | 0.07% | 0.07% | 0.12% | 0.58% | -0.06% | -0.13% |
The heat map shows percentage changes of major currencies against each other. The base currency is picked from the left column, while the quote currency is picked from the top row. For example, if you pick the Australian Dollar from the left column and move along the horizontal line to the US Dollar, the percentage change displayed in the box will represent AUD (base)/USD (quote).
Economic Indicator
Retail Sales (YoY)
The Retail Sales data, released by the National Bureau of Statistics of China on a monthly basis, measures the value of goods sold by retailers in China. Changes in Retail Sales are widely followed as an indicator of consumer spending. Percent changes reflect the rate of changes in such sales, with the YoY reading comparing sales values in the reference month with the same month a year earlier. Generally, a high reading is seen as bullish for the Renminbi (CNY), while a low reading is seen as bearish.
Read more.Last release: Mon Mar 17, 2025 02:00
Frequency: Monthly
Actual: 4%
Consensus: 4%
Previous: 3.7%
Source: National Bureau of Statistics of China


© 2000-2026. All rights reserved.
This site is managed by Teletrade D.J. LLC 2351 LLC 2022 (Euro House, Richmond Hill Road, Kingstown, VC0100, St. Vincent and the Grenadines).
The information on this website is for informational purposes only and does not constitute any investment advice.
The company does not serve or provide services to customers who are residents of the US, Canada, Iran, The Democratic People's Republic of Korea, Yemen and FATF blacklisted countries.
Making transactions on financial markets with marginal financial instruments opens up wide possibilities and allows investors who are willing to take risks to earn high profits, carrying a potentially high risk of losses at the same time. Therefore you should responsibly approach the issue of choosing the appropriate investment strategy, taking the available resources into account, before starting trading.
Use of the information: full or partial use of materials from this website must always be referenced to TeleTrade as the source of information. Use of the materials on the Internet must be accompanied by a hyperlink to teletrade.org. Automatic import of materials and information from this website is prohibited.
Please contact our PR department if you have any questions or need assistance at pr@teletrade.global.
transfers