- Analytics
- News and Tools
- Market News
- AUD/JPY Price Forecast: Tests 93.00 support, eyes on descending channel’s lower boundary
AUD/JPY Price Forecast: Tests 93.00 support, eyes on descending channel’s lower boundary
- AUD/JPY could target the lower boundary of the descending channel after a successful break below the 93.00 level.
- The 14-day RSI is positioned on the 30 mark, signaling an oversold condition and suggesting a potential upward correction.
- The pair could find the primary barrier at the nine-day EMA of 94.46.
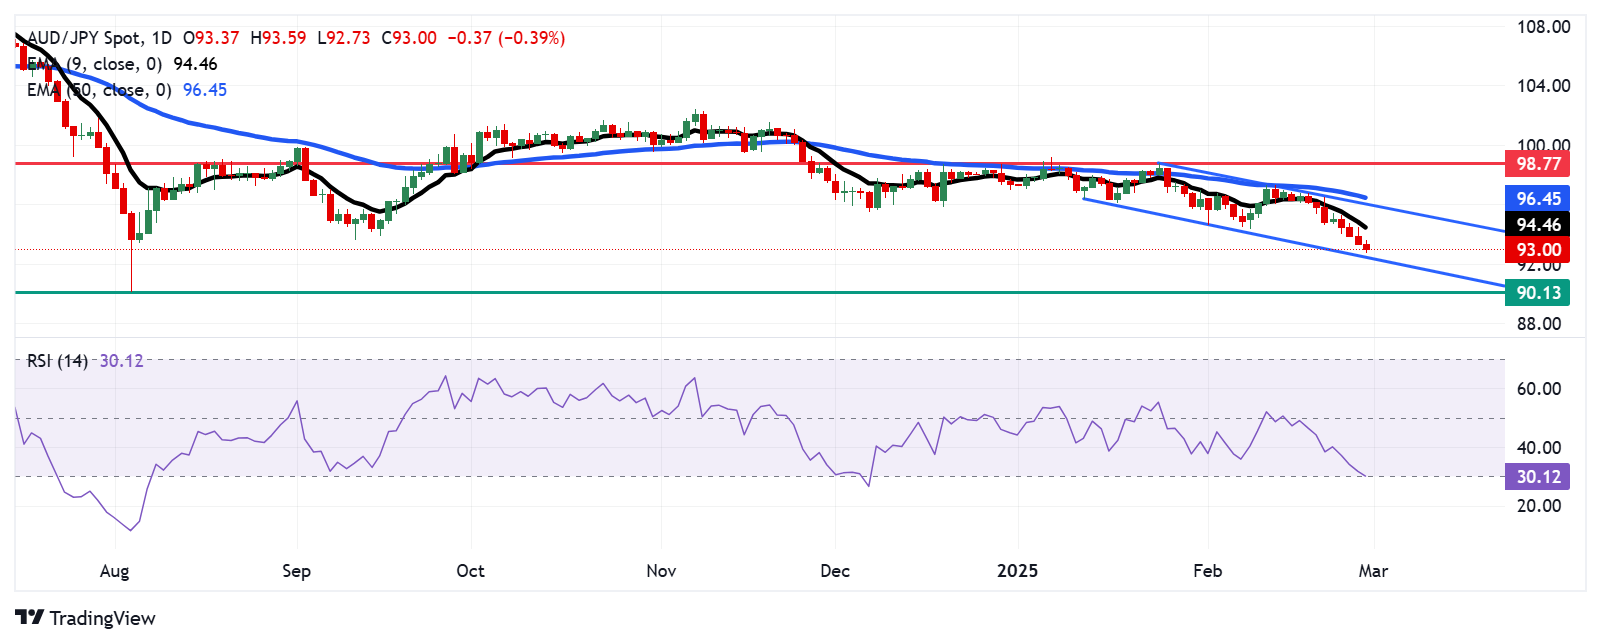
AUD/JPY remains tepid for the fourth successive session, trading around 93.00 during the Asian hours on Friday. A review of the daily chart shows the currency cross moving downwards within a descending channel pattern, indicating the strengthening bearish bias.
The 14-day Relative Strength Index (RSI) sits at the 30 level, signaling an oversold condition and a potential upward correction in the near term. Additionally, the AUD/JPY cross remains below the nine-day Exponential Moving Average (EMA), highlighting weak short-term price momentum.
The AUD/JPY cross tests the immediate support at the 93.00 level, followed by the lower boundary of the descending channel at 92.50. A break below the channel could reinforce the bearish bias and put downward pressure on the currency cross to navigate the region around 90.13, the lowest since May 2023, last seen on August 5, 2024.
On the upside, the AUD/JPY cross could target the primary barrier at the nine-day EMA of 94.46. A break above this level could improve the short-term price momentum and support the pair to approach the upper boundary of the descending channel at the psychological level of 96.00, followed by the 50-day EMA at 96.45.
AUD/JPY: Daily Chart
Australian Dollar PRICE Today
The table below shows the percentage change of Australian Dollar (AUD) against listed major currencies today. Australian Dollar was the weakest against the US Dollar.
| USD | EUR | GBP | JPY | CAD | AUD | NZD | CHF | |
|---|---|---|---|---|---|---|---|---|
| USD | 0.18% | 0.25% | 0.00% | -0.02% | 0.40% | 0.63% | 0.02% | |
| EUR | -0.18% | 0.07% | -0.19% | -0.19% | 0.21% | 0.44% | -0.17% | |
| GBP | -0.25% | -0.07% | -0.24% | -0.26% | 0.15% | 0.38% | -0.25% | |
| JPY | 0.00% | 0.19% | 0.24% | 0.00% | 0.40% | 0.62% | -0.01% | |
| CAD | 0.02% | 0.19% | 0.26% | -0.01% | 0.40% | 0.64% | 0.00% | |
| AUD | -0.40% | -0.21% | -0.15% | -0.40% | -0.40% | 0.23% | -0.39% | |
| NZD | -0.63% | -0.44% | -0.38% | -0.62% | -0.64% | -0.23% | -0.63% | |
| CHF | -0.02% | 0.17% | 0.25% | 0.00% | -0.00% | 0.39% | 0.63% |
The heat map shows percentage changes of major currencies against each other. The base currency is picked from the left column, while the quote currency is picked from the top row. For example, if you pick the Australian Dollar from the left column and move along the horizontal line to the US Dollar, the percentage change displayed in the box will represent AUD (base)/USD (quote).


© 2000-2026. All rights reserved.
This site is managed by Teletrade D.J. LLC 2351 LLC 2022 (Euro House, Richmond Hill Road, Kingstown, VC0100, St. Vincent and the Grenadines).
The information on this website is for informational purposes only and does not constitute any investment advice.
The company does not serve or provide services to customers who are residents of the US, Canada, Iran, The Democratic People's Republic of Korea, Yemen and FATF blacklisted countries.
Making transactions on financial markets with marginal financial instruments opens up wide possibilities and allows investors who are willing to take risks to earn high profits, carrying a potentially high risk of losses at the same time. Therefore you should responsibly approach the issue of choosing the appropriate investment strategy, taking the available resources into account, before starting trading.
Use of the information: full or partial use of materials from this website must always be referenced to TeleTrade as the source of information. Use of the materials on the Internet must be accompanied by a hyperlink to teletrade.org. Automatic import of materials and information from this website is prohibited.
Please contact our PR department if you have any questions or need assistance at pr@teletrade.global.
transfers