- Analytics
- News and Tools
- Market News
- GBP/USD Price Forecast: Tests 1.2650 support near nine-day EMA
GBP/USD Price Forecast: Tests 1.2650 support near nine-day EMA
- The GBP/USD pair could target the nine-day EMA support at 1.2613.
- The 14-day RSI remains above the 50 level, indicating sustained bullish momentum.
- The initial resistance appears at the two-month high of 1.2690.
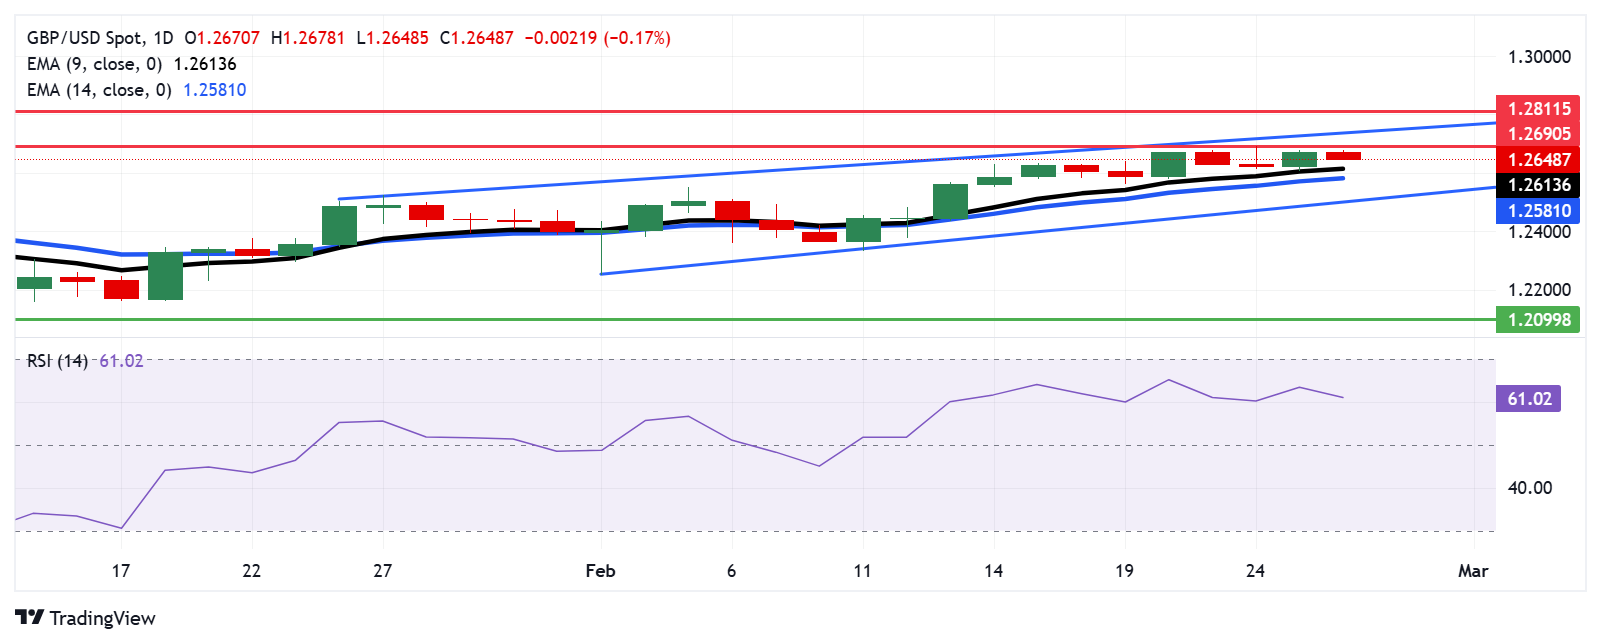
The GBP/USD pair gives up part of its recent gains from the prior session, hovering around 1.2650 during Wednesday’s Asian session. Despite this pullback, technical analysis of the daily chart indicates a sustained bullish outlook, as the pair remains within an ascending channel pattern.
The 14-day Relative Strength Index (RSI) stays above the 50 mark, reflecting strengthened bullish momentum. Additionally, the pair continues to trade above the nine- and 14-day Exponential Moving Averages (EMAs), highlighting robust short-term price dynamics and confirming the prevailing upward trend.
The GBP/USD pair faces immediate resistance at the two-month high of 1.2690, reached on February 24, followed by the ascending channel’s upper boundary around the 1.2750 level. A decisive break above this level could strengthen the bullish outlook, paving the way for a test of the three-month high at 1.2811, last seen on December 6.
On the downside, the GBP/USD pair may find immediate support at the nine-day EMA of 1.2613, followed by the 14-day EMA at 1.2581. A break below these levels could undermine short-term price momentum, pushing the pair toward the ascending channel’s lower boundary around the 1.2500 mark.
GBP/USD: Daily Chart
British Pound PRICE Today
The table below shows the percentage change of British Pound (GBP) against listed major currencies today. British Pound was the weakest against the US Dollar.
| USD | EUR | GBP | JPY | CAD | AUD | NZD | CHF | |
|---|---|---|---|---|---|---|---|---|
| USD | 0.11% | 0.17% | 0.30% | 0.08% | 0.26% | 0.19% | 0.10% | |
| EUR | -0.11% | 0.06% | 0.19% | -0.03% | 0.14% | 0.08% | -0.01% | |
| GBP | -0.17% | -0.06% | 0.11% | -0.08% | 0.09% | 0.03% | -0.06% | |
| JPY | -0.30% | -0.19% | -0.11% | -0.21% | -0.04% | -0.11% | -0.18% | |
| CAD | -0.08% | 0.03% | 0.08% | 0.21% | 0.17% | 0.10% | 0.03% | |
| AUD | -0.26% | -0.14% | -0.09% | 0.04% | -0.17% | -0.06% | -0.14% | |
| NZD | -0.19% | -0.08% | -0.03% | 0.11% | -0.10% | 0.06% | -0.08% | |
| CHF | -0.10% | 0.01% | 0.06% | 0.18% | -0.03% | 0.14% | 0.08% |
The heat map shows percentage changes of major currencies against each other. The base currency is picked from the left column, while the quote currency is picked from the top row. For example, if you pick the British Pound from the left column and move along the horizontal line to the US Dollar, the percentage change displayed in the box will represent GBP (base)/USD (quote).


© 2000-2026. All rights reserved.
This site is managed by Teletrade D.J. LLC 2351 LLC 2022 (Euro House, Richmond Hill Road, Kingstown, VC0100, St. Vincent and the Grenadines).
The information on this website is for informational purposes only and does not constitute any investment advice.
The company does not serve or provide services to customers who are residents of the US, Canada, Iran, The Democratic People's Republic of Korea, Yemen and FATF blacklisted countries.
Making transactions on financial markets with marginal financial instruments opens up wide possibilities and allows investors who are willing to take risks to earn high profits, carrying a potentially high risk of losses at the same time. Therefore you should responsibly approach the issue of choosing the appropriate investment strategy, taking the available resources into account, before starting trading.
Use of the information: full or partial use of materials from this website must always be referenced to TeleTrade as the source of information. Use of the materials on the Internet must be accompanied by a hyperlink to teletrade.org. Automatic import of materials and information from this website is prohibited.
Please contact our PR department if you have any questions or need assistance at pr@teletrade.global.
transfers