- Analytics
- News and Tools
- Market News
- USD/JPY Price Forecast: Surges as US yields rise, eyes on 200-day SMA
USD/JPY Price Forecast: Surges as US yields rise, eyes on 200-day SMA
- USD/JPY rebounds 0.35% from 151.64 low, driven by bond yield movements.
- Technical analysis hints at bullish shift; resistance near 200-day SMA at 152.76.
- Downside risks if SMA not surpassed; supports at 152.00 and 150.93 in focus.
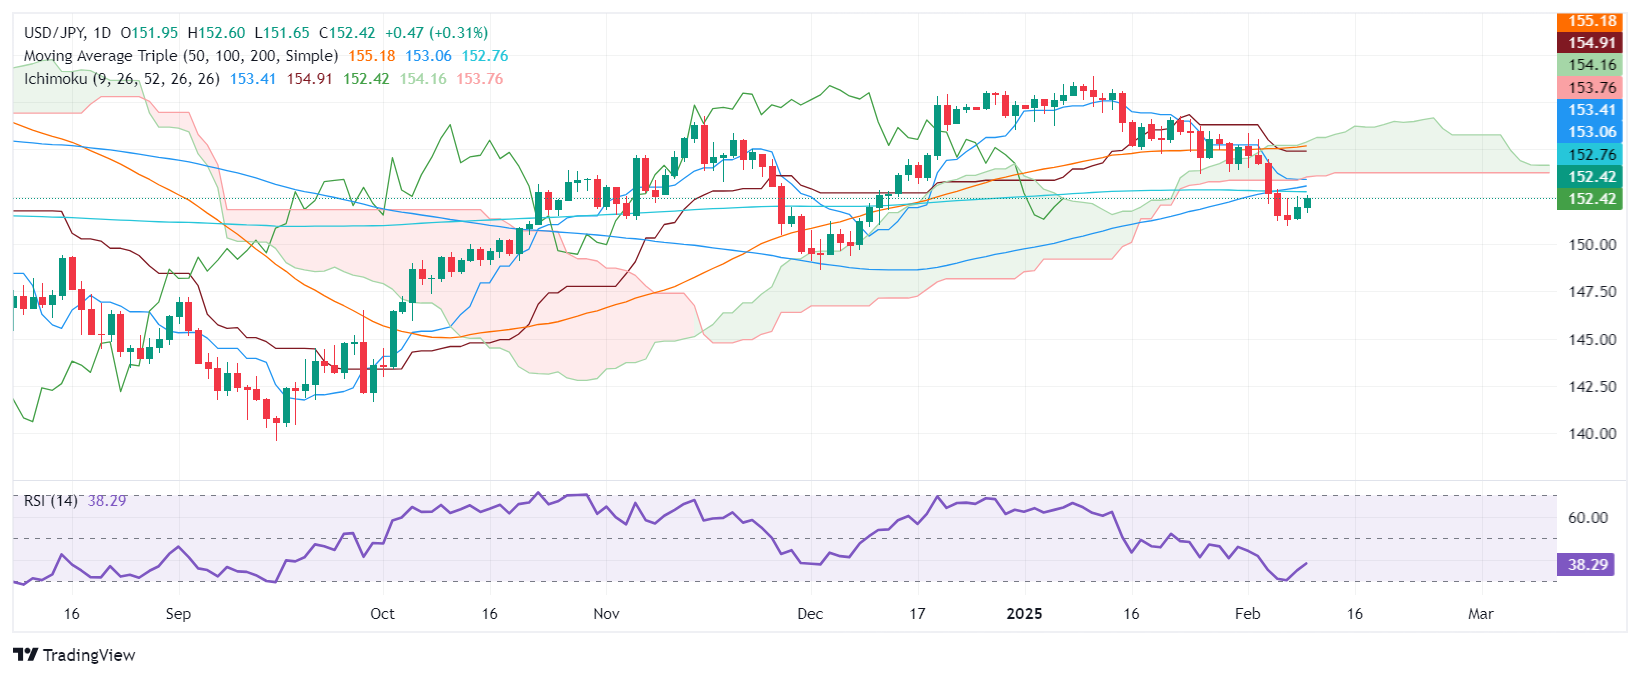
The USD/JPY climbed during the North American session. It trades at 152.52 and posts gains of over 0.35% after hitting a daily low of 151.64. The rise of the US 10-year T-note bond yield spurred the rise of the pair, which is positively correlated to the yield of the 10-year.
USD/JPY Price Forecast: Technical outlook
The USD/JPY remains biased downward, even though buyers could challenge the 200-day Simple Moving Average (SMA) at 152.76. The momentum shifted slightly bullish even though the relative strength index (RSI) remains bearish, and the slope aims upwards.
If buyers regain the 200-day SMA, the following key resistance would be the 153.00 mark before testing the Senkou Span B base at 153.76.
On the other hand, if USD/JPY stays below the 200-day SMA, the first support would be the 152.00 figure. Further losses lie below the February 7 daily low of 150.93, followed by the December 3 swing low of 148.64.
USD/JPY Price Chart – Daily
Japanese Yen PRICE Today
The table below shows the percentage change of Japanese Yen (JPY) against listed major currencies today. Japanese Yen was the strongest against the Swiss Franc.
| USD | EUR | GBP | JPY | CAD | AUD | NZD | CHF | |
|---|---|---|---|---|---|---|---|---|
| USD | -0.53% | -0.60% | 0.30% | -0.16% | -0.28% | -0.23% | 0.16% | |
| EUR | 0.53% | -0.08% | 0.85% | 0.39% | 0.25% | 0.30% | 0.70% | |
| GBP | 0.60% | 0.08% | 0.93% | 0.46% | 0.31% | 0.36% | 0.76% | |
| JPY | -0.30% | -0.85% | -0.93% | -0.45% | -0.59% | -0.53% | -0.14% | |
| CAD | 0.16% | -0.39% | -0.46% | 0.45% | -0.13% | -0.08% | 0.31% | |
| AUD | 0.28% | -0.25% | -0.31% | 0.59% | 0.13% | 0.05% | 0.44% | |
| NZD | 0.23% | -0.30% | -0.36% | 0.53% | 0.08% | -0.05% | 0.39% | |
| CHF | -0.16% | -0.70% | -0.76% | 0.14% | -0.31% | -0.44% | -0.39% |
The heat map shows percentage changes of major currencies against each other. The base currency is picked from the left column, while the quote currency is picked from the top row. For example, if you pick the Japanese Yen from the left column and move along the horizontal line to the US Dollar, the percentage change displayed in the box will represent JPY (base)/USD (quote).


© 2000-2026. All rights reserved.
This site is managed by Teletrade D.J. LLC 2351 LLC 2022 (Euro House, Richmond Hill Road, Kingstown, VC0100, St. Vincent and the Grenadines).
The information on this website is for informational purposes only and does not constitute any investment advice.
The company does not serve or provide services to customers who are residents of the US, Canada, Iran, The Democratic People's Republic of Korea, Yemen and FATF blacklisted countries.
Making transactions on financial markets with marginal financial instruments opens up wide possibilities and allows investors who are willing to take risks to earn high profits, carrying a potentially high risk of losses at the same time. Therefore you should responsibly approach the issue of choosing the appropriate investment strategy, taking the available resources into account, before starting trading.
Use of the information: full or partial use of materials from this website must always be referenced to TeleTrade as the source of information. Use of the materials on the Internet must be accompanied by a hyperlink to teletrade.org. Automatic import of materials and information from this website is prohibited.
Please contact our PR department if you have any questions or need assistance at pr@teletrade.global.
transfers