- Analytics
- News and Tools
- Market News
- USD/CHF Price Analysis: Clings to gains as trade tensions begin to fade
USD/CHF Price Analysis: Clings to gains as trade tensions begin to fade
- USD/CHF gains 0.19% to 0.9126, retreating from three-week peak as trade negotiations show promise.
- Technical analysis suggests bullish trend with potential to target 0.9200 if support at 0.9100 holds.
- Downside risks loom if pair drops below 0.9100, with possible retracement to 0.8990 SMA level.
The USD/CHF trims some gains after reaching a three-week high of 0.9195. Risk appetite improves due to a delay in the US applying tariffs in Mexico, an indication that Washington is open to negotiating trade terms. At the time of writing, the pair trades at 0.9126, up 0.19%.
USD/CHF Price Analysis: Technical outlook
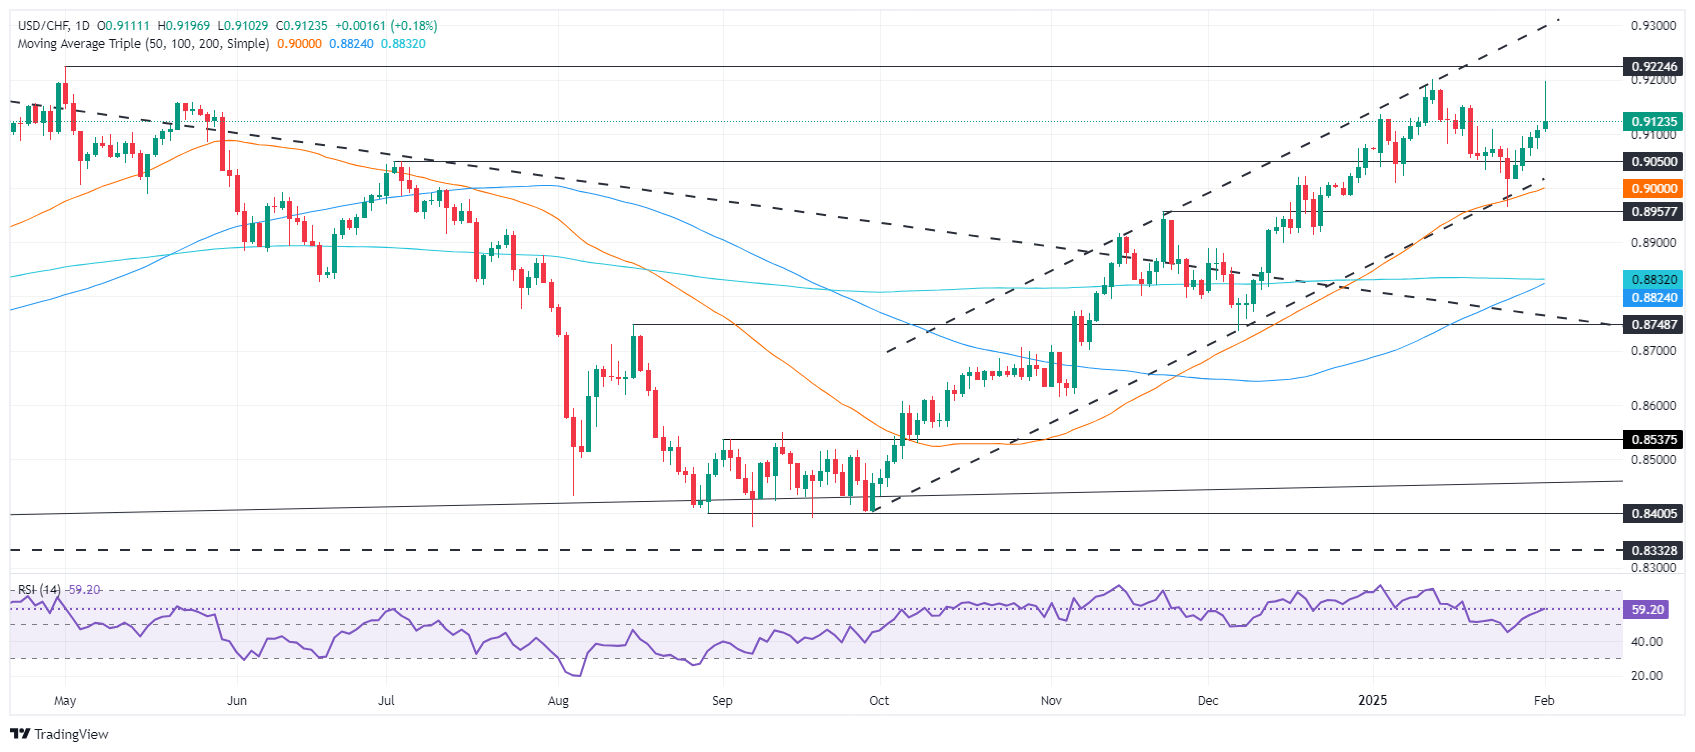
The USD/CHF is in a correction mode on an intraday basis, but the overall trend is upward, as depicted in the daily chart. However, bulls need to keep prices above 0.9100 on a daily basis so they can challenge the 0.9200 figure in the near term.
Momentum favors further upside, as depicted by the Relative Strength Index (RSI). Therefore, if USD/CHF advances past 0.9200, the following key resistance would be the April 2024 high at 0.9224 before challenging 0.9300.
Nevertheless, if sellers push the USD/CHF exchange rate below 0.9100, this could pave the way for a pullback towards the 50-day Simple Moving Average (SMA) at 0.8990. A breach of the latter will expose a November 2024 swing low of 0.8956.
USD/CHF Price Chart – Daily
Swiss Franc PRICE Today
The table below shows the percentage change of Swiss Franc (CHF) against listed major currencies today. Swiss Franc was the strongest against the US Dollar.
| USD | EUR | GBP | JPY | CAD | AUD | NZD | CHF | |
|---|---|---|---|---|---|---|---|---|
| USD | 0.65% | -0.07% | -0.19% | -0.91% | 0.39% | -0.04% | -0.40% | |
| EUR | -0.65% | -0.32% | 0.48% | -0.26% | 0.20% | 0.61% | 0.28% | |
| GBP | 0.07% | 0.32% | -0.31% | 0.06% | 0.53% | 0.93% | 0.61% | |
| JPY | 0.19% | -0.48% | 0.31% | -0.72% | 0.73% | 1.08% | 0.46% | |
| CAD | 0.91% | 0.26% | -0.06% | 0.72% | 0.21% | 0.87% | 0.55% | |
| AUD | -0.39% | -0.20% | -0.53% | -0.73% | -0.21% | 0.40% | 0.05% | |
| NZD | 0.04% | -0.61% | -0.93% | -1.08% | -0.87% | -0.40% | -0.32% | |
| CHF | 0.40% | -0.28% | -0.61% | -0.46% | -0.55% | -0.05% | 0.32% |
The heat map shows percentage changes of major currencies against each other. The base currency is picked from the left column, while the quote currency is picked from the top row. For example, if you pick the Swiss Franc from the left column and move along the horizontal line to the US Dollar, the percentage change displayed in the box will represent CHF (base)/USD (quote).


© 2000-2026. All rights reserved.
This site is managed by Teletrade D.J. LLC 2351 LLC 2022 (Euro House, Richmond Hill Road, Kingstown, VC0100, St. Vincent and the Grenadines).
The information on this website is for informational purposes only and does not constitute any investment advice.
The company does not serve or provide services to customers who are residents of the US, Canada, Iran, The Democratic People's Republic of Korea, Yemen and FATF blacklisted countries.
Making transactions on financial markets with marginal financial instruments opens up wide possibilities and allows investors who are willing to take risks to earn high profits, carrying a potentially high risk of losses at the same time. Therefore you should responsibly approach the issue of choosing the appropriate investment strategy, taking the available resources into account, before starting trading.
Use of the information: full or partial use of materials from this website must always be referenced to TeleTrade as the source of information. Use of the materials on the Internet must be accompanied by a hyperlink to teletrade.org. Automatic import of materials and information from this website is prohibited.
Please contact our PR department if you have any questions or need assistance at pr@teletrade.global.
transfers