- Analytics
- News and Tools
- Market News
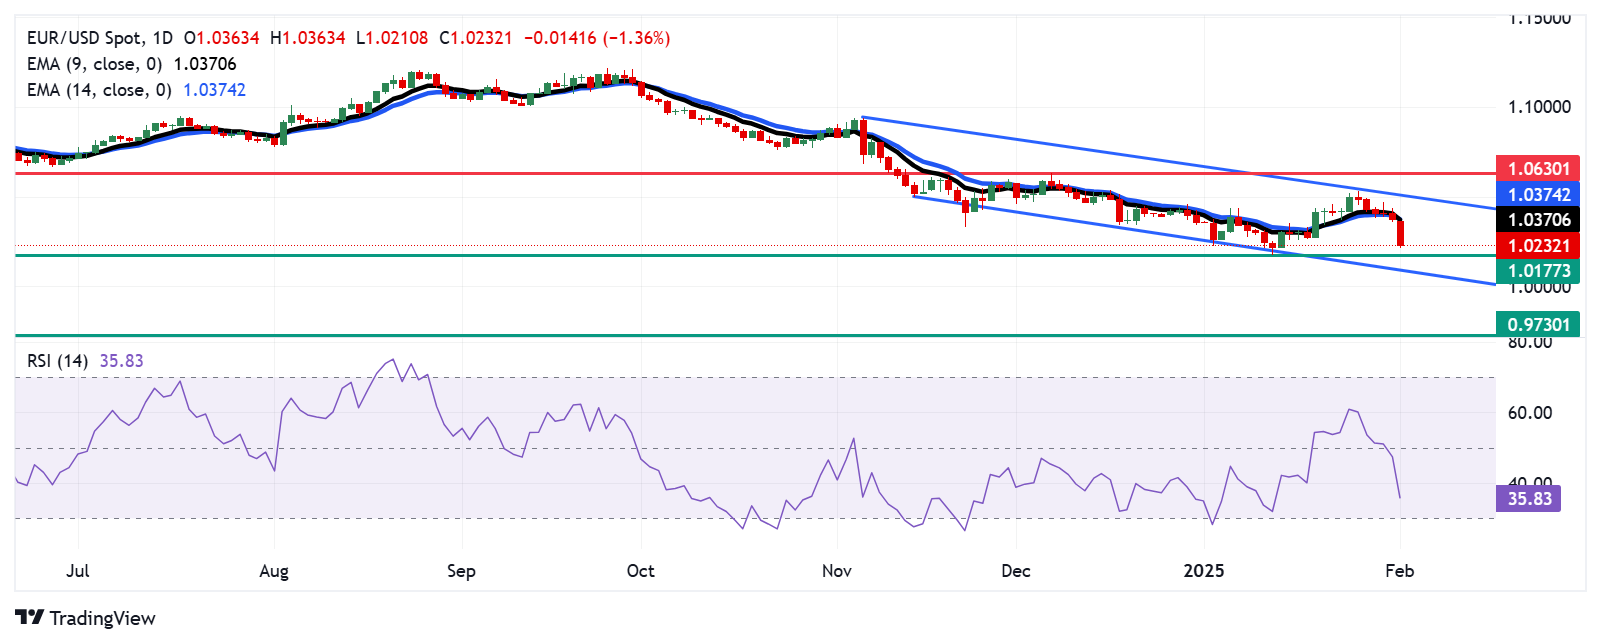
- EUR/USD Price Analysis: Falls toward 1.0200 near 27-month lows
EUR/USD Price Analysis: Falls toward 1.0200 near 27-month lows
- EUR/USD struggles as it is confined within a descending channel pattern.
- The 14-day RSI drops near the 30 level, indicating persistent selling pressure on the pair.
- The primary support appears at 1.0177, a 27-month low reached on January 14.
The EUR/USD pair continues its downward trend, which started on January 27, trading around 1.0230 during the Asian session on Monday. A closer examination of the daily chart indicates that the bearish momentum is likely to persist, with the pair confined within a descending channel pattern.
The 14-day Relative Strength Index (RSI), a key indicator of momentum, is falling towards the 30 level, suggesting ongoing selling pressure on the EUR/USD pair. Furthermore, the pair remains below both the nine- and 14-day Exponential Moving Averages (EMAs), signaling weaker short-term momentum and reinforcing the bearish outlook.
The EUR/USD pair is likely to test its primary support at 1.0177, a 27-month low reached on January 14. A break below this level could push the pair towards the psychological support at 1.0000, aligning with the lower boundary of the descending channel. A decisive move below this point could intensify the bearish sentiment, potentially driving the pair down to 0.9730, the lowest level since November 2022.
On the upside, the EUR/USD pair could face initial resistance at the nine-day EMA around 1.0369. A breakout above this level could improve market sentiment, paving the way for a move toward the upper boundary of the descending channel at 1.0500. Further gains may bring the pair to the three-month high of 1.0630, reached on December 6.
EUR/USD: Daily Chart
Euro PRICE Today
The table below shows the percentage change of Euro (EUR) against listed major currencies today. Euro was the weakest against the US Dollar.
| USD | EUR | GBP | JPY | CAD | AUD | NZD | CHF | |
|---|---|---|---|---|---|---|---|---|
| USD | 1.25% | 1.06% | 0.40% | 0.31% | 1.49% | 0.92% | 0.05% | |
| EUR | -1.25% | 0.21% | 0.46% | 0.37% | 0.70% | 0.97% | 0.10% | |
| GBP | -1.06% | -0.21% | -0.84% | 0.16% | 0.50% | 0.76% | -0.10% | |
| JPY | -0.40% | -0.46% | 0.84% | -0.09% | 1.24% | 1.42% | 0.29% | |
| CAD | -0.31% | -0.37% | -0.16% | 0.09% | 0.07% | 0.60% | -0.26% | |
| AUD | -1.49% | -0.70% | -0.50% | -1.24% | -0.07% | 0.27% | -0.59% | |
| NZD | -0.92% | -0.97% | -0.76% | -1.42% | -0.60% | -0.27% | -0.86% | |
| CHF | -0.05% | -0.10% | 0.10% | -0.29% | 0.26% | 0.59% | 0.86% |
The heat map shows percentage changes of major currencies against each other. The base currency is picked from the left column, while the quote currency is picked from the top row. For example, if you pick the Euro from the left column and move along the horizontal line to the US Dollar, the percentage change displayed in the box will represent EUR (base)/USD (quote).


© 2000-2026. All rights reserved.
This site is managed by Teletrade D.J. LLC 2351 LLC 2022 (Euro House, Richmond Hill Road, Kingstown, VC0100, St. Vincent and the Grenadines).
The information on this website is for informational purposes only and does not constitute any investment advice.
The company does not serve or provide services to customers who are residents of the US, Canada, Iran, The Democratic People's Republic of Korea, Yemen and FATF blacklisted countries.
Making transactions on financial markets with marginal financial instruments opens up wide possibilities and allows investors who are willing to take risks to earn high profits, carrying a potentially high risk of losses at the same time. Therefore you should responsibly approach the issue of choosing the appropriate investment strategy, taking the available resources into account, before starting trading.
Use of the information: full or partial use of materials from this website must always be referenced to TeleTrade as the source of information. Use of the materials on the Internet must be accompanied by a hyperlink to teletrade.org. Automatic import of materials and information from this website is prohibited.
Please contact our PR department if you have any questions or need assistance at pr@teletrade.global.
transfers