- Analytics
- News and Tools
- Market News
- EUR/GBP Price Forecast: Subdued near 0.8400 on risk-off mood
EUR/GBP Price Forecast: Subdued near 0.8400 on risk-off mood
- EUR/GBP fluctuates within 30 pip range, holds above 0.8400 with a minor 0.02% increase.
- Sterling faces pressure as China's manufacturing PMI downturn favors Euro gains.
- Technical outlook suggests consolidation potential; key resistance at 200-day SMA of 0.8422.
The EUR/GBP is firm during the North American session, after seesawing in a 30 pip range, though buyers reclaimed the 0.8400 figure for a small gain of 0.02%.
Market mood remains negatively, on news that China’s business activity worsened in January according to the National Bureau of Statistics (NBS) Manufacturing PMI. This weighed on Sterling, which is weakened against the single currency.
EUR/GBP Price Forecast: Technical outlook
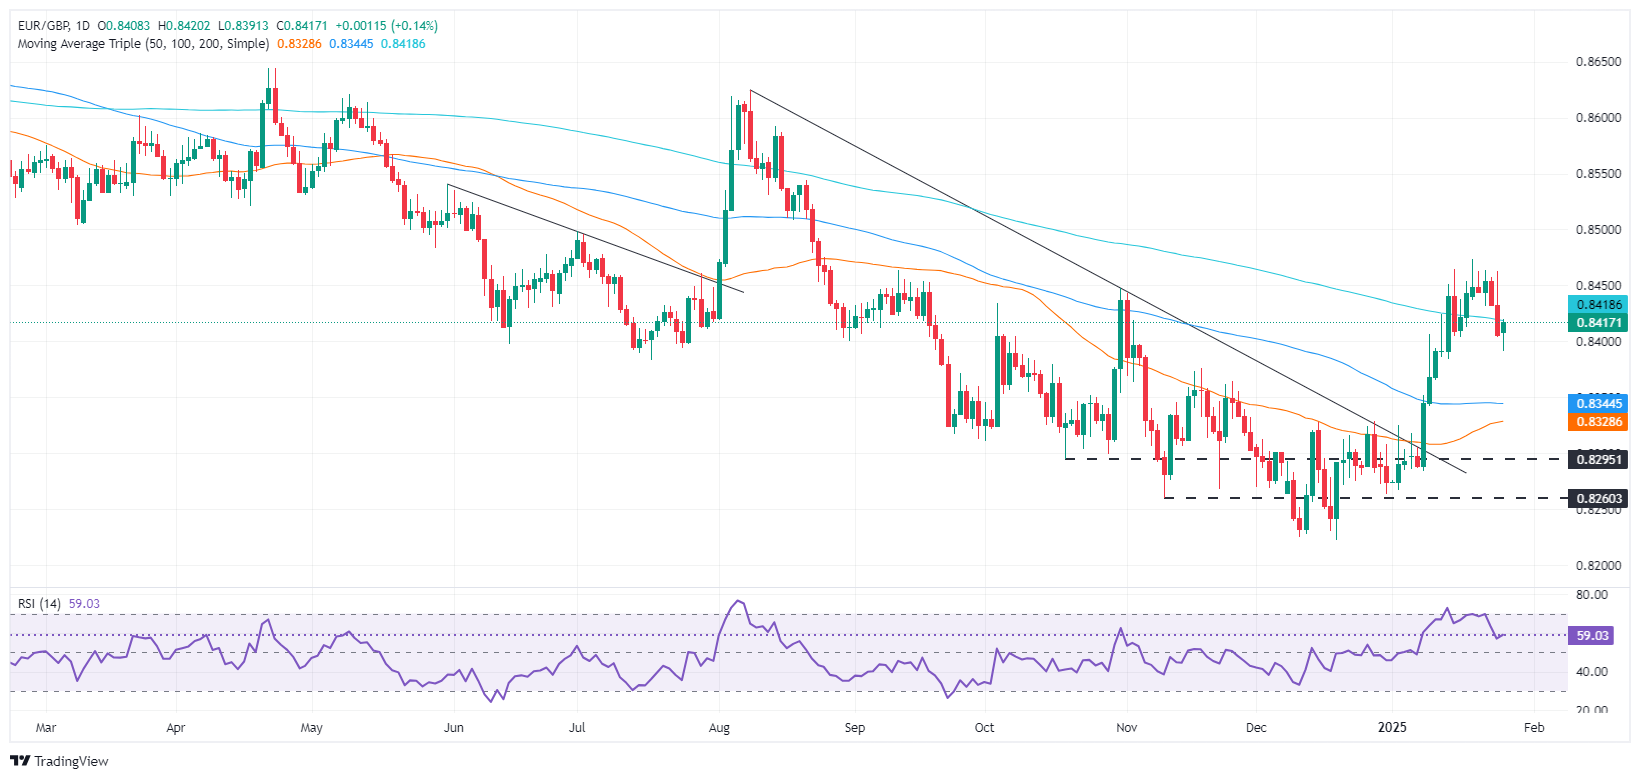
The EUR/GBP has extended its losses below the 200-day Simple Moving Average (SMA) at 0.8422, which has opened the door to test challenge lower prices, but bulls are stepping in around the 0.8400 figure.
The relative Strength Index (RSI) is bullish, though it has turned flat, an indication that the cross might consolidate, before resuming its ongoing uptrend.
For a bullish continuation, buyers must crack the 200-day SMA. If cleared, the next stop will be the January 24 daily high at 0.8462, ahead of the next cycle high at 0.8473 the January 20 peak.
On the other hand, if sellers push prices below the 0.8400 figure, the next support would be the latest pivot low of 0.8383 the January 14 low, followed by the 100-day SMA at 0.8347.
EUR/GBP Price Chart – Daily
Euro PRICE Today
The table below shows the percentage change of Euro (EUR) against listed major currencies today. Euro was the strongest against the New Zealand Dollar.
| USD | EUR | GBP | JPY | CAD | AUD | NZD | CHF | |
|---|---|---|---|---|---|---|---|---|
| USD | -0.03% | 0.07% | -0.68% | 0.20% | 0.58% | 0.48% | -0.48% | |
| EUR | 0.03% | 0.17% | -0.54% | 0.37% | 0.62% | 0.63% | -0.35% | |
| GBP | -0.07% | -0.17% | -1.00% | 0.20% | 0.45% | 0.48% | -0.51% | |
| JPY | 0.68% | 0.54% | 1.00% | 0.94% | 1.46% | 1.41% | 0.36% | |
| CAD | -0.20% | -0.37% | -0.20% | -0.94% | 0.18% | 0.28% | -0.71% | |
| AUD | -0.58% | -0.62% | -0.45% | -1.46% | -0.18% | 0.05% | -0.92% | |
| NZD | -0.48% | -0.63% | -0.48% | -1.41% | -0.28% | -0.05% | -1.20% | |
| CHF | 0.48% | 0.35% | 0.51% | -0.36% | 0.71% | 0.92% | 1.20% |
The heat map shows percentage changes of major currencies against each other. The base currency is picked from the left column, while the quote currency is picked from the top row. For example, if you pick the Euro from the left column and move along the horizontal line to the US Dollar, the percentage change displayed in the box will represent EUR (base)/USD (quote).


© 2000-2026. All rights reserved.
This site is managed by Teletrade D.J. LLC 2351 LLC 2022 (Euro House, Richmond Hill Road, Kingstown, VC0100, St. Vincent and the Grenadines).
The information on this website is for informational purposes only and does not constitute any investment advice.
The company does not serve or provide services to customers who are residents of the US, Canada, Iran, The Democratic People's Republic of Korea, Yemen and FATF blacklisted countries.
Making transactions on financial markets with marginal financial instruments opens up wide possibilities and allows investors who are willing to take risks to earn high profits, carrying a potentially high risk of losses at the same time. Therefore you should responsibly approach the issue of choosing the appropriate investment strategy, taking the available resources into account, before starting trading.
Use of the information: full or partial use of materials from this website must always be referenced to TeleTrade as the source of information. Use of the materials on the Internet must be accompanied by a hyperlink to teletrade.org. Automatic import of materials and information from this website is prohibited.
Please contact our PR department if you have any questions or need assistance at pr@teletrade.global.
transfers