- Analytics
- News and Tools
- Market News
- USD/CAD Price Forecast: Tests 1.4400; next barrier appears near multi-year highs
USD/CAD Price Forecast: Tests 1.4400; next barrier appears near multi-year highs
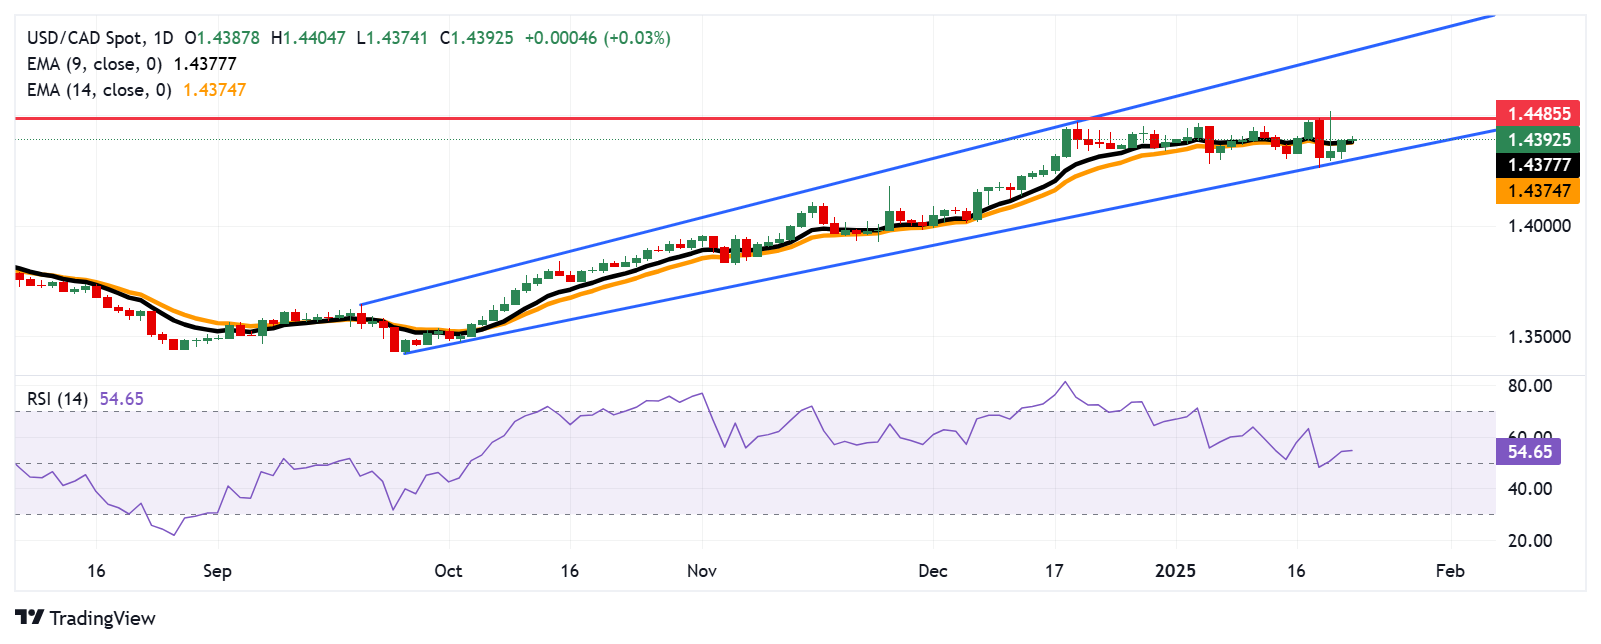
- USD/CAD could test 1.4485, the highest level since March 2020.
- The bullish bias persists, as the 14-day RSI stays above the 50 mark.
- Initial support for the pair is provided by the nine-day EMA at the 1.4377 level.
The USD/CAD pair continues its upward trend for the third consecutive session, hovering around 1.4390 during Thursday’s Asian trading hours. Technically, the daily chart shows the pair moving within an ascending channel, suggesting a prevailing bullish outlook.
The 14-day Relative Strength Index (RSI) remains just above the 50 mark, indicating sustained positive momentum. A sustained RSI above 50 would likely reinforce this bullish sentiment.
Additionally, the USD/CAD pair trades slightly above the nine- and 14-day Exponential Moving Averages (EMAs), further emphasizing the bullish trend and strong short-term price action. This alignment points to robust buying interest and signals the possibility of additional upward movement.
On the upside, the USD/CAD pair tests the psychological level of 1.4400, remaining poised to test 1.4485, its highest point since March 2020, reached on January 20. Further resistance is seen at the upper boundary of the ascending channel, close to the key psychological level of 1.4800.
Initial support is found around the nine-day EMA at 1.4377, followed by the 14-day EMA at 1.4374, which coincides with the lower boundary of the ascending channel.
USD/CAD: Daily Chart
Canadian Dollar PRICE Today
The table below shows the percentage change of Canadian Dollar (CAD) against listed major currencies today. Canadian Dollar was the weakest against the Swiss Franc.
| USD | EUR | GBP | JPY | CAD | AUD | NZD | CHF | |
|---|---|---|---|---|---|---|---|---|
| USD | 0.03% | 0.01% | -0.02% | 0.01% | -0.01% | -0.01% | -0.03% | |
| EUR | -0.03% | -0.02% | -0.08% | -0.02% | -0.05% | -0.05% | -0.07% | |
| GBP | -0.01% | 0.02% | -0.04% | 0.00% | -0.03% | -0.02% | -0.05% | |
| JPY | 0.02% | 0.08% | 0.04% | 0.04% | 0.02% | -0.03% | -0.01% | |
| CAD | -0.01% | 0.02% | -0.00% | -0.04% | -0.02% | -0.03% | -0.05% | |
| AUD | 0.01% | 0.05% | 0.03% | -0.02% | 0.02% | 0.00% | -0.02% | |
| NZD | 0.01% | 0.05% | 0.02% | 0.03% | 0.03% | -0.00% | -0.02% | |
| CHF | 0.03% | 0.07% | 0.05% | 0.01% | 0.05% | 0.02% | 0.02% |
The heat map shows percentage changes of major currencies against each other. The base currency is picked from the left column, while the quote currency is picked from the top row. For example, if you pick the Canadian Dollar from the left column and move along the horizontal line to the US Dollar, the percentage change displayed in the box will represent CAD (base)/USD (quote).


© 2000-2026. All rights reserved.
This site is managed by Teletrade D.J. LLC 2351 LLC 2022 (Euro House, Richmond Hill Road, Kingstown, VC0100, St. Vincent and the Grenadines).
The information on this website is for informational purposes only and does not constitute any investment advice.
The company does not serve or provide services to customers who are residents of the US, Canada, Iran, The Democratic People's Republic of Korea, Yemen and FATF blacklisted countries.
Making transactions on financial markets with marginal financial instruments opens up wide possibilities and allows investors who are willing to take risks to earn high profits, carrying a potentially high risk of losses at the same time. Therefore you should responsibly approach the issue of choosing the appropriate investment strategy, taking the available resources into account, before starting trading.
Use of the information: full or partial use of materials from this website must always be referenced to TeleTrade as the source of information. Use of the materials on the Internet must be accompanied by a hyperlink to teletrade.org. Automatic import of materials and information from this website is prohibited.
Please contact our PR department if you have any questions or need assistance at pr@teletrade.global.
transfers