- Analytics
- News and Tools
- Market News
- GBP/USD Price Forecast: Climbs on UK fiscal changes, stalls at 100-day SMA
GBP/USD Price Forecast: Climbs on UK fiscal changes, stalls at 100-day SMA
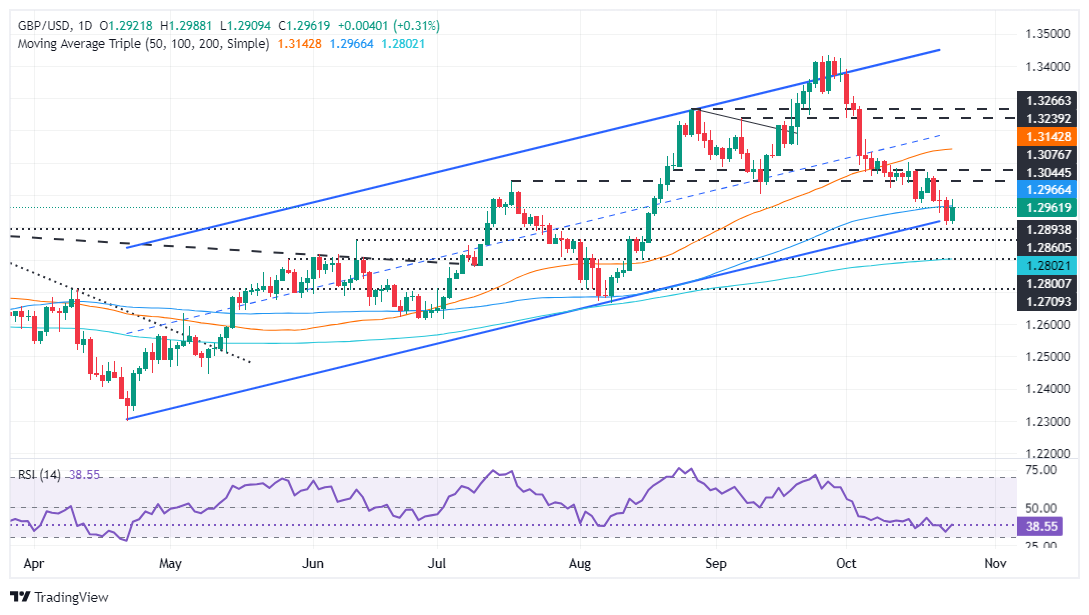
- GBP/USD bounces off two-month low of 1.2907, testing resistance near the 100-day SMA at 1.2964.
- Sellers maintain control as momentum points downward, with key support at 1.2900 and the 200-day SMA at 1.2800.
- A move above 1.3000 could open the door for a test of 1.3102, with further resistance at the 50-day SMA at 1.3140.
The Pound Sterling recovered some ground against the Greenback after UK GILTS yields jumped after Chancellor Reeves confirmed that a change to UK fiscal rules would help fund GBP 20 billion in investment. At the time of writing, the GBP/USD trade was 1.2974, up by 0.41%.
GBP/USD Price Forecast: Technical outlook
The GBP/USD bounced off the bottom trendline of an ascending channel after hitting a two-month low of 1.2907. Since then, the pair recovered some ground and hit a high of 1.2987, before struggling to sustain the advance above the 100-day Simple Moving Average (SMA) at 1.2964.
Momentum shows sellers are in charge, even though the Relative Strength Index (RSI) aimed slightly up but so far failed to clear the latest peak. Therefore, the path of least resistance is tilted to the downside.
The first support for GBP/USD would be 1.2900. Once surpassed, sellers could push prices toward the 200-day SMA at 1.2800.
On the other hand, a bullish continuation could happen if GBP/USD climbs above 1.3000 and clears the October 15 high at 1.3102. Further upside lies at the 50-day SMA at 1.3140.
GBP/USD Price Chart – Daily
British Pound PRICE Today
The table below shows the percentage change of British Pound (GBP) against listed major currencies today. British Pound was the strongest against the Canadian Dollar.
| USD | EUR | GBP | JPY | CAD | AUD | NZD | CHF | |
|---|---|---|---|---|---|---|---|---|
| USD | -0.16% | -0.31% | -0.59% | 0.09% | 0.06% | -0.03% | -0.02% | |
| EUR | 0.16% | -0.16% | -0.43% | 0.25% | 0.21% | 0.12% | 0.12% | |
| GBP | 0.31% | 0.16% | -0.28% | 0.40% | 0.36% | 0.27% | 0.28% | |
| JPY | 0.59% | 0.43% | 0.28% | 0.68% | 0.65% | 0.53% | 0.57% | |
| CAD | -0.09% | -0.25% | -0.40% | -0.68% | -0.03% | -0.13% | -0.12% | |
| AUD | -0.06% | -0.21% | -0.36% | -0.65% | 0.03% | -0.08% | -0.08% | |
| NZD | 0.03% | -0.12% | -0.27% | -0.53% | 0.13% | 0.08% | 0.01% | |
| CHF | 0.02% | -0.12% | -0.28% | -0.57% | 0.12% | 0.08% | -0.01% |
The heat map shows percentage changes of major currencies against each other. The base currency is picked from the left column, while the quote currency is picked from the top row. For example, if you pick the British Pound from the left column and move along the horizontal line to the US Dollar, the percentage change displayed in the box will represent GBP (base)/USD (quote).


© 2000-2026. All rights reserved.
This site is managed by Teletrade D.J. LLC 2351 LLC 2022 (Euro House, Richmond Hill Road, Kingstown, VC0100, St. Vincent and the Grenadines).
The information on this website is for informational purposes only and does not constitute any investment advice.
The company does not serve or provide services to customers who are residents of the US, Canada, Iran, The Democratic People's Republic of Korea, Yemen and FATF blacklisted countries.
Making transactions on financial markets with marginal financial instruments opens up wide possibilities and allows investors who are willing to take risks to earn high profits, carrying a potentially high risk of losses at the same time. Therefore you should responsibly approach the issue of choosing the appropriate investment strategy, taking the available resources into account, before starting trading.
Use of the information: full or partial use of materials from this website must always be referenced to TeleTrade as the source of information. Use of the materials on the Internet must be accompanied by a hyperlink to teletrade.org. Automatic import of materials and information from this website is prohibited.
Please contact our PR department if you have any questions or need assistance at pr@teletrade.global.
transfers