- Analytics
- News and Tools
- Market News
- GBP/USD Price Forecast: Dips below 100-day SMA, sellers target 1.2900
GBP/USD Price Forecast: Dips below 100-day SMA, sellers target 1.2900
- GBP/USD falls for the third consecutive day, trading below the 100-day SMA at 1.2962, with downside risks growing.
- Bearish RSI indicates further weakness, with key support at 1.2910-1.2920 and the 200-day SMA at 1.2799.
- A rebound could see a retest of the 1.3000 level, with next resistance at 1.3070 and the 50-day SMA at 1.3138.
The Pound Sterling extended its losses for the third straight day against the Greenback amid a scarce economic docket in the UK that will feature remarks of Bank of England (BoE) Governor Andrew Bailey. At the time of writing, the GBP/USD trades at 1.2954, down 0.22%.
GBP/USD Price Forecast: Technical outlook
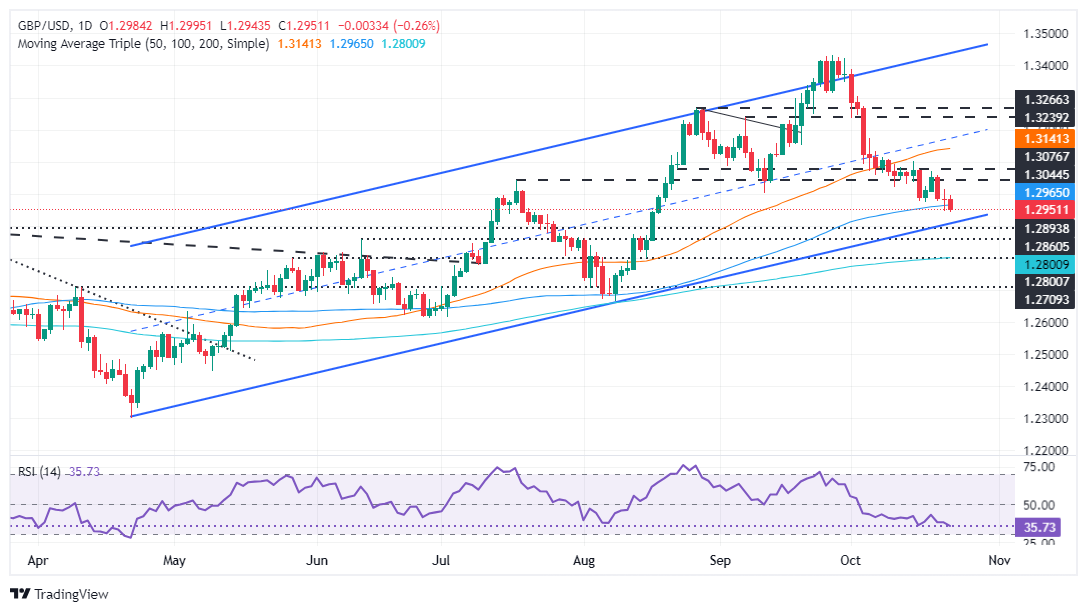
The GBP/USD has fallen below the 100-day simple moving average (SMA) at 1.2962, opening the door for further downside. Sellers are gathering some steam, as depicted by the Relative Strength Index (RSI).
The RSI is bearish and extending its downtrend yet shy of turning oversold. Hence, the GBP/USD could continue to edge lower.
If GBP/USD decisively breaks 1.2950, the next support would be the bottom trendline of an ascending channel at 1.2910-1.2920, followed by the 1.2900 mark. On further weakness, the next stop would be the 200-day SMA at 1.2799.
However, if GBP/USD rebounds at around the 100-day SMA, look for a retest of 1.3000. If buyers punch that level, the next resistance would be the October 18 peak at 1.3070, ahead of the 50-day SMA at 1.3138.
GBP/USD Price Chart – Daily
British Pound PRICE Today
The table below shows the percentage change of British Pound (GBP) against listed major currencies today. British Pound was the strongest against the Japanese Yen.
| USD | EUR | GBP | JPY | CAD | AUD | NZD | CHF | |
|---|---|---|---|---|---|---|---|---|
| USD | 0.26% | 0.26% | 1.29% | 0.25% | 0.69% | 0.57% | 0.18% | |
| EUR | -0.26% | 0.01% | 1.02% | 0.01% | 0.46% | 0.33% | -0.06% | |
| GBP | -0.26% | -0.01% | 1.01% | -0.02% | 0.45% | 0.32% | -0.02% | |
| JPY | -1.29% | -1.02% | -1.01% | -1.03% | -0.59% | -0.70% | -1.04% | |
| CAD | -0.25% | -0.01% | 0.02% | 1.03% | 0.44% | 0.34% | -0.01% | |
| AUD | -0.69% | -0.46% | -0.45% | 0.59% | -0.44% | -0.10% | -0.45% | |
| NZD | -0.57% | -0.33% | -0.32% | 0.70% | -0.34% | 0.10% | -0.35% | |
| CHF | -0.18% | 0.06% | 0.02% | 1.04% | 0.00% | 0.45% | 0.35% |
The heat map shows percentage changes of major currencies against each other. The base currency is picked from the left column, while the quote currency is picked from the top row. For example, if you pick the British Pound from the left column and move along the horizontal line to the US Dollar, the percentage change displayed in the box will represent GBP (base)/USD (quote).


© 2000-2026. All rights reserved.
This site is managed by Teletrade D.J. LLC 2351 LLC 2022 (Euro House, Richmond Hill Road, Kingstown, VC0100, St. Vincent and the Grenadines).
The information on this website is for informational purposes only and does not constitute any investment advice.
The company does not serve or provide services to customers who are residents of the US, Canada, Iran, The Democratic People's Republic of Korea, Yemen and FATF blacklisted countries.
Making transactions on financial markets with marginal financial instruments opens up wide possibilities and allows investors who are willing to take risks to earn high profits, carrying a potentially high risk of losses at the same time. Therefore you should responsibly approach the issue of choosing the appropriate investment strategy, taking the available resources into account, before starting trading.
Use of the information: full or partial use of materials from this website must always be referenced to TeleTrade as the source of information. Use of the materials on the Internet must be accompanied by a hyperlink to teletrade.org. Automatic import of materials and information from this website is prohibited.
Please contact our PR department if you have any questions or need assistance at pr@teletrade.global.
transfers