- Analytics
- News and Tools
- Market News
- USD/JPY Price Forecast: Fluctuates around 151.00, tests key technical levels
USD/JPY Price Forecast: Fluctuates around 151.00, tests key technical levels
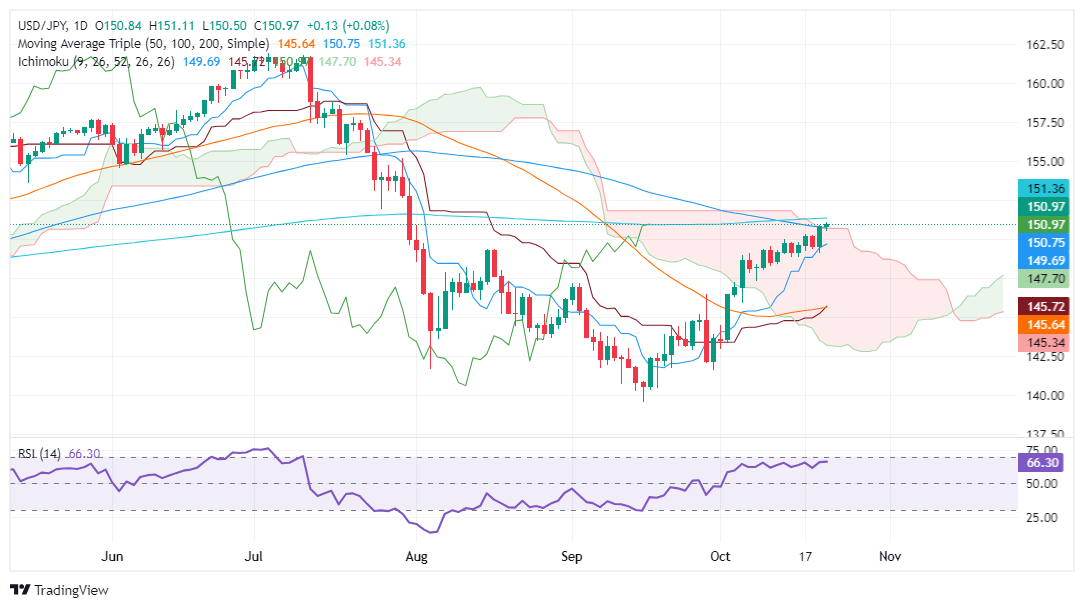
- USD/JPY flirts with the 151.00 level, driven by rising US Treasury yields but held back by key resistance at the top of the Ichimoku Cloud.
- Momentum remains bullish, with the RSI hitting a new high, suggesting further upside towards the 200-DMA at 151.36 and beyond.
- A break below 151.00 could see support at 149.68, with further downside risks targeting the October low at 149.09.
The US Dollar prints back-to-back gains against the Japanese Yen on Tuesday but struggles to clear the 151.00 figure decisively. At the time of writing, the USD/JPY trades at 150.92, as the US 10-year T-note yield keeps the pair contained at around current exchange rates.
USD/JPY Price Forecast: Technical outlook
The USD/JPY is testing key resistance at the top of the Ichimoku Cloud (Kumo) at around 150.80/95, with buyers eyeing the 200-day moving average (DMA) at 151.36.
From a momentum standpoint, buyers are in charge. The Relative Strength Index (RSI) is reaching a new higher high, signaling bulls are gathering steam.
A daily close above the 151.00 figure could sponsor a test of the 200-DMA at 151.36. On further strength, the pair could test the July 25 swing low turned resistance at 151.93 before cracking 152.00.
Conversely, if USD/JPY dives beneath 151.00, the first key support would be the Tenkan-Sen at 149.68, ahead of the October 21 low of 149.09.
USD/JPY Price Chart – Daily
Japanese Yen PRICE Today
The table below shows the percentage change of Japanese Yen (JPY) against listed major currencies today. Japanese Yen was the strongest against the British Pound.
| USD | EUR | GBP | JPY | CAD | AUD | NZD | CHF | |
|---|---|---|---|---|---|---|---|---|
| USD | 0.02% | 0.04% | 0.09% | -0.05% | -0.37% | -0.26% | -0.14% | |
| EUR | -0.02% | 0.03% | 0.08% | -0.07% | -0.41% | -0.27% | -0.16% | |
| GBP | -0.04% | -0.03% | 0.04% | -0.08% | -0.43% | -0.31% | -0.19% | |
| JPY | -0.09% | -0.08% | -0.04% | -0.13% | -0.47% | -0.37% | -0.23% | |
| CAD | 0.05% | 0.07% | 0.08% | 0.13% | -0.32% | -0.22% | -0.10% | |
| AUD | 0.37% | 0.41% | 0.43% | 0.47% | 0.32% | 0.11% | 0.24% | |
| NZD | 0.26% | 0.27% | 0.31% | 0.37% | 0.22% | -0.11% | 0.13% | |
| CHF | 0.14% | 0.16% | 0.19% | 0.23% | 0.10% | -0.24% | -0.13% |
The heat map shows percentage changes of major currencies against each other. The base currency is picked from the left column, while the quote currency is picked from the top row. For example, if you pick the Japanese Yen from the left column and move along the horizontal line to the US Dollar, the percentage change displayed in the box will represent JPY (base)/USD (quote).


© 2000-2026. All rights reserved.
This site is managed by Teletrade D.J. LLC 2351 LLC 2022 (Euro House, Richmond Hill Road, Kingstown, VC0100, St. Vincent and the Grenadines).
The information on this website is for informational purposes only and does not constitute any investment advice.
The company does not serve or provide services to customers who are residents of the US, Canada, Iran, The Democratic People's Republic of Korea, Yemen and FATF blacklisted countries.
Making transactions on financial markets with marginal financial instruments opens up wide possibilities and allows investors who are willing to take risks to earn high profits, carrying a potentially high risk of losses at the same time. Therefore you should responsibly approach the issue of choosing the appropriate investment strategy, taking the available resources into account, before starting trading.
Use of the information: full or partial use of materials from this website must always be referenced to TeleTrade as the source of information. Use of the materials on the Internet must be accompanied by a hyperlink to teletrade.org. Automatic import of materials and information from this website is prohibited.
Please contact our PR department if you have any questions or need assistance at pr@teletrade.global.
transfers