- Analytics
- News and Tools
- Market News
- USD/JPY Price Forecast: Hits12-week high at around 150.50
USD/JPY Price Forecast: Hits12-week high at around 150.50
- USD/JPY climbs to 150.52, its highest level in 12 weeks, as rising US bond yields fuel demand for the Dollar.
- Technical outlook remains bullish, with potential for further gains if the pair breaks through 150.78 and heads toward the 200-DMA at 151.34.
- A close below 150.00 could trigger a pullback, with key support levels at 149.27 and the 50-DMA at 145.55.
The USD/JPY climbed in the mid-North American session on Monday, up by 0.62%. The pair printed a 12-week peak of 150.52, as US Treasury bond yields rose as traders trimmed odds that the Federal Reserve would embark on an aggressive easing cycle. At the time of writing, the pair fluctuates at around 150.50
USD/JPY Price Forecast: Technical outlook
The USD/JPY began the week on the front foot and extended its gains past 150.00. Momentum remains bullish as depicted by the Relative Strength Index (RSI), which is at the brisk of clearing the latest higher peak.
If USD/JPY clears the 100-day moving average (DMA) confluence and the top of the Ichimoku Cloud (Kumo) at 150.78, this could sponsor a leg-up towards the 200-DMA at 151.34. If cleared, buyers would eye 152.00.
Conversely, a daily close below 150.00 would pave the way for a pullback, exposing the Tenkan-Sen at 149.27. Once surpassed, key support levels would be exposed, like 149.00, followed by the Senkou Span at 147.16, before testing the 50-DMA at 145.55.
USD/JPY Price Action – Daily Chart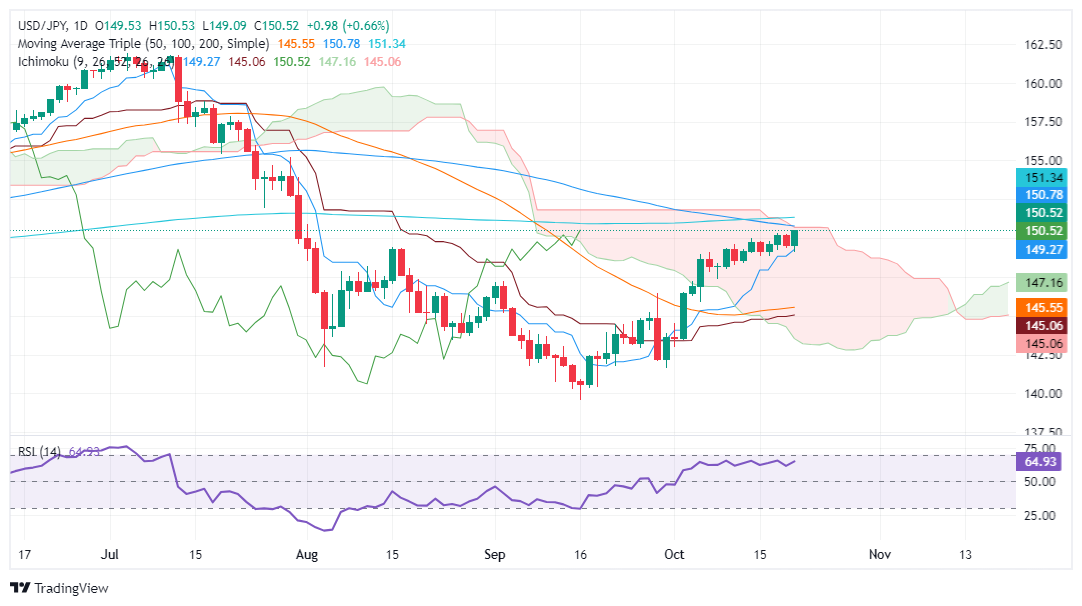
Japanese Yen PRICE Today
The table below shows the percentage change of Japanese Yen (JPY) against listed major currencies today. Japanese Yen was the strongest against the Australian Dollar.
| USD | EUR | GBP | JPY | CAD | AUD | NZD | CHF | |
|---|---|---|---|---|---|---|---|---|
| USD | 0.44% | 0.53% | 0.66% | 0.24% | 0.74% | 0.61% | 0.14% | |
| EUR | -0.44% | 0.01% | 0.15% | -0.15% | 0.26% | 0.06% | -0.38% | |
| GBP | -0.53% | -0.01% | 0.12% | -0.29% | 0.22% | 0.09% | -0.43% | |
| JPY | -0.66% | -0.15% | -0.12% | -0.43% | 0.07% | -0.01% | -0.57% | |
| CAD | -0.24% | 0.15% | 0.29% | 0.43% | 0.41% | 0.43% | -0.22% | |
| AUD | -0.74% | -0.26% | -0.22% | -0.07% | -0.41% | -0.05% | -0.66% | |
| NZD | -0.61% | -0.06% | -0.09% | 0.00% | -0.43% | 0.05% | -0.51% | |
| CHF | -0.14% | 0.38% | 0.43% | 0.57% | 0.22% | 0.66% | 0.51% |
The heat map shows percentage changes of major currencies against each other. The base currency is picked from the left column, while the quote currency is picked from the top row. For example, if you pick the Japanese Yen from the left column and move along the horizontal line to the US Dollar, the percentage change displayed in the box will represent JPY (base)/USD (quote).


© 2000-2026. All rights reserved.
This site is managed by Teletrade D.J. LLC 2351 LLC 2022 (Euro House, Richmond Hill Road, Kingstown, VC0100, St. Vincent and the Grenadines).
The information on this website is for informational purposes only and does not constitute any investment advice.
The company does not serve or provide services to customers who are residents of the US, Canada, Iran, The Democratic People's Republic of Korea, Yemen and FATF blacklisted countries.
Making transactions on financial markets with marginal financial instruments opens up wide possibilities and allows investors who are willing to take risks to earn high profits, carrying a potentially high risk of losses at the same time. Therefore you should responsibly approach the issue of choosing the appropriate investment strategy, taking the available resources into account, before starting trading.
Use of the information: full or partial use of materials from this website must always be referenced to TeleTrade as the source of information. Use of the materials on the Internet must be accompanied by a hyperlink to teletrade.org. Automatic import of materials and information from this website is prohibited.
Please contact our PR department if you have any questions or need assistance at pr@teletrade.global.
transfers