- Analytics
- News and Tools
- Market News
- GBP/USD Price Forecast: Tumbles to two-month low below 1.3000 on soft UK CPI
GBP/USD Price Forecast: Tumbles to two-month low below 1.3000 on soft UK CPI
- GBP/USD drops 0.34%, reaching a low of 1.2981 after soft UK inflation report shocks markets.
- A close below 1.3000 could lead the pair to test the 100-DMA at 1.2951 and further support levels.
- If bulls regain control, resistance at 1.3100 and the 50-DMA at 1.3118 are key upside targets.
The Pound Sterling dived following a softer-than-expected UK inflation report, which dragged the GBP/USD exchange rate to a two-month low of 1.2981. Although it has recovered some ground, the pair is losing 0.49% and trades at 1.3008 at the time of writing.
GBP/USD Price Forecast: Technical outlook
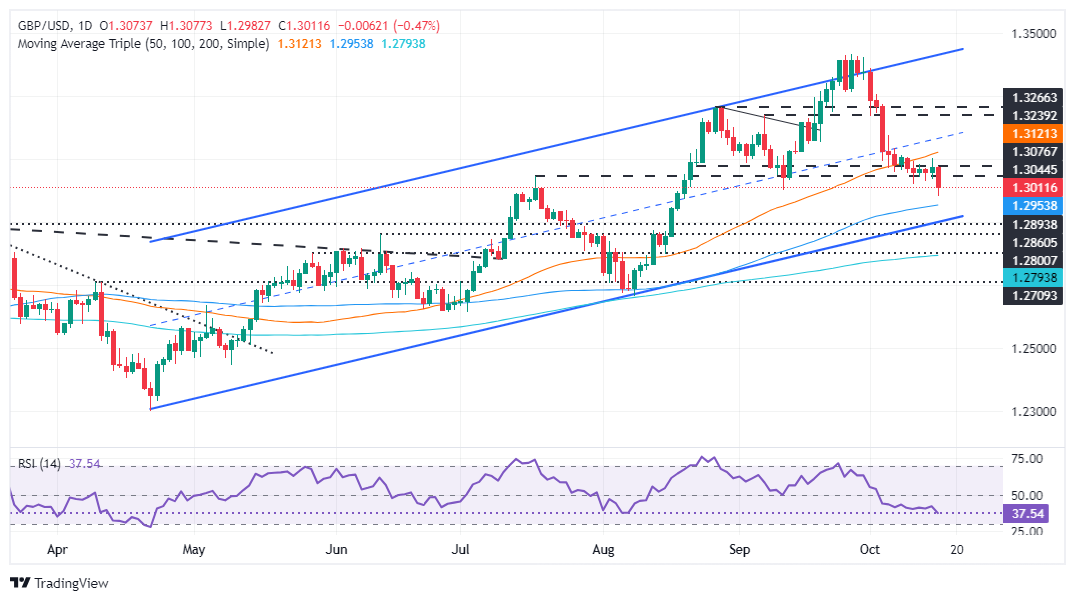
After clearing the October 14 swing low of 1.3029, the GBP/USD accelerated its fall beneath 1.3000, which could pave the way for further downside.
Momentum supports sellers, as depicted by the Relative Strength Index (RSI), which broke the last trough, indicating the downtrend is accelerating.
If GBP/USD achieves a daily close below 1.3000, this could potentially send the pair to challenge the 100-day moving average (DMA) at 1.2951. On further weakness, the next stop would be the March 8 high turned support at 1.2894. If surpassed, the pair might extend its losses to the 200-DMA at 1.2793.
However, if buyers push the exchange rate past today’s high at 1.3076, and a move to 1.3100 is on the cards. Once cleared, the 50-DMA would be the next resistance level at 1.3118.
GBP/USD Price – Daily Chart
British Pound PRICE Today
The table below shows the percentage change of British Pound (GBP) against listed major currencies today. British Pound was the strongest against the Australian Dollar.
| USD | EUR | GBP | JPY | CAD | AUD | NZD | CHF | |
|---|---|---|---|---|---|---|---|---|
| USD | 0.13% | 0.50% | 0.31% | 0.02% | 0.57% | 0.34% | 0.29% | |
| EUR | -0.13% | 0.39% | 0.20% | -0.08% | 0.45% | 0.24% | 0.10% | |
| GBP | -0.50% | -0.39% | -0.21% | -0.47% | 0.06% | -0.15% | -0.23% | |
| JPY | -0.31% | -0.20% | 0.21% | -0.25% | 0.28% | 0.05% | 0.01% | |
| CAD | -0.02% | 0.08% | 0.47% | 0.25% | 0.53% | 0.31% | 0.24% | |
| AUD | -0.57% | -0.45% | -0.06% | -0.28% | -0.53% | -0.21% | -0.28% | |
| NZD | -0.34% | -0.24% | 0.15% | -0.05% | -0.31% | 0.21% | -0.08% | |
| CHF | -0.29% | -0.10% | 0.23% | -0.01% | -0.24% | 0.28% | 0.08% |
The heat map shows percentage changes of major currencies against each other. The base currency is picked from the left column, while the quote currency is picked from the top row. For example, if you pick the British Pound from the left column and move along the horizontal line to the US Dollar, the percentage change displayed in the box will represent GBP (base)/USD (quote).


© 2000-2026. All rights reserved.
This site is managed by Teletrade D.J. LLC 2351 LLC 2022 (Euro House, Richmond Hill Road, Kingstown, VC0100, St. Vincent and the Grenadines).
The information on this website is for informational purposes only and does not constitute any investment advice.
The company does not serve or provide services to customers who are residents of the US, Canada, Iran, The Democratic People's Republic of Korea, Yemen and FATF blacklisted countries.
Making transactions on financial markets with marginal financial instruments opens up wide possibilities and allows investors who are willing to take risks to earn high profits, carrying a potentially high risk of losses at the same time. Therefore you should responsibly approach the issue of choosing the appropriate investment strategy, taking the available resources into account, before starting trading.
Use of the information: full or partial use of materials from this website must always be referenced to TeleTrade as the source of information. Use of the materials on the Internet must be accompanied by a hyperlink to teletrade.org. Automatic import of materials and information from this website is prohibited.
Please contact our PR department if you have any questions or need assistance at pr@teletrade.global.
transfers