- Analytics
- News and Tools
- Market News
- USD/CAD Price Forecast: Moves above 1.3800 ahead of upper boundary of ascending channel
USD/CAD Price Forecast: Moves above 1.3800 ahead of upper boundary of ascending channel
- The USD/CAD pair may find the barrier around the upper boundary of the ascending channel at the 1.3870 level.
- The 14-day RSI signals an overbought condition, suggesting that a potential downward correction could be on the horizon.
- Potential support appears at the lower boundary of the ascending channel around the 1.3770 level.
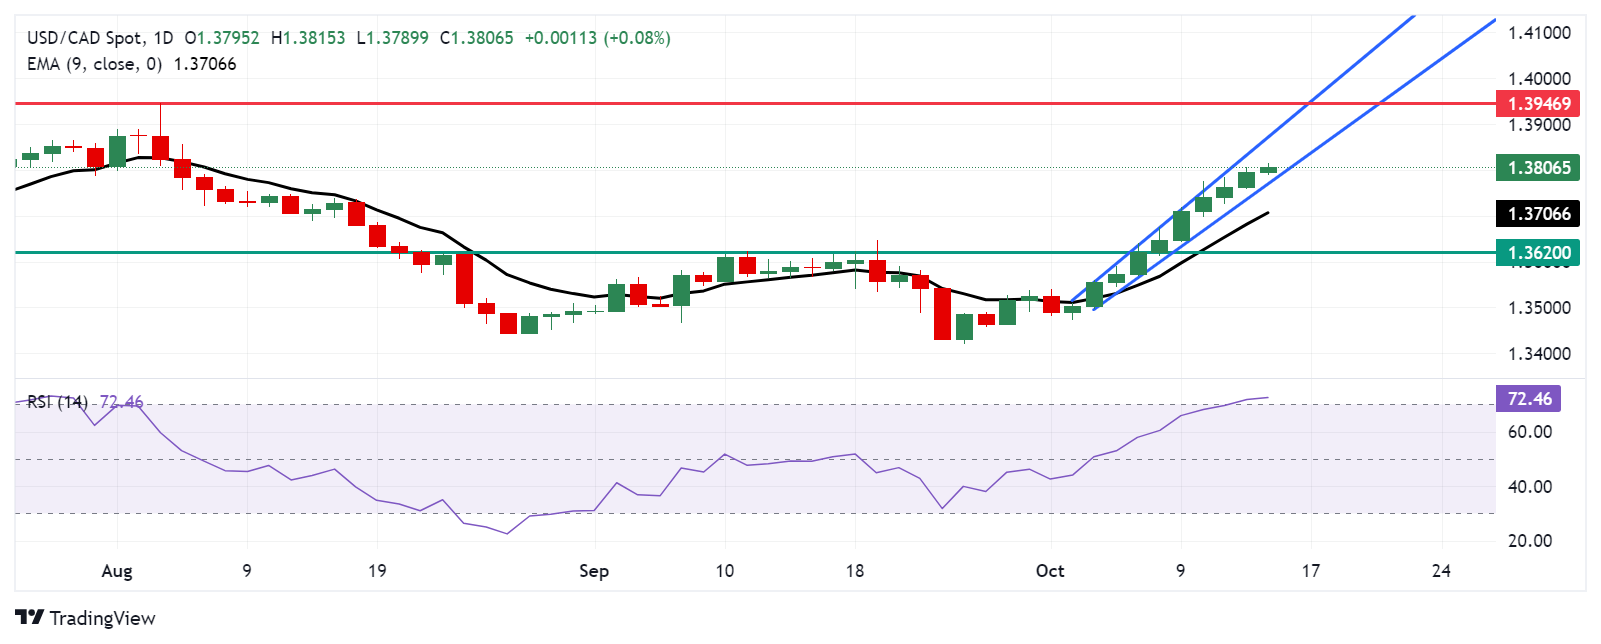
USD/CAD continues its upward momentum, extending the rally that began on October 2, trading near 1.3810 during early European hours on Tuesday. The daily chart shows the pair is trending higher within an ascending channel, reinforcing a bullish outlook.
However, the 14-day Relative Strength Index (RSI) is above 70, signaling overbought conditions and suggesting a possible downward correction in the near future.
On the upside, USD/CAD could test the upper boundary of the ascending channel near the 1.3870 level. A break above this point may further boost bullish sentiment, potentially driving the pair toward 1.3946, the highest level since October 2022.
In terms of the downside, USD/CAD may find initial support at the lower boundary of the ascending channel, near the 1.3770 level. A break below this could dampen the bullish sentiment, potentially pushing the pair toward its nine-day Exponential Moving Average (EMA) at 1.3706.
Additional support is seen at the former pullback resistance, now acting as throwback support, around the 1.3620 level, followed by the psychological threshold of 1.3600.
USD/CAD: Daily Chart
Canadian Dollar PRICE Today
The table below shows the percentage change of Canadian Dollar (CAD) against listed major currencies today. Canadian Dollar was the weakest against the Japanese Yen.
| USD | EUR | GBP | JPY | CAD | AUD | NZD | CHF | |
|---|---|---|---|---|---|---|---|---|
| USD | 0.03% | -0.13% | -0.46% | 0.08% | 0.23% | 0.21% | -0.16% | |
| EUR | -0.03% | -0.15% | -0.50% | 0.04% | 0.22% | 0.17% | -0.18% | |
| GBP | 0.13% | 0.15% | -0.35% | 0.20% | 0.37% | 0.32% | 0.02% | |
| JPY | 0.46% | 0.50% | 0.35% | 0.55% | 0.69% | 0.66% | 0.34% | |
| CAD | -0.08% | -0.04% | -0.20% | -0.55% | 0.14% | 0.13% | -0.19% | |
| AUD | -0.23% | -0.22% | -0.37% | -0.69% | -0.14% | -0.04% | -0.36% | |
| NZD | -0.21% | -0.17% | -0.32% | -0.66% | -0.13% | 0.04% | -0.31% | |
| CHF | 0.16% | 0.18% | -0.02% | -0.34% | 0.19% | 0.36% | 0.31% |
The heat map shows percentage changes of major currencies against each other. The base currency is picked from the left column, while the quote currency is picked from the top row. For example, if you pick the Canadian Dollar from the left column and move along the horizontal line to the US Dollar, the percentage change displayed in the box will represent CAD (base)/USD (quote).


© 2000-2026. All rights reserved.
This site is managed by Teletrade D.J. LLC 2351 LLC 2022 (Euro House, Richmond Hill Road, Kingstown, VC0100, St. Vincent and the Grenadines).
The information on this website is for informational purposes only and does not constitute any investment advice.
The company does not serve or provide services to customers who are residents of the US, Canada, Iran, The Democratic People's Republic of Korea, Yemen and FATF blacklisted countries.
Making transactions on financial markets with marginal financial instruments opens up wide possibilities and allows investors who are willing to take risks to earn high profits, carrying a potentially high risk of losses at the same time. Therefore you should responsibly approach the issue of choosing the appropriate investment strategy, taking the available resources into account, before starting trading.
Use of the information: full or partial use of materials from this website must always be referenced to TeleTrade as the source of information. Use of the materials on the Internet must be accompanied by a hyperlink to teletrade.org. Automatic import of materials and information from this website is prohibited.
Please contact our PR department if you have any questions or need assistance at pr@teletrade.global.
transfers