- Analytics
- News and Tools
- Market News
- USD/JPY Price Forecast: Climbs above 147.00 as bulls target Kumo
USD/JPY Price Forecast: Climbs above 147.00 as bulls target Kumo
- USD/JPY rises above 147 for the first time since September, driven by escalating Middle East tensions.
- Bullish RSI signals further upside potential, with buyers eyeing resistance at 147.25, followed by 147.78 and 148.00.
- A reversal could see USD/JPY testing support at the 50-DMA of 145.38, with further downside risk at 145.00 and 143.93.
The USD/JPY edges higher on Thursday, climbs above 147.00 for the first time since September, trades at 146.92 and gains 0.31% at the time of writing. The financial markets narrative hasn’t changed, as traders hear war drums beating, as the Middle East conflict escalates, triggering a flow to haven currencies, boosting the Greenback.
USD/JPY Price Forecast: Technical outlook
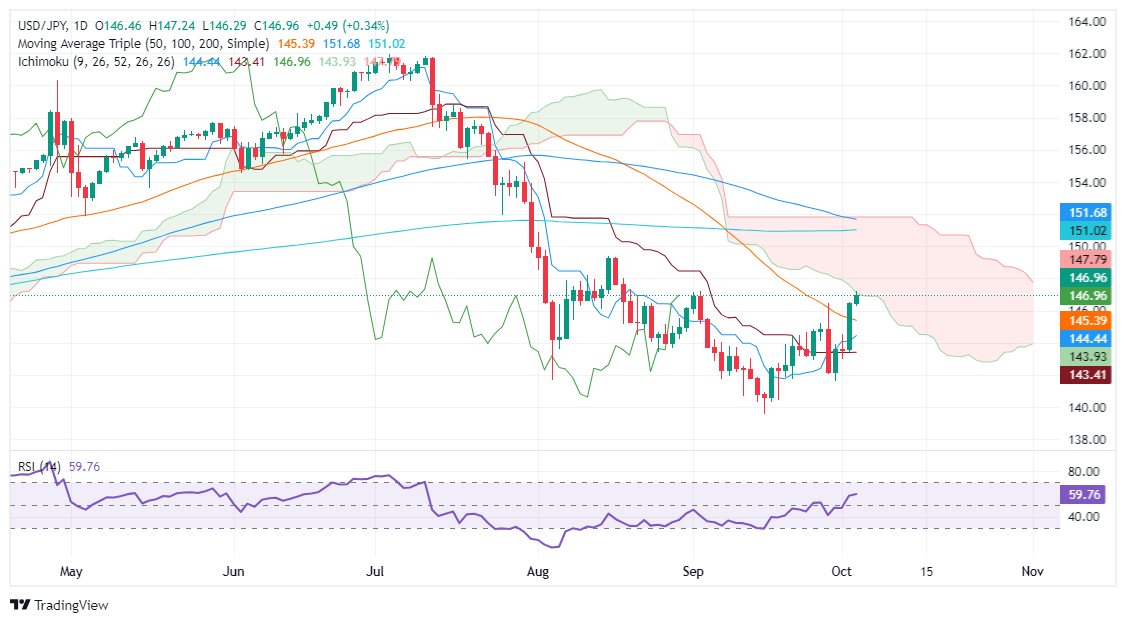
The USD/JPY daily chart is neutral to downward biased, as buyers tested the bottom of the Ichimoku Cloud (Kumo) at 147.25. Momentum hints that buyers remain in charge, and might push prices higher.
The Relative Strength Index (RSI) is bullish, aiming to the upside. This means, the USD/JPY is tilted to the upside, in the near-term.
The USD/JPY must clear the top of the Kumo at 147.25. In that outcome, the next resistance would be the Senkou Span B at 147.78, followed by 148.00. If those levels are cleared, the 200-day moving average (DMA) would be next at 151.02.
Conversely, if the pair reverses its course, the first support would be the 50-DMA at 145.38. Once surpassed, the next stop would be the 145.00 figure, followed by the Senkou Span A at 143.93.
USD/JPY Price Action – Daily Chart
Japanese Yen PRICE Today
The table below shows the percentage change of Japanese Yen (JPY) against listed major currencies today. Japanese Yen was the strongest against the British Pound.
| USD | EUR | GBP | JPY | CAD | AUD | NZD | CHF | |
|---|---|---|---|---|---|---|---|---|
| USD | 0.14% | 1.10% | 0.34% | 0.40% | 0.65% | 0.83% | 0.37% | |
| EUR | -0.14% | 0.97% | 0.19% | 0.24% | 0.51% | 0.67% | 0.23% | |
| GBP | -1.10% | -0.97% | -0.75% | -0.72% | -0.45% | -0.29% | -0.71% | |
| JPY | -0.34% | -0.19% | 0.75% | 0.07% | 0.31% | 0.46% | 0.03% | |
| CAD | -0.40% | -0.24% | 0.72% | -0.07% | 0.25% | 0.43% | -0.02% | |
| AUD | -0.65% | -0.51% | 0.45% | -0.31% | -0.25% | 0.16% | -0.26% | |
| NZD | -0.83% | -0.67% | 0.29% | -0.46% | -0.43% | -0.16% | -0.43% | |
| CHF | -0.37% | -0.23% | 0.71% | -0.03% | 0.02% | 0.26% | 0.43% |
The heat map shows percentage changes of major currencies against each other. The base currency is picked from the left column, while the quote currency is picked from the top row. For example, if you pick the Japanese Yen from the left column and move along the horizontal line to the US Dollar, the percentage change displayed in the box will represent JPY (base)/USD (quote).


© 2000-2026. All rights reserved.
This site is managed by Teletrade D.J. LLC 2351 LLC 2022 (Euro House, Richmond Hill Road, Kingstown, VC0100, St. Vincent and the Grenadines).
The information on this website is for informational purposes only and does not constitute any investment advice.
The company does not serve or provide services to customers who are residents of the US, Canada, Iran, The Democratic People's Republic of Korea, Yemen and FATF blacklisted countries.
Making transactions on financial markets with marginal financial instruments opens up wide possibilities and allows investors who are willing to take risks to earn high profits, carrying a potentially high risk of losses at the same time. Therefore you should responsibly approach the issue of choosing the appropriate investment strategy, taking the available resources into account, before starting trading.
Use of the information: full or partial use of materials from this website must always be referenced to TeleTrade as the source of information. Use of the materials on the Internet must be accompanied by a hyperlink to teletrade.org. Automatic import of materials and information from this website is prohibited.
Please contact our PR department if you have any questions or need assistance at pr@teletrade.global.
transfers