- Analytics
- News and Tools
- Market News
- EUR/JPY Price Forecast: Rallies to three-week peak, closes on 162.00
EUR/JPY Price Forecast: Rallies to three-week peak, closes on 162.00
- EUR/JPY rises to 161.79 after surpassing the 50-DMA, marking its third consecutive day of gains.
- Momentum shows signs of consolidation ahead, with resistance at 162.45/65 and the 200-DMA at 164.10.
- A break below 160.74 could expose the pair to support at 158.99/98, near the Tenkan Sen level.
The EUR/JPY printed solid gains of over 0.40% on Thursday, extending its rally to three consecutive days. Data from the United States (US) improved risk appetite and consequently weighed on the Japanese Yen due to its safe-haven status. At the time of writing, the cross-pair trades at 161.79.
EUR/JPY Price Forecast: Technical outlook
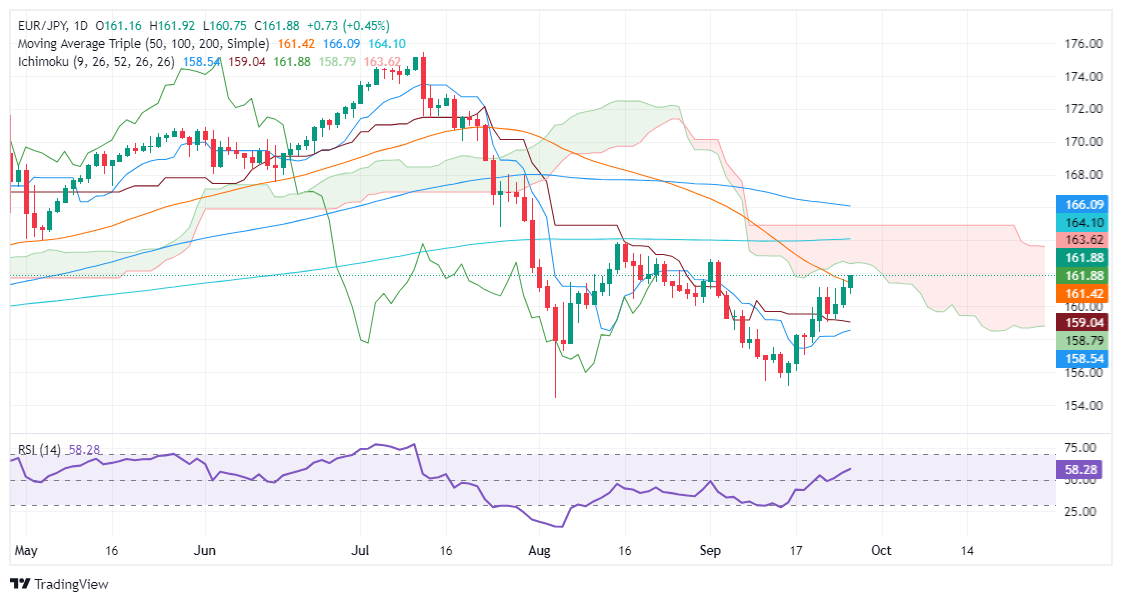
The EUR/JPY uptrend remains intact, although the pair aimed higher to the bottom of the Ichimoku Cloud (Kumo) after surpassing the 50-day moving average (DMA) at 161.19.
Momentum hints that buyers are losing some steam, as depicted by the Relative Strength Index (RSI) slope turning flat, meaning the consolidation lies ahead.
If EUR/JPY clears the bottom of the Kumo at around 162.45/65, the next resistance level would be the Senkou Span B at 163.13, followed by the 200-day moving average (DMA) at 164.10.
Conversely, if EUR/JPY dives below the September 26 low of 160.74, the next support would be the confluence of the September 24 daily low of and the Tenkan Sen at around 158.99/98
EUR/JPY Price Action – Daily Chart
Euro PRICE Today
The table below shows the percentage change of Euro (EUR) against listed major currencies today. Euro was the strongest against the Australian Dollar.
| USD | EUR | GBP | JPY | CAD | AUD | NZD | CHF | |
|---|---|---|---|---|---|---|---|---|
| USD | 0.00% | 0.00% | 0.01% | 0.01% | 0.03% | -0.00% | -0.04% | |
| EUR | -0.00% | -0.01% | 0.00% | -0.03% | 0.03% | -0.02% | -0.04% | |
| GBP | -0.00% | 0.01% | 0.02% | -0.01% | 0.04% | 0.00% | -0.03% | |
| JPY | -0.01% | 0.00% | -0.02% | -0.01% | 0.04% | -0.01% | -0.01% | |
| CAD | -0.01% | 0.03% | 0.00% | 0.00% | 0.00% | 0.00% | -0.04% | |
| AUD | -0.03% | -0.03% | -0.04% | -0.04% | -0.01% | -0.02% | -0.05% | |
| NZD | 0.00% | 0.02% | -0.01% | 0.01% | -0.00% | 0.02% | -0.04% | |
| CHF | 0.04% | 0.04% | 0.03% | 0.01% | 0.04% | 0.05% | 0.04% |
The heat map shows percentage changes of major currencies against each other. The base currency is picked from the left column, while the quote currency is picked from the top row. For example, if you pick the Euro from the left column and move along the horizontal line to the US Dollar, the percentage change displayed in the box will represent EUR (base)/USD (quote).


© 2000-2026. All rights reserved.
This site is managed by Teletrade D.J. LLC 2351 LLC 2022 (Euro House, Richmond Hill Road, Kingstown, VC0100, St. Vincent and the Grenadines).
The information on this website is for informational purposes only and does not constitute any investment advice.
The company does not serve or provide services to customers who are residents of the US, Canada, Iran, The Democratic People's Republic of Korea, Yemen and FATF blacklisted countries.
Making transactions on financial markets with marginal financial instruments opens up wide possibilities and allows investors who are willing to take risks to earn high profits, carrying a potentially high risk of losses at the same time. Therefore you should responsibly approach the issue of choosing the appropriate investment strategy, taking the available resources into account, before starting trading.
Use of the information: full or partial use of materials from this website must always be referenced to TeleTrade as the source of information. Use of the materials on the Internet must be accompanied by a hyperlink to teletrade.org. Automatic import of materials and information from this website is prohibited.
Please contact our PR department if you have any questions or need assistance at pr@teletrade.global.
transfers