- Analytics
- News and Tools
- Market News
- USD/JPY Price Forecast: Fails to clear 145.00, forms ‘doji’ pattern
USD/JPY Price Forecast: Fails to clear 145.00, forms ‘doji’ pattern
- USD/JPY trades flat at 144.72 after hitting a three-week high of 145.21, as election uncertainty dampens momentum.
- Doji candlestick and flat RSI suggest market indecision, with key resistance at the 50-DMA of 146.49.
- A break below 144.11 could lead to further declines, testing support levels at 143.39 and 142.39.
The USD/JPY remains subdued after seesawing within a 110-pip range, where the pair hit a three-week high of 145.21. Uncertainty around the Japanese election has overshadowed speeches by Bank of Japan (BoJ) officials, who decided to hold rates unchanged last week. At the time of writing, the major trades at 144.72, flat.
USD/JPY Price Forecast: Technical outlook
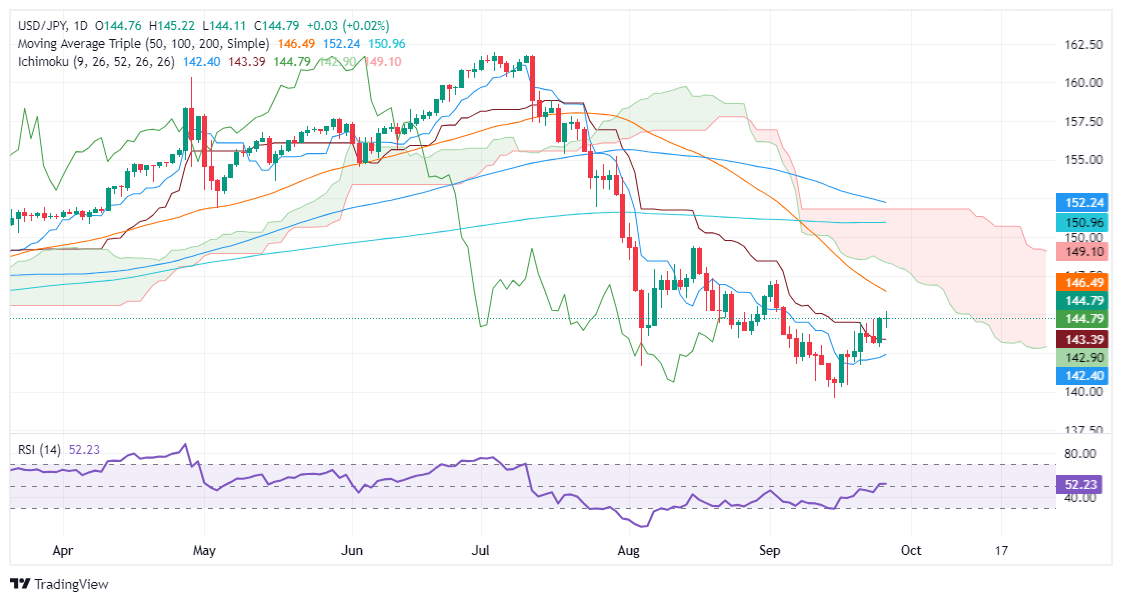
From a technical standpoint, the downtrend is set to continue. Thursday’s price action forms a ‘doji’, meaning neither buyers nor sellers commit to solid positions. Even the Relative Strength Index (RSI), despite showing bulls in charge, the RSI slope is flat at 51.
If USD/JPY buyers push prices above the September 26 high at 145.21, that could prompt a challenge of the 50-day moving average (DMA) at 146.49 before testing the 147.00 mark. The next resistance would be the bottom of the Ichimoku Cloud (Kumo) at around 148.20-50.
Conversely, if the pair slumps below the September 26 low of 144.11, that will test the Kijun-Sen at 143.39, followed by the Senkou Span A at 142.89. On further weakness, the Tenkan-Sen will be the Bulls' last line of defense at 142.39.
USD/JPY Price Action – Daily Chart
Japanese Yen PRICE Today
The table below shows the percentage change of Japanese Yen (JPY) against listed major currencies today. Japanese Yen was the strongest against the US Dollar.
| USD | EUR | GBP | JPY | CAD | AUD | NZD | CHF | |
|---|---|---|---|---|---|---|---|---|
| USD | -0.38% | -0.65% | 0.01% | -0.06% | -1.00% | -1.00% | -0.51% | |
| EUR | 0.38% | -0.28% | 0.39% | 0.32% | -0.62% | -0.62% | -0.13% | |
| GBP | 0.65% | 0.28% | 0.66% | 0.60% | -0.34% | -0.36% | 0.15% | |
| JPY | -0.01% | -0.39% | -0.66% | -0.06% | -1.02% | -1.02% | -0.53% | |
| CAD | 0.06% | -0.32% | -0.60% | 0.06% | -0.93% | -0.94% | -0.44% | |
| AUD | 1.00% | 0.62% | 0.34% | 1.02% | 0.93% | 0.00% | 0.50% | |
| NZD | 1.00% | 0.62% | 0.36% | 1.02% | 0.94% | -0.00% | 0.50% | |
| CHF | 0.51% | 0.13% | -0.15% | 0.53% | 0.44% | -0.50% | -0.50% |
The heat map shows percentage changes of major currencies against each other. The base currency is picked from the left column, while the quote currency is picked from the top row. For example, if you pick the Japanese Yen from the left column and move along the horizontal line to the US Dollar, the percentage change displayed in the box will represent JPY (base)/USD (quote).


© 2000-2026. All rights reserved.
This site is managed by Teletrade D.J. LLC 2351 LLC 2022 (Euro House, Richmond Hill Road, Kingstown, VC0100, St. Vincent and the Grenadines).
The information on this website is for informational purposes only and does not constitute any investment advice.
The company does not serve or provide services to customers who are residents of the US, Canada, Iran, The Democratic People's Republic of Korea, Yemen and FATF blacklisted countries.
Making transactions on financial markets with marginal financial instruments opens up wide possibilities and allows investors who are willing to take risks to earn high profits, carrying a potentially high risk of losses at the same time. Therefore you should responsibly approach the issue of choosing the appropriate investment strategy, taking the available resources into account, before starting trading.
Use of the information: full or partial use of materials from this website must always be referenced to TeleTrade as the source of information. Use of the materials on the Internet must be accompanied by a hyperlink to teletrade.org. Automatic import of materials and information from this website is prohibited.
Please contact our PR department if you have any questions or need assistance at pr@teletrade.global.
transfers