- Analytics
- News and Tools
- Market News
- NZD/USD Price Forecast: Holds ground above 0.6250, lower boundary of the ascending channel
NZD/USD Price Forecast: Holds ground above 0.6250, lower boundary of the ascending channel
- NZD/USD gains ground as it maintains its position within an ascending channel pattern.
- The 14-day RSI remains above the 50 level, supporting the notion of an ongoing uptrend.
- A break below the ascending channel would weaken the ongoing bullish bias.
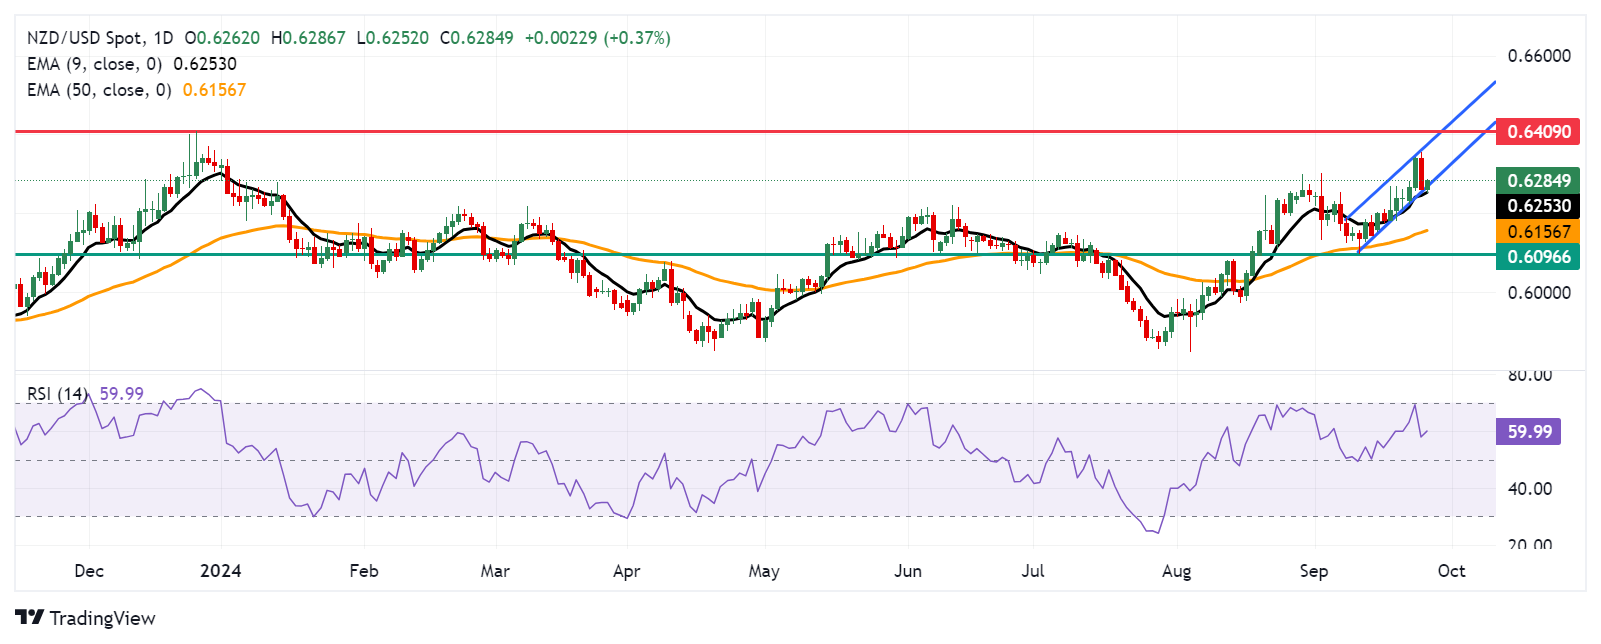
NZD/USD recovers its recent losses from the previous session, trading around 0.6280 during the early European hours on Thursday. On the daily chart, the pair is testing the lower boundary of the ascending channel pattern. A successful breach below the ascending channel would weaken the ongoing bullish bias.
However, the 14-day Relative Strength Index (RSI) remains above the 50 level, confirming the ongoing bullish trend is intact. Additionally, the nine-day Exponential Moving Average (EMA) is positioned above the 50-day EMA, suggesting the short-term price trend is stronger for the NZD/USD pair.
On the upside, the NZD/USD pair may explore the region around the upper boundary of the ascending channel at the 0.6380 level. A breakthrough above the upper boundary could strengthen bullish bias and support the pair to revisit the 15-month high of 0.6409 level, recorded in December 2023.
In terms of support, the NZD/USD pair may test the immediate nine-day Exponential Moving Average (EMA) at the 0.6251 level. A break below this level could weaken the bullish sentiment and put pressure on the pair to approach the 50-day EMA at 0.6156 level, followed by its five-week low of 0.6106 level.
NZD/USD: Daily Chart
New Zealand Dollar PRICE Today
The table below shows the percentage change of New Zealand Dollar (NZD) against listed major currencies today. New Zealand Dollar was the strongest against the Swiss Franc.
| USD | EUR | GBP | JPY | CAD | AUD | NZD | CHF | |
|---|---|---|---|---|---|---|---|---|
| USD | -0.22% | -0.23% | 0.00% | -0.16% | -0.65% | -0.40% | 0.05% | |
| EUR | 0.22% | -0.02% | 0.23% | 0.06% | -0.43% | -0.18% | 0.27% | |
| GBP | 0.23% | 0.02% | 0.19% | 0.08% | -0.41% | -0.18% | 0.27% | |
| JPY | 0.00% | -0.23% | -0.19% | -0.14% | -0.66% | -0.42% | 0.02% | |
| CAD | 0.16% | -0.06% | -0.08% | 0.14% | -0.48% | -0.24% | 0.19% | |
| AUD | 0.65% | 0.43% | 0.41% | 0.66% | 0.48% | 0.26% | 0.68% | |
| NZD | 0.40% | 0.18% | 0.18% | 0.42% | 0.24% | -0.26% | 0.43% | |
| CHF | -0.05% | -0.27% | -0.27% | -0.02% | -0.19% | -0.68% | -0.43% |
The heat map shows percentage changes of major currencies against each other. The base currency is picked from the left column, while the quote currency is picked from the top row. For example, if you pick the New Zealand Dollar from the left column and move along the horizontal line to the US Dollar, the percentage change displayed in the box will represent NZD (base)/USD (quote).


© 2000-2026. All rights reserved.
This site is managed by Teletrade D.J. LLC 2351 LLC 2022 (Euro House, Richmond Hill Road, Kingstown, VC0100, St. Vincent and the Grenadines).
The information on this website is for informational purposes only and does not constitute any investment advice.
The company does not serve or provide services to customers who are residents of the US, Canada, Iran, The Democratic People's Republic of Korea, Yemen and FATF blacklisted countries.
Making transactions on financial markets with marginal financial instruments opens up wide possibilities and allows investors who are willing to take risks to earn high profits, carrying a potentially high risk of losses at the same time. Therefore you should responsibly approach the issue of choosing the appropriate investment strategy, taking the available resources into account, before starting trading.
Use of the information: full or partial use of materials from this website must always be referenced to TeleTrade as the source of information. Use of the materials on the Internet must be accompanied by a hyperlink to teletrade.org. Automatic import of materials and information from this website is prohibited.
Please contact our PR department if you have any questions or need assistance at pr@teletrade.global.
transfers