- Analytics
- News and Tools
- Market News
- NZD/USD Price Forecast: Holds position above 0.6200 near support at 14-day EMA
NZD/USD Price Forecast: Holds position above 0.6200 near support at 14-day EMA
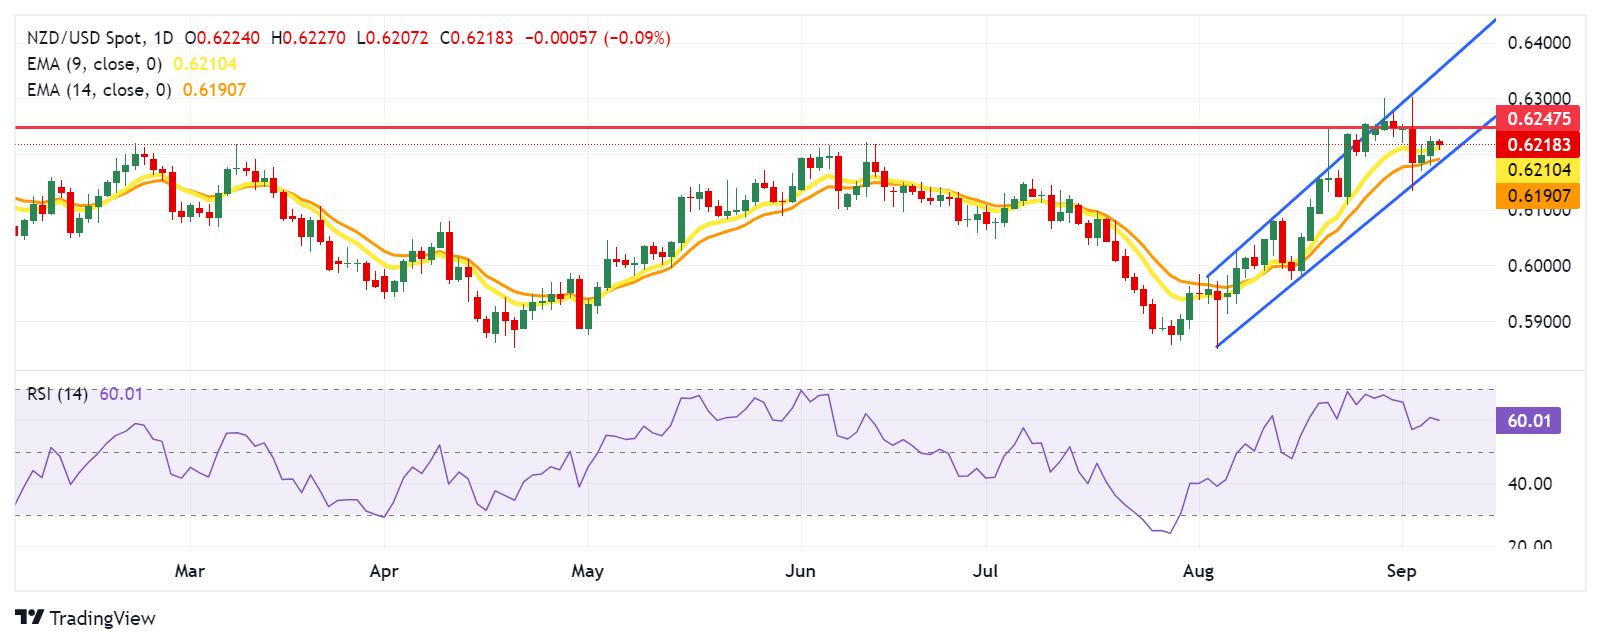
- NZD/USD could test the nine-day EMA at 0.6210, followed by the seven-month high of 0.6247.
- The 14-day RSI remains above the 50 level, confirming a persistent bullish trend.
- The immediate support appears around the psychological level of 0.6200, aligned with the 14-day EMA at 0.6190.
NZD/USD retraces its recent gains, trading around 0.6210 during the Asian hours on Friday. On the daily chart, the pair treks above the lower boundary of the ascending channel, which supports a bullish outlook. A move below the lower boundary could weaken the bullish sentiment.
The 14-day Relative Strength Index (RSI) remains above the 50 level, signaling a persistent bullish trend. Furthermore, the nine-day Exponential Moving Average (EMA) is above the 14-day EMA, indicating that the NZD/USD pair is experiencing short-term upward momentum and is expected to continue its rise.
On the upside, the NZD/USD pair faces immediate resistance near the nine-day EMA at 0.6210, with further resistance at the seven-month high of 0.6247 recorded on August 21. A break above this level could drive the pair toward the upper boundary of the ascending channel, around 0.6350.
For support, the NZD/USD pair may test the 14-day EMA at the 0.6190 level, which aligns with the lower boundary of the ascending channel. A drop below this level could diminish the bullish bias and drive the pair toward the psychological level of 0.6100.
NZD/USD: Daily Chart
New Zealand Dollar PRICE Today
The table below shows the percentage change of New Zealand Dollar (NZD) against listed major currencies today. New Zealand Dollar was the weakest against the Japanese Yen.
| USD | EUR | GBP | JPY | CAD | AUD | NZD | CHF | |
|---|---|---|---|---|---|---|---|---|
| USD | -0.05% | 0.02% | -0.80% | -0.06% | 0.15% | 0.09% | -0.27% | |
| EUR | 0.05% | 0.07% | -0.76% | -0.03% | 0.20% | 0.13% | -0.22% | |
| GBP | -0.02% | -0.07% | -0.81% | -0.08% | 0.14% | 0.07% | -0.29% | |
| JPY | 0.80% | 0.76% | 0.81% | 0.75% | 0.96% | 0.87% | 0.52% | |
| CAD | 0.06% | 0.03% | 0.08% | -0.75% | 0.20% | 0.16% | -0.21% | |
| AUD | -0.15% | -0.20% | -0.14% | -0.96% | -0.20% | -0.07% | -0.44% | |
| NZD | -0.09% | -0.13% | -0.07% | -0.87% | -0.16% | 0.07% | -0.36% | |
| CHF | 0.27% | 0.22% | 0.29% | -0.52% | 0.21% | 0.44% | 0.36% |
The heat map shows percentage changes of major currencies against each other. The base currency is picked from the left column, while the quote currency is picked from the top row. For example, if you pick the New Zealand Dollar from the left column and move along the horizontal line to the US Dollar, the percentage change displayed in the box will represent NZD (base)/USD (quote).


© 2000-2026. All rights reserved.
This site is managed by Teletrade D.J. LLC 2351 LLC 2022 (Euro House, Richmond Hill Road, Kingstown, VC0100, St. Vincent and the Grenadines).
The information on this website is for informational purposes only and does not constitute any investment advice.
The company does not serve or provide services to customers who are residents of the US, Canada, Iran, The Democratic People's Republic of Korea, Yemen and FATF blacklisted countries.
Making transactions on financial markets with marginal financial instruments opens up wide possibilities and allows investors who are willing to take risks to earn high profits, carrying a potentially high risk of losses at the same time. Therefore you should responsibly approach the issue of choosing the appropriate investment strategy, taking the available resources into account, before starting trading.
Use of the information: full or partial use of materials from this website must always be referenced to TeleTrade as the source of information. Use of the materials on the Internet must be accompanied by a hyperlink to teletrade.org. Automatic import of materials and information from this website is prohibited.
Please contact our PR department if you have any questions or need assistance at pr@teletrade.global.
transfers