- Analytics
- News and Tools
- Market News
- US Dollar Index Price Forecast: Finds floor at long-term historical support level
US Dollar Index Price Forecast: Finds floor at long-term historical support level
- The US Dollar Index has touched down on a key support level at the 100 mark.
- This has historically provided a springboard for a recovery, however, it is too early to say whether history will repeat itself.
The US Dollar Index (DXY) is in a medium and long-term sideways trend within a multi-year range. Since late July it has been steadily unfolding a down leg within that range from the ceiling at around 105, to the range floor at the 100 level.
100 is important. Apart from being a key psychological level, 100 is also a major historical support level which has provided a safety net to falling prices on three prior occasions since 2023 (circled below). The question is, will 100 come to the rescue again on this occasion?
US Dollar Index Daily Chart
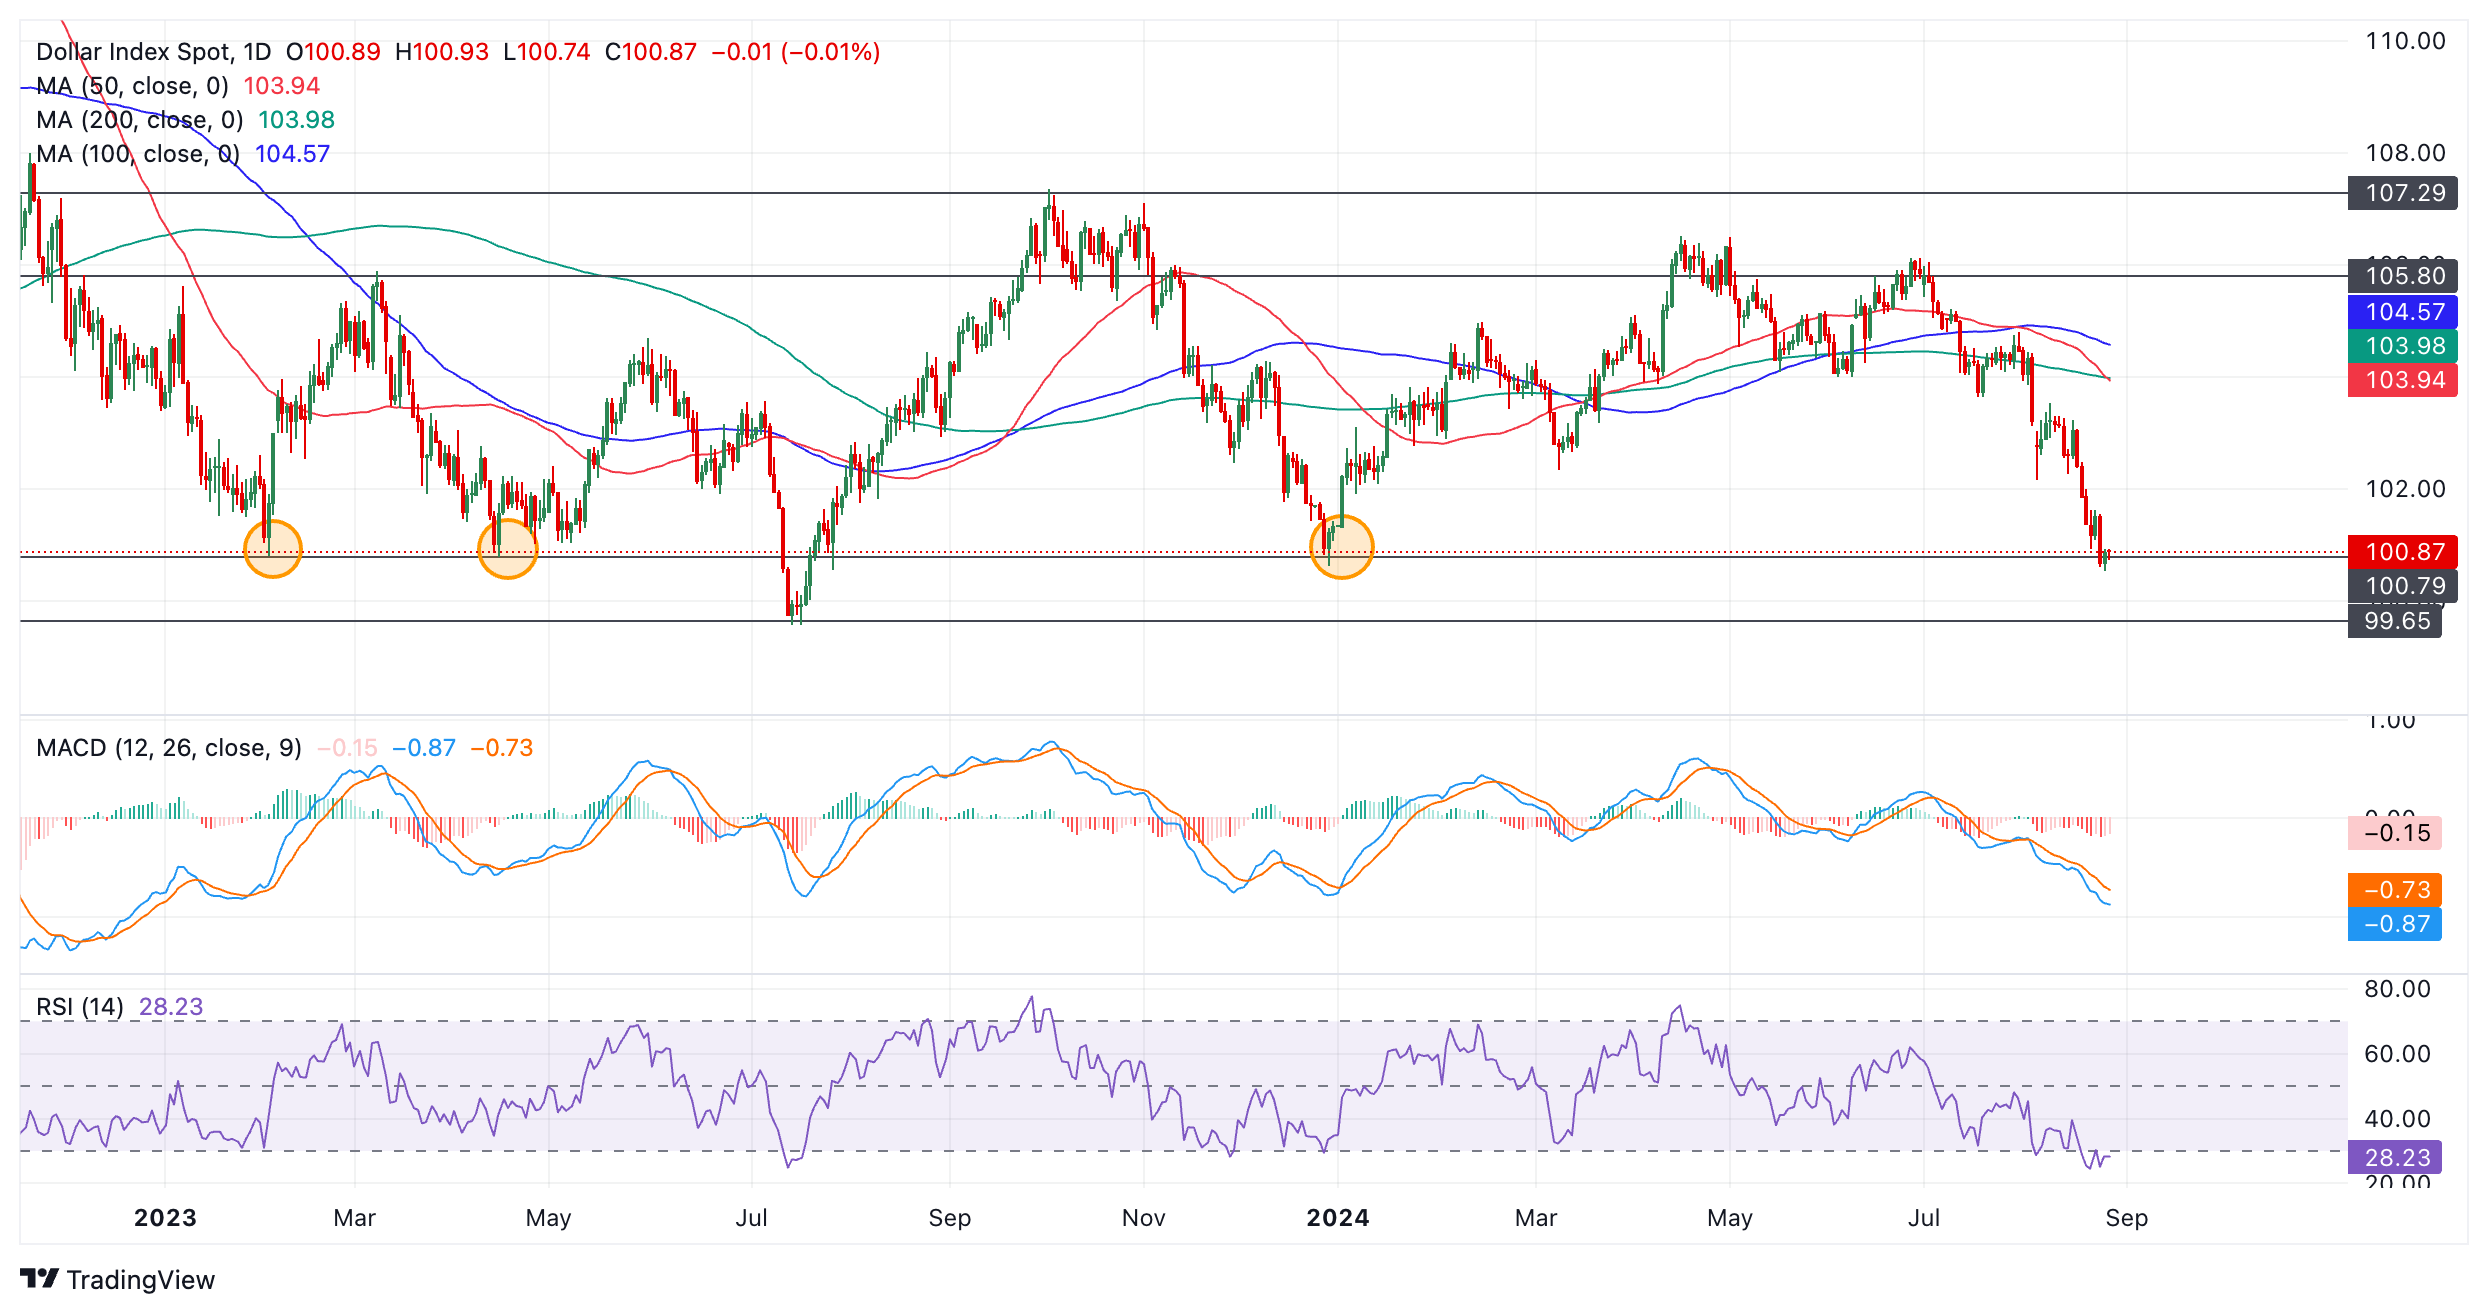
Price action is still bearish and there are no strong bullish reversal patterns forming – neither of the shape or the candlestick variety. This suggests a risk of more downside. A continuation south would probably see DXY reach the next support level at the 99.57, the July 2023 low. This is the lowest floor of the range – a decisive break below there would be a very bearish sign.
The Relative Strength Index (RSI) momentum indicator is oversold on both the daily chart and weekly chart (not shown). This suggests prices are overextended to the downside and there is a greater risk of a pull back occurring.
However, RSI has not yet exited the oversold zone, a necessary prerequisite for a buy signal. As things stand, the fact the RSI is oversold is merely a warning for bears not to add to their short positions, it would have to fully rise out of oversold to provide a reversal signal.
The Moving Average Convergence Divergence (MACD) momentum oscillator has not crossed above its red signal line yet either. This too would be required to provide a buy signal.
To conclude, there is a risk that although the US Dollar Index has reached a historic low it could simply continue falling unless price action forms a reversal pattern or momentum indicators provide firm buy signals.


© 2000-2026. All rights reserved.
This site is managed by Teletrade D.J. LLC 2351 LLC 2022 (Euro House, Richmond Hill Road, Kingstown, VC0100, St. Vincent and the Grenadines).
The information on this website is for informational purposes only and does not constitute any investment advice.
The company does not serve or provide services to customers who are residents of the US, Canada, Iran, The Democratic People's Republic of Korea, Yemen and FATF blacklisted countries.
Making transactions on financial markets with marginal financial instruments opens up wide possibilities and allows investors who are willing to take risks to earn high profits, carrying a potentially high risk of losses at the same time. Therefore you should responsibly approach the issue of choosing the appropriate investment strategy, taking the available resources into account, before starting trading.
Use of the information: full or partial use of materials from this website must always be referenced to TeleTrade as the source of information. Use of the materials on the Internet must be accompanied by a hyperlink to teletrade.org. Automatic import of materials and information from this website is prohibited.
Please contact our PR department if you have any questions or need assistance at pr@teletrade.global.
transfers