- Analytics
- News and Tools
- Market News
- USD/JPY Price Forecast: Edges up amid rising US yields, yet remains bearish
USD/JPY Price Forecast: Edges up amid rising US yields, yet remains bearish
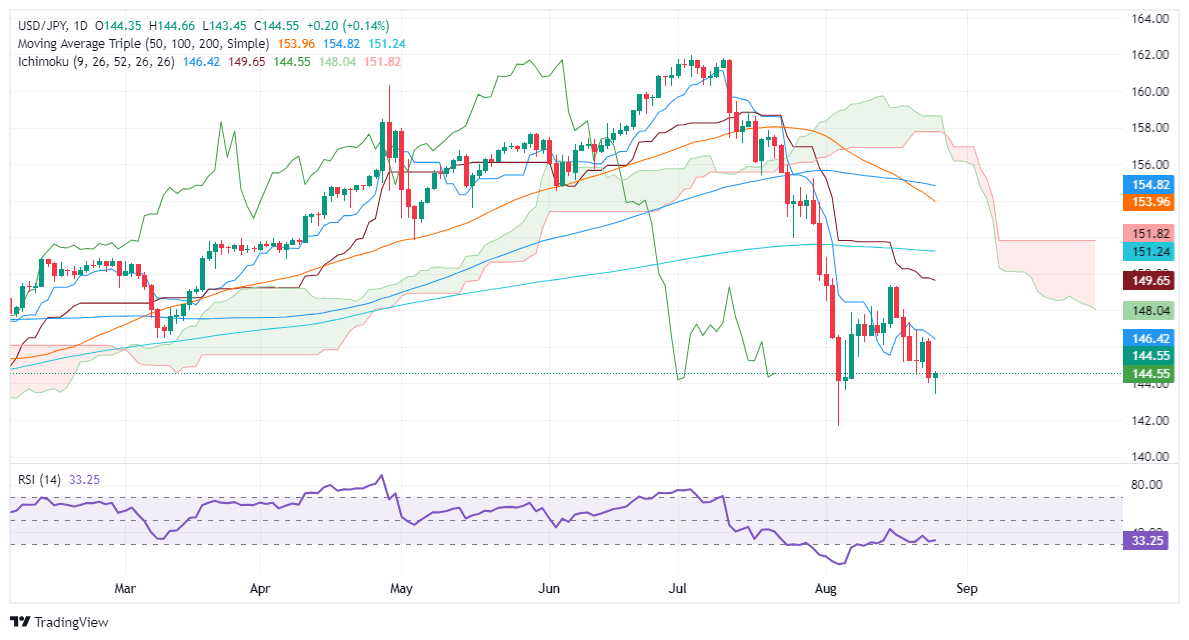
- USD/JPY stays under Ichimoku Cloud and 200-DMA at 151.22, maintaining downtrend with easing selling pressure.
- RSI trends upward, suggesting a potential short-term rally if USD/JPY surpasses 145.00.
- Resistance levels at 146.42 (Tenkan-Sen), 147.91 (Senkou Span A), and 149.39 (August 15 high).
- Below 144.00, key support at 141.69; further drop could target psychological 140.00 level.
The Japanese Yen (JPY) lost ground against the Greenback on Monday as the USD/JPY pair edged up 0.13% amid an uptick in US Treasury bond yields. At the time of writing, the pair was at 144.59 after bouncing off daily lows of 143.44.
USD/JPY Price Forecast: Technical outlook
The USD/JPY downtrend is intact as the exchange rate remains below the Ichimoku Cloud and the 200-day moving average (DMA) at 151.22. Nevertheless, sellers are losing some momentum, as depicted by the Relative Strength Index (RSI), remaining bearish, yet aiming up. That could pave the way for a leg-up before testing lower prices.
If USD/JPY clears 145.00, the next resistance emerges at the Tenkan-Sen at 146.42, followed by the Senkou Span A at 147.91. Further upside is seen at the confluence of the Kijun-Sen and the August 15 daily high of 149.39.
Conversely, if USD/JPY slumps below the 144.00 figure and the pair could tumble towards the latest cycle low seen at 141.69, before challenging 140.00.
USD/JPY Price Action – Daily Chart
Japanese Yen PRICE Today
The table below shows the percentage change of Japanese Yen (JPY) against listed major currencies today. Japanese Yen was the strongest against the US Dollar.
| USD | EUR | GBP | JPY | CAD | AUD | NZD | CHF | |
|---|---|---|---|---|---|---|---|---|
| USD | -0.02% | 0.00% | 0.01% | -0.01% | 0.00% | -0.00% | -0.01% | |
| EUR | 0.02% | 0.03% | 0.03% | -0.00% | 0.04% | -0.01% | -0.01% | |
| GBP | -0.01% | -0.03% | 0.02% | 0.00% | -0.02% | -0.02% | -0.05% | |
| JPY | -0.01% | -0.03% | -0.02% | -0.06% | -0.02% | -0.05% | -0.02% | |
| CAD | 0.01% | 0.00% | -0.00% | 0.06% | 0.03% | 0.00% | -0.01% | |
| AUD | -0.01% | -0.04% | 0.02% | 0.02% | -0.03% | -0.04% | -0.02% | |
| NZD | 0.00% | 0.00% | 0.02% | 0.05% | -0.00% | 0.04% | -0.03% | |
| CHF | 0.01% | 0.01% | 0.05% | 0.02% | 0.00% | 0.02% | 0.03% |
The heat map shows percentage changes of major currencies against each other. The base currency is picked from the left column, while the quote currency is picked from the top row. For example, if you pick the Japanese Yen from the left column and move along the horizontal line to the US Dollar, the percentage change displayed in the box will represent JPY (base)/USD (quote).


© 2000-2026. All rights reserved.
This site is managed by Teletrade D.J. LLC 2351 LLC 2022 (Euro House, Richmond Hill Road, Kingstown, VC0100, St. Vincent and the Grenadines).
The information on this website is for informational purposes only and does not constitute any investment advice.
The company does not serve or provide services to customers who are residents of the US, Canada, Iran, The Democratic People's Republic of Korea, Yemen and FATF blacklisted countries.
Making transactions on financial markets with marginal financial instruments opens up wide possibilities and allows investors who are willing to take risks to earn high profits, carrying a potentially high risk of losses at the same time. Therefore you should responsibly approach the issue of choosing the appropriate investment strategy, taking the available resources into account, before starting trading.
Use of the information: full or partial use of materials from this website must always be referenced to TeleTrade as the source of information. Use of the materials on the Internet must be accompanied by a hyperlink to teletrade.org. Automatic import of materials and information from this website is prohibited.
Please contact our PR department if you have any questions or need assistance at pr@teletrade.global.
transfers