- Analytics
- News and Tools
- Market News
- GBP/USD Price Forecast: Clings to 1.3200 in sideways trading
GBP/USD Price Forecast: Clings to 1.3200 in sideways trading
- Exhaustion signals as GBP/USD stalls after a 400-pip rally, with RSI indicating overbought conditions.
- A daily close below 1.3200 could trigger a pullback, with support levels at 1.3130, 1.3100, and further down at 1.3043.
- If the pair breaks above 1.3230, resistance levels to watch are 1.3250 and the psychological 1.3300 mark.
The Pound Sterling begins the week on a positive note, yet remains hovering around the 1.3200 figure, unable to break last Friday new year-to-date (YTD) high of 1.3230, and trades at 1.3204 almost flat.
GBP/USD Price Forecast: Technical outlook
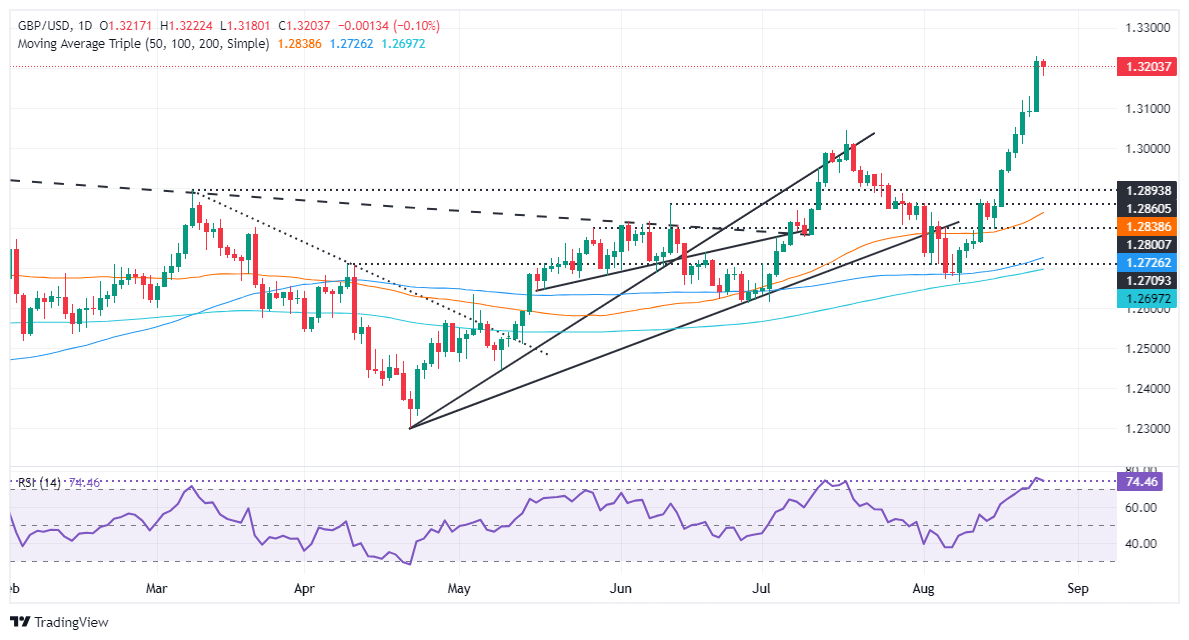
Exhaustion is the name of the game for the GBP/USD. After achieving a 400-pip run that started on August 15th, the pair has failed to extend its gains after hitting a multi-year peak at 1.3230. Today’s price action is forming a ‘doji,’ which indicates indecision amongst buyers and sellers.
Momentum shows buyers are losing steam as the Relative Strength Index (RSI) remains overbought. Therefore, if the GBP/USD achieves a daily close below 1.3200, that could pave the way for a deeper pullback.
In that outcome, the first support would be the August 22 high at 1.3130 before the pair slides to 1.3100. In further weakness, the GBP/USD might hit 1.3043, and July’s 17 daily high turned support.
On the other hand, if GBP/USD rises past 1.3230, the next resistance would be 1.3250, followed by the 1.3300 mark.
GBP/USD Price Action – Daily Chart
British Pound PRICE Today
The table below shows the percentage change of British Pound (GBP) against listed major currencies today. British Pound was the strongest against the New Zealand Dollar.
| USD | EUR | GBP | JPY | CAD | AUD | NZD | CHF | |
|---|---|---|---|---|---|---|---|---|
| USD | 0.12% | 0.09% | -0.04% | -0.32% | 0.22% | 0.21% | -0.14% | |
| EUR | -0.12% | -0.09% | -0.15% | -0.43% | 0.00% | 0.10% | -0.25% | |
| GBP | -0.09% | 0.09% | -0.17% | -0.40% | 0.09% | 0.13% | -0.22% | |
| JPY | 0.04% | 0.15% | 0.17% | -0.26% | 0.34% | 0.47% | -0.02% | |
| CAD | 0.32% | 0.43% | 0.40% | 0.26% | 0.53% | 0.59% | 0.17% | |
| AUD | -0.22% | -0.01% | -0.09% | -0.34% | -0.53% | 0.09% | -0.26% | |
| NZD | -0.21% | -0.10% | -0.13% | -0.47% | -0.59% | -0.09% | -0.36% | |
| CHF | 0.14% | 0.25% | 0.22% | 0.02% | -0.17% | 0.26% | 0.36% |
The heat map shows percentage changes of major currencies against each other. The base currency is picked from the left column, while the quote currency is picked from the top row. For example, if you pick the British Pound from the left column and move along the horizontal line to the US Dollar, the percentage change displayed in the box will represent GBP (base)/USD (quote).


© 2000-2026. All rights reserved.
This site is managed by Teletrade D.J. LLC 2351 LLC 2022 (Euro House, Richmond Hill Road, Kingstown, VC0100, St. Vincent and the Grenadines).
The information on this website is for informational purposes only and does not constitute any investment advice.
The company does not serve or provide services to customers who are residents of the US, Canada, Iran, The Democratic People's Republic of Korea, Yemen and FATF blacklisted countries.
Making transactions on financial markets with marginal financial instruments opens up wide possibilities and allows investors who are willing to take risks to earn high profits, carrying a potentially high risk of losses at the same time. Therefore you should responsibly approach the issue of choosing the appropriate investment strategy, taking the available resources into account, before starting trading.
Use of the information: full or partial use of materials from this website must always be referenced to TeleTrade as the source of information. Use of the materials on the Internet must be accompanied by a hyperlink to teletrade.org. Automatic import of materials and information from this website is prohibited.
Please contact our PR department if you have any questions or need assistance at pr@teletrade.global.
transfers