- Analytics
- News and Tools
- Market News
- Silver Price Prediction: XAG/USD bulls seize control above $29.20 confluence breakpoint
Silver Price Prediction: XAG/USD bulls seize control above $29.20 confluence breakpoint
- Silver turns positive for the fourth straight day and climbs to a fresh one-month top on Tuesday.
- The technical setup favors bullish traders and supports prospects for a further appreciating move.
- Weakness below the $29.20 confluence hurdle breakpoint could be seen as a buying opportunity.
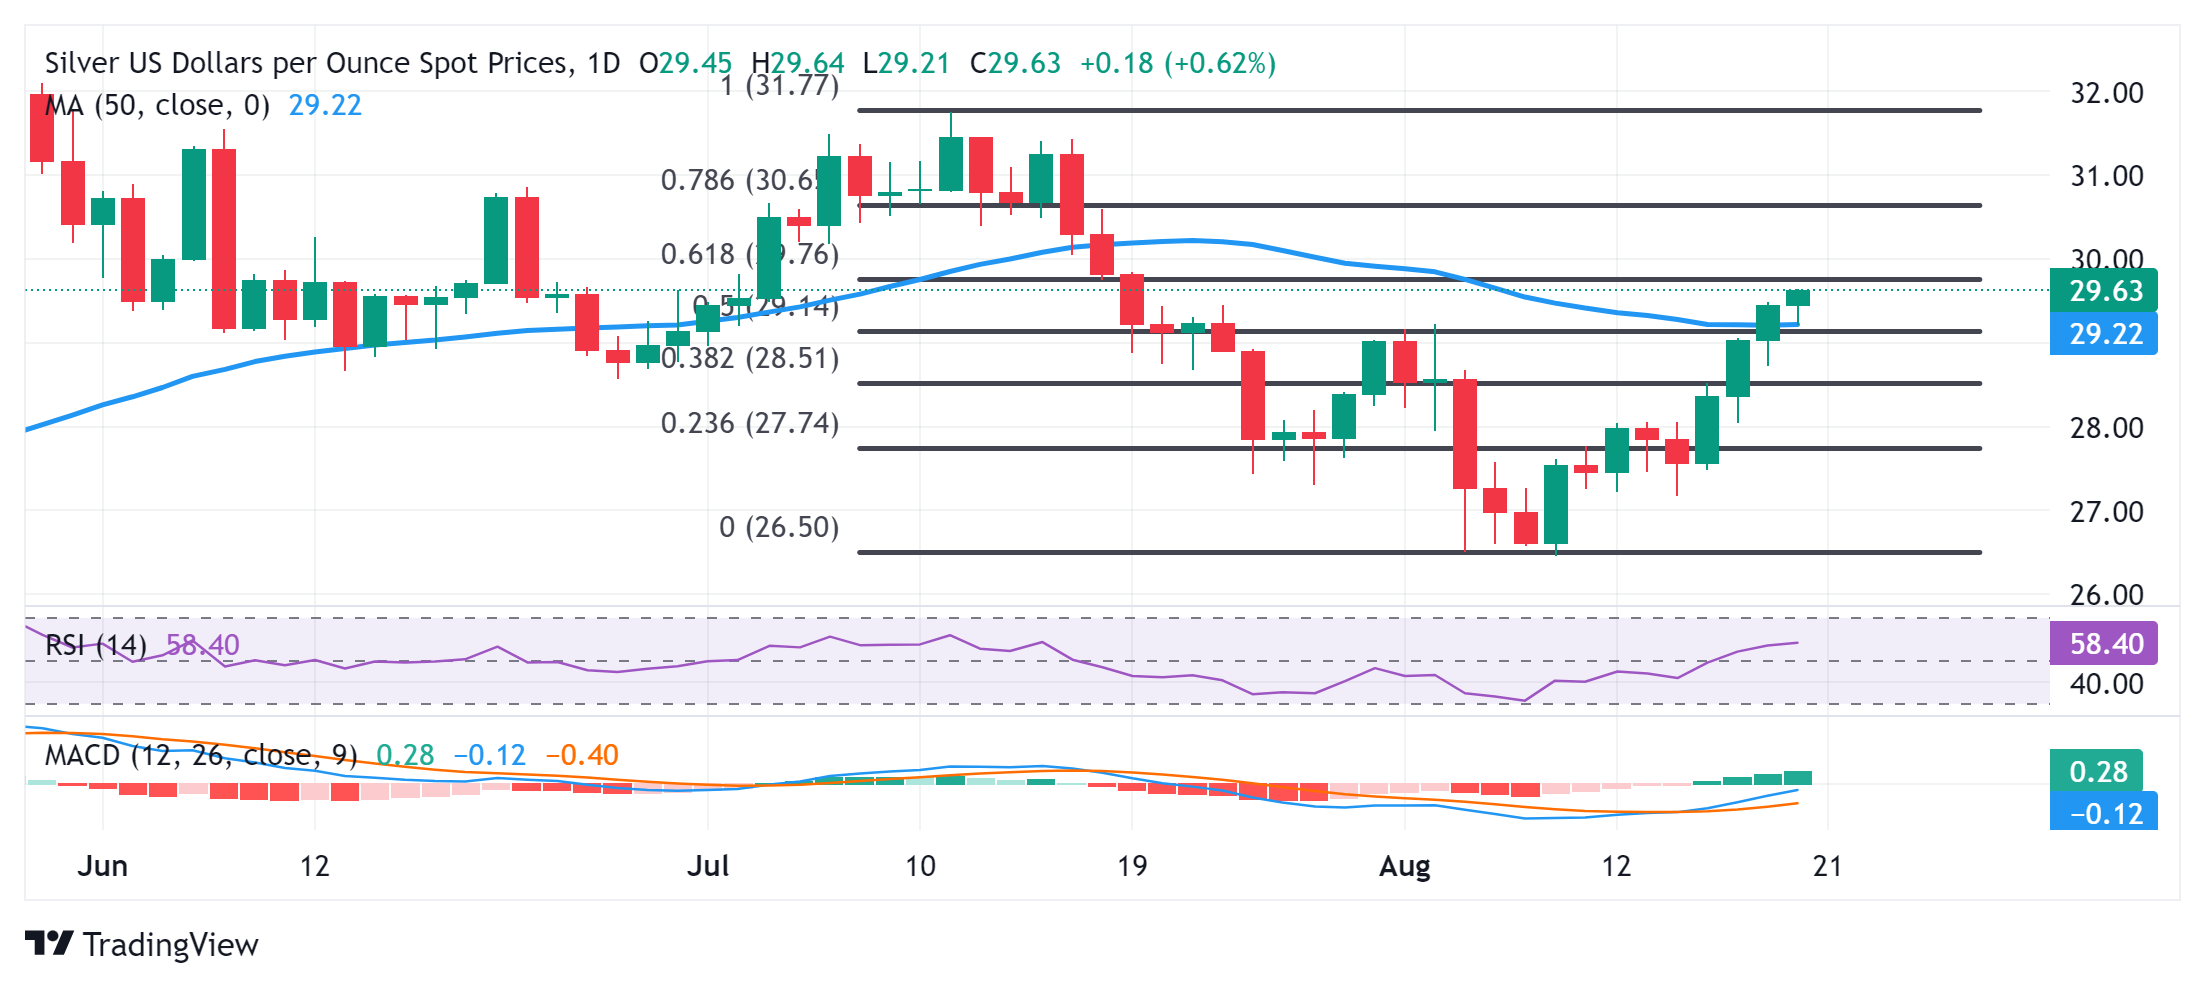
Silver (XAG/USD) reverses an intraday dip and climbs to a fresh one-month peak during the early part of the European session on Tuesday. The white metal currently trades around the $29.60-$29.65 area, up over 0.70% for the day, and seems poised to prolong its recent goodish recovery from the $26.45 zone, or the lowest level since May touched earlier this month.
From a technical perspective, the overnight breakout through the $29.20 confluence hurdle – comprising the 50-day Simple Moving Average (SMA) and the 50% Fibonacci retracement level of the July-August slide – was seen as a fresh trigger for bulls. Moreover, oscillators on the daily chart have been gaining positive traction and are still away from being in the overbought zone, validating the near-term positive outlook for the XAG/USD.
Adding to this, the emergence of dip-buying near the aforementioned confluence resistance breakpoint, now turned support, also supports prospects for a further near-term appreciating move. Hence, a subsequent strength beyond the 61.8% Fibo. level, around the $29.75 region, en route to the $30.00 psychological mark, looks like a distinct possibility. The momentum could extend towards the $30.55-$30.60 area, or the 78.6% Fibo. level.
On the flip side, the $29.20 area now seems to protect the immediate downside ahead of the $29.00 round-figure mark. Some follow-through selling could make the XAG/USD vulnerable to accelerate the slide towards the $28.55 region, or the 38.2% Fibo. level, en route to the $28.00 round figure. The latter should act as a key pivotal point, which if broken might expose the $27.25 support before the metal drops back to test the $27.00 mark.
Silver daily chart
Silver FAQs
Silver is a precious metal highly traded among investors. It has been historically used as a store of value and a medium of exchange. Although less popular than Gold, traders may turn to Silver to diversify their investment portfolio, for its intrinsic value or as a potential hedge during high-inflation periods. Investors can buy physical Silver, in coins or in bars, or trade it through vehicles such as Exchange Traded Funds, which track its price on international markets.
Silver prices can move due to a wide range of factors. Geopolitical instability or fears of a deep recession can make Silver price escalate due to its safe-haven status, although to a lesser extent than Gold's. As a yieldless asset, Silver tends to rise with lower interest rates. Its moves also depend on how the US Dollar (USD) behaves as the asset is priced in dollars (XAG/USD). A strong Dollar tends to keep the price of Silver at bay, whereas a weaker Dollar is likely to propel prices up. Other factors such as investment demand, mining supply – Silver is much more abundant than Gold – and recycling rates can also affect prices.
Silver is widely used in industry, particularly in sectors such as electronics or solar energy, as it has one of the highest electric conductivity of all metals – more than Copper and Gold. A surge in demand can increase prices, while a decline tends to lower them. Dynamics in the US, Chinese and Indian economies can also contribute to price swings: for the US and particularly China, their big industrial sectors use Silver in various processes; in India, consumers’ demand for the precious metal for jewellery also plays a key role in setting prices.
Silver prices tend to follow Gold's moves. When Gold prices rise, Silver typically follows suit, as their status as safe-haven assets is similar. The Gold/Silver ratio, which shows the number of ounces of Silver needed to equal the value of one ounce of Gold, may help to determine the relative valuation between both metals. Some investors may consider a high ratio as an indicator that Silver is undervalued, or Gold is overvalued. On the contrary, a low ratio might suggest that Gold is undervalued relative to Silver.


© 2000-2026. All rights reserved.
This site is managed by Teletrade D.J. LLC 2351 LLC 2022 (Euro House, Richmond Hill Road, Kingstown, VC0100, St. Vincent and the Grenadines).
The information on this website is for informational purposes only and does not constitute any investment advice.
The company does not serve or provide services to customers who are residents of the US, Canada, Iran, The Democratic People's Republic of Korea, Yemen and FATF blacklisted countries.
Making transactions on financial markets with marginal financial instruments opens up wide possibilities and allows investors who are willing to take risks to earn high profits, carrying a potentially high risk of losses at the same time. Therefore you should responsibly approach the issue of choosing the appropriate investment strategy, taking the available resources into account, before starting trading.
Use of the information: full or partial use of materials from this website must always be referenced to TeleTrade as the source of information. Use of the materials on the Internet must be accompanied by a hyperlink to teletrade.org. Automatic import of materials and information from this website is prohibited.
Please contact our PR department if you have any questions or need assistance at pr@teletrade.global.
transfers