- Analytics
- News and Tools
- Market News
- USD/JPY Price Forecast: Consolidates around 144.00 after over 1.60 % loss
USD/JPY Price Forecast: Consolidates around 144.00 after over 1.60 % loss
- USD/JPY drops over 4.90% to a low of 141.69 during Asian session before rebounding to 144.16.
- Technical outlook: Downward bias with potential for mean-reversion move as RSI indicates overextension.
- Key resistance levels: 145.00, February 1 bottom at 145.89, and March 11 level at 146.48.
- Key support levels: 144.00, January 9 pivot low at 143.42, and August 5 bottom at 141.69.
The Japanese Yen extended its rally on Monday, registering more than 1.63% gains. This witnessed the USD/JPY drop over 4.90% during the Asian session to a low of 141.69 before trimming some losses and regaining the 144.00 mark. At the time of writing, the USD/JPY trades at 144.16, virtually unchanged as Tuesday’s Asian session begins.
USD/JPY Price Forecast: Technical outlook
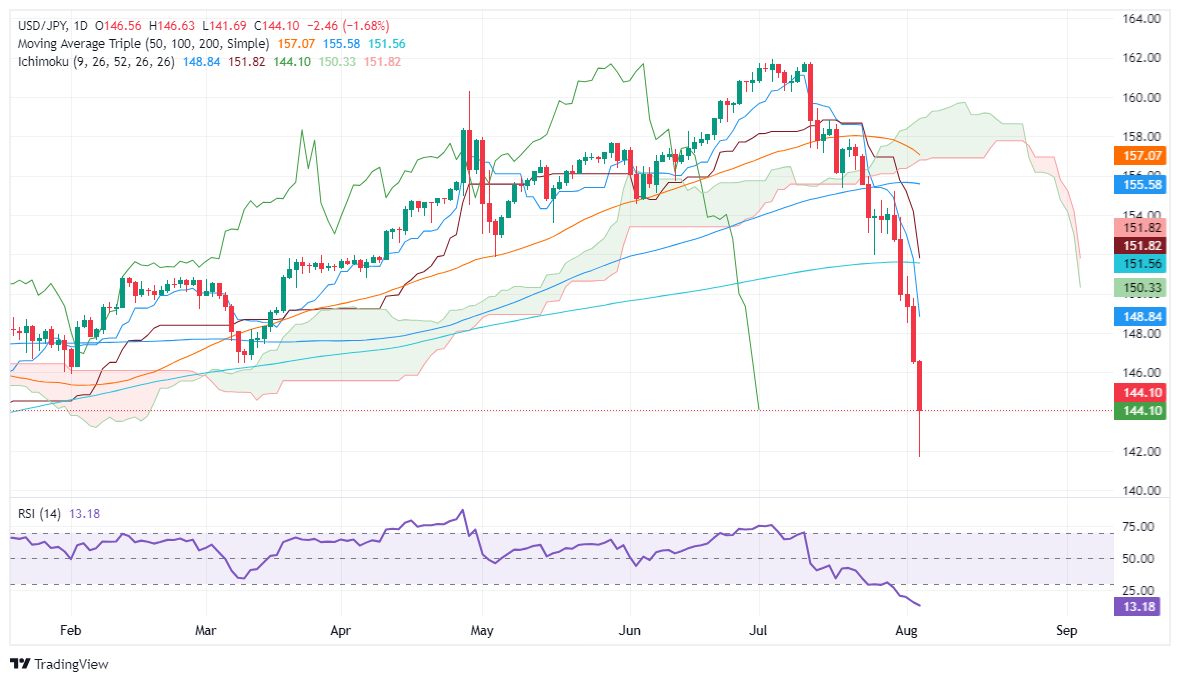
The USD/JPY is downward biased yet has found a bottom at around 141.69. Once hit, buyers emerged at the bottom and lifted the exchange rate since the mid-North American session. The latest push saw spot prices above 144.00 as momentum shows the downtrend is overextended, as shown by the Relative Strength Index (RSI).
As the RSI lies beneath 20, the pair is subject to a mean-reversion move.
If USD/JPY climbs past 145.00, the next resistance will be on February 1, bottom at 145.89. Once surpassed, the March 11 146.48 emerges, followed by the 147.00 mark.
Conversely, if USD/JPY extends its losses below 144.00, the next support would be the January 9 pivot low at 143.42, ahead of the August 5 bottom at 141.69.
USD/JPY Price Action – Daily Chart
Japanese Yen PRICE Today
The table below shows the percentage change of Japanese Yen (JPY) against listed major currencies today. Japanese Yen was the strongest against the Swiss Franc.
| USD | EUR | GBP | JPY | CAD | AUD | NZD | CHF | |
|---|---|---|---|---|---|---|---|---|
| USD | -0.00% | -0.01% | -0.06% | -0.02% | 0.02% | 0.10% | 0.03% | |
| EUR | 0.00% | 0.03% | -0.05% | -0.02% | 0.02% | 0.04% | 0.04% | |
| GBP | 0.00% | -0.03% | -0.07% | -0.03% | -0.00% | 0.03% | 0.02% | |
| JPY | 0.06% | 0.05% | 0.07% | 0.02% | 0.08% | 0.08% | 0.27% | |
| CAD | 0.02% | 0.02% | 0.03% | -0.02% | 0.03% | 0.06% | 0.05% | |
| AUD | -0.02% | -0.02% | 0.00% | -0.08% | -0.03% | 0.04% | 0.03% | |
| NZD | -0.10% | -0.04% | -0.03% | -0.08% | -0.06% | -0.04% | 0.04% | |
| CHF | -0.03% | -0.04% | -0.02% | -0.27% | -0.05% | -0.03% | -0.04% |
The heat map shows percentage changes of major currencies against each other. The base currency is picked from the left column, while the quote currency is picked from the top row. For example, if you pick the Japanese Yen from the left column and move along the horizontal line to the US Dollar, the percentage change displayed in the box will represent JPY (base)/USD (quote).


© 2000-2026. All rights reserved.
This site is managed by Teletrade D.J. LLC 2351 LLC 2022 (Euro House, Richmond Hill Road, Kingstown, VC0100, St. Vincent and the Grenadines).
The information on this website is for informational purposes only and does not constitute any investment advice.
The company does not serve or provide services to customers who are residents of the US, Canada, Iran, The Democratic People's Republic of Korea, Yemen and FATF blacklisted countries.
Making transactions on financial markets with marginal financial instruments opens up wide possibilities and allows investors who are willing to take risks to earn high profits, carrying a potentially high risk of losses at the same time. Therefore you should responsibly approach the issue of choosing the appropriate investment strategy, taking the available resources into account, before starting trading.
Use of the information: full or partial use of materials from this website must always be referenced to TeleTrade as the source of information. Use of the materials on the Internet must be accompanied by a hyperlink to teletrade.org. Automatic import of materials and information from this website is prohibited.
Please contact our PR department if you have any questions or need assistance at pr@teletrade.global.
transfers