- Analytics
- News and Tools
- Market News
- USD/JPY Price Analysis: Consolidates around 154.00 yet remains bearish
USD/JPY Price Analysis: Consolidates around 154.00 yet remains bearish
- USD/JPY trades with 0.18% gains, consolidating above 154.00 amid bearish momentum.
- Technical outlook shows bearish bias with first support at 154.00 and next at 153.00.
- Resistance seen at 154.74; a climb above could trigger a rally to 155.00 and beyond.
The USD/JPY consolidates at around last week's lows yet trades with minuscule gains of 0.18% amid lower US Treasury yields and a risk-on impulse. The Greenback strengthens due to month-end flows, while the major clings above the 154.00 figure ahead of crucial
USD/JPY Price Analysis: Technical outlook
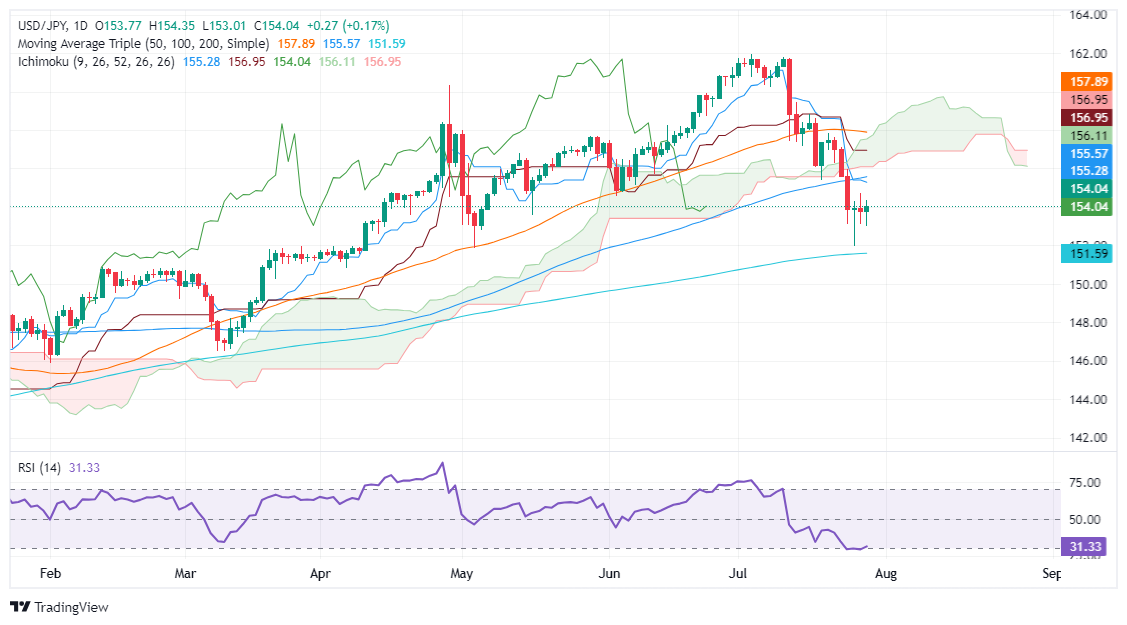
The USD/JPY pair shifted downward bias once the major breached the Ichimoku Cloud (Kumo) yet remains shy of cracking the latest cycle low of 151.86, the May 3 low.
It is worth noting that momentum is bearish, as depicted by the Relatives Strength Index (RSI), buried near oversold territory.
Given the backdrop, the path of least resistance is downwards. The USD/JPY first support would be 154.00. Once surpassed, the next stop would be the 153.00 mark, followed by the July 25 low at 151.93, ahead of 151.86. Once those levels are cleared, the next demand zone would be an upslope support trendline drawn from the beginning of 2023 that passes at around 149.00-150.00.
Conversely, if USD/JPY climbs above last Friday’s peak of 154.74, that will exacerbate a rally to 155.00. Further gains lie overhead, at around the Tenkan-Sen at 155.27.
USD/JPY Price Action – Daily Chart
Japanese Yen PRICE Today
The table below shows the percentage change of Japanese Yen (JPY) against listed major currencies today. Japanese Yen was the strongest against the Euro.
| USD | EUR | GBP | JPY | CAD | AUD | NZD | CHF | |
|---|---|---|---|---|---|---|---|---|
| USD | 0.33% | 0.06% | 0.20% | 0.15% | -0.03% | 0.23% | 0.28% | |
| EUR | -0.33% | -0.31% | -0.13% | -0.16% | -0.32% | -0.12% | -0.03% | |
| GBP | -0.06% | 0.31% | 0.14% | 0.13% | -0.01% | 0.21% | 0.28% | |
| JPY | -0.20% | 0.13% | -0.14% | -0.08% | -0.21% | 0.04% | 0.12% | |
| CAD | -0.15% | 0.16% | -0.13% | 0.08% | -0.15% | 0.03% | 0.16% | |
| AUD | 0.03% | 0.32% | 0.00% | 0.21% | 0.15% | 0.24% | 0.29% | |
| NZD | -0.23% | 0.12% | -0.21% | -0.04% | -0.03% | -0.24% | 0.07% | |
| CHF | -0.28% | 0.03% | -0.28% | -0.12% | -0.16% | -0.29% | -0.07% |
The heat map shows percentage changes of major currencies against each other. The base currency is picked from the left column, while the quote currency is picked from the top row. For example, if you pick the Japanese Yen from the left column and move along the horizontal line to the US Dollar, the percentage change displayed in the box will represent JPY (base)/USD (quote).


© 2000-2026. All rights reserved.
This site is managed by Teletrade D.J. LLC 2351 LLC 2022 (Euro House, Richmond Hill Road, Kingstown, VC0100, St. Vincent and the Grenadines).
The information on this website is for informational purposes only and does not constitute any investment advice.
The company does not serve or provide services to customers who are residents of the US, Canada, Iran, The Democratic People's Republic of Korea, Yemen and FATF blacklisted countries.
Making transactions on financial markets with marginal financial instruments opens up wide possibilities and allows investors who are willing to take risks to earn high profits, carrying a potentially high risk of losses at the same time. Therefore you should responsibly approach the issue of choosing the appropriate investment strategy, taking the available resources into account, before starting trading.
Use of the information: full or partial use of materials from this website must always be referenced to TeleTrade as the source of information. Use of the materials on the Internet must be accompanied by a hyperlink to teletrade.org. Automatic import of materials and information from this website is prohibited.
Please contact our PR department if you have any questions or need assistance at pr@teletrade.global.
transfers