- Analytics
- News and Tools
- Market News
- GBP/USD Price Analysis: Drops below 1.2900 amid strong US data
GBP/USD Price Analysis: Drops below 1.2900 amid strong US data
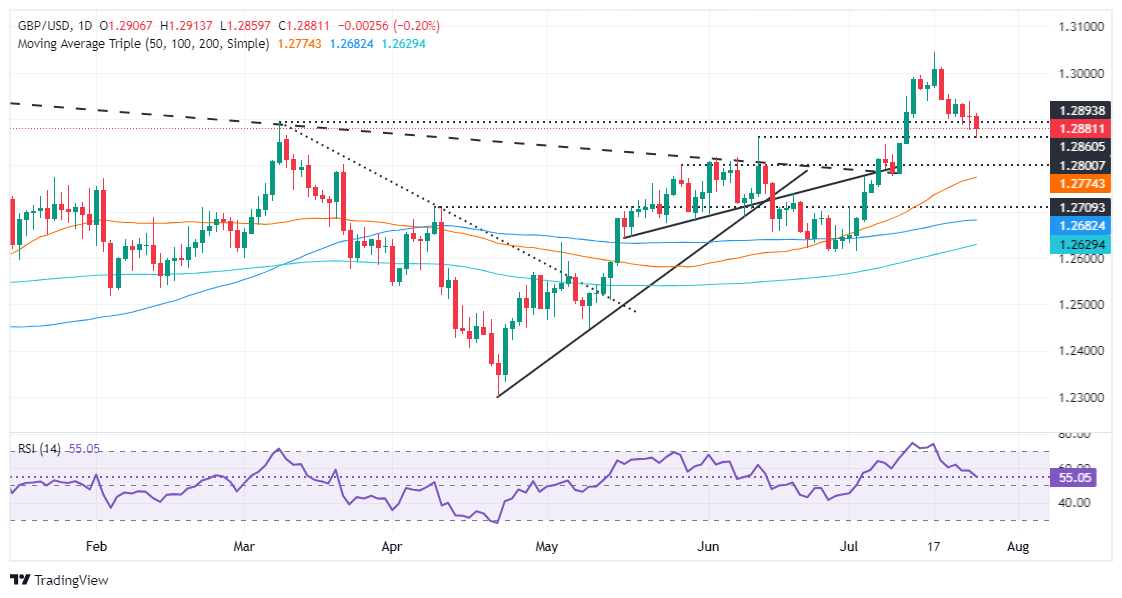
- GBP/USD dips to 1.2881, marking third day of losses, after peaking at 1.2913.
- Seller momentum strong as RSI falls, suggesting more downside potential.
- Key supports at 1.2860; below targets 1.2800, 50-DMA at 1.2773. Resistance at 1.2940 critical for bullish turn.
The Pound Sterling dropped below 1.2900 for the third consecutive day, edged lower 0.17%, and traded at 1.2881 after hitting a daily high of 1.2913. Data from the UK wasn’t better than expected, while an outstanding growth report from the US bolstered the Greenback.
GBP/USD Price Analysis: Technical outlook
From a technical standpoint, the GBP/USD continues to edge lower, though sellers are encountering tough times clearing the June 12 peak at 1.2860, which turned support once cleared.
However, momentum remains on the seller's side, as the Relative Strength Index (RSI) extends its drop after exiting overbought territory, approaching the 50-neutral line.
For a bullish continuation, the GBP/USD must reclaim 1.2900. This would pave the way to remaining range-bound within the 1.2900-1.2940 area unless the latter is broken, exposing the 1.3000 figure. Further upside is seen above that level, with the year-to-date (YTD) high at 1.3043.
Conversely, and the path of least resistance short term, the GBP/USD first support would be 1.2860. Once surpassed, the next stop would be 1.2800, followed by the 50-day moving average (DMA) at 1.2773.
GBP/USD Price Action – Daily Chart
British Pound PRICE Today
The table below shows the percentage change of British Pound (GBP) against listed major currencies today. British Pound was the strongest against the New Zealand Dollar.
| USD | EUR | GBP | JPY | CAD | AUD | NZD | CHF | |
|---|---|---|---|---|---|---|---|---|
| USD | -0.18% | 0.19% | 0.00% | 0.10% | 0.46% | 0.49% | -0.57% | |
| EUR | 0.18% | 0.38% | 0.18% | 0.29% | 0.65% | 0.68% | -0.41% | |
| GBP | -0.19% | -0.38% | -0.18% | -0.07% | 0.28% | 0.29% | -0.78% | |
| JPY | 0.00% | -0.18% | 0.18% | 0.11% | 0.47% | 0.47% | -0.58% | |
| CAD | -0.10% | -0.29% | 0.07% | -0.11% | 0.36% | 0.38% | -0.69% | |
| AUD | -0.46% | -0.65% | -0.28% | -0.47% | -0.36% | 0.04% | -1.05% | |
| NZD | -0.49% | -0.68% | -0.29% | -0.47% | -0.38% | -0.04% | -1.08% | |
| CHF | 0.57% | 0.41% | 0.78% | 0.58% | 0.69% | 1.05% | 1.08% |
The heat map shows percentage changes of major currencies against each other. The base currency is picked from the left column, while the quote currency is picked from the top row. For example, if you pick the British Pound from the left column and move along the horizontal line to the US Dollar, the percentage change displayed in the box will represent GBP (base)/USD (quote).


© 2000-2026. All rights reserved.
This site is managed by Teletrade D.J. LLC 2351 LLC 2022 (Euro House, Richmond Hill Road, Kingstown, VC0100, St. Vincent and the Grenadines).
The information on this website is for informational purposes only and does not constitute any investment advice.
The company does not serve or provide services to customers who are residents of the US, Canada, Iran, The Democratic People's Republic of Korea, Yemen and FATF blacklisted countries.
Making transactions on financial markets with marginal financial instruments opens up wide possibilities and allows investors who are willing to take risks to earn high profits, carrying a potentially high risk of losses at the same time. Therefore you should responsibly approach the issue of choosing the appropriate investment strategy, taking the available resources into account, before starting trading.
Use of the information: full or partial use of materials from this website must always be referenced to TeleTrade as the source of information. Use of the materials on the Internet must be accompanied by a hyperlink to teletrade.org. Automatic import of materials and information from this website is prohibited.
Please contact our PR department if you have any questions or need assistance at pr@teletrade.global.
transfers