- Analytics
- News and Tools
- Market News
- Gold extends correction on technical selling and robust PMI data
Gold extends correction on technical selling and robust PMI data
- Gold extends correction and slides down to a technical range floor.
- The precious metal shrugs off the global growth fears that normally incentivize investors to hoard Gold.
- Gold joins most other commodities as they sell off.
Gold (XAU/USD) weakens on Thursday, trading over a percentage point lower in the $2,370s amid widespread declines in stocks and commodities driven by global growth concerns.
Despite being a safe haven, Gold's weakness may be attributed to technical selling, as it experiences a predicted downward movement within its trading range. Additionally, marginally favorable preliminary US S&P Global Purchasing Managers Index (PMI) data for July released on Wednesday may have dampened fears of "stagflation," which is characterized by economic weakness coupled with high inflation — a scenario where Gold typically performs well.
Gold falls on technical selling and US PMI data
Gold declines on Thursday after data showed the preliminary S&P Global Composite PMI improved to 55 in July from 54.8 in June. The S&P Global Manufacturing PMI, however, declined to 49.5 from 51.6, while the Services PMI rose to 56.0 from 55.3.
Chris Williamson, Chief Business Economist at S&P Global Market Intelligence, noted, "The flash PMI data signal a ‘Goldilocks’ scenario at the start of the third quarter, with the economy growing at a robust pace while inflation moderates." He added, "In terms of inflation, the July survey saw input costs rise at an increased rate, linked to rising raw material, shipping, and labor costs. These higher costs could feed through to higher selling prices if sustained, or cause a squeeze on margins."
Gold's decline comes despite continued expectations that the Federal Reserve (Fed) will cut interest rates multiple times before the year's end. Lower interest rates generally make non-interest-bearing assets like Gold more attractive, boosting demand.
Traders are now awaiting more US economic data for clarity on the trajectory of US interest rates. Key releases include the advanced US Q2 Gross Domestic Product (GDP) growth data on Thursday and the Personal Consumption Expenditures (PCE) Price Index report for June on Friday.
Meanwhile, there has been some unwinding of the "Trump trade," which has dragged US bond yields lower, positively impacting Gold. In some polls, US Vice president and Democrat candidate Kamala Harris now leads Republican leader and former US President Donald Trump, suggesting a potentially less inflationary outlook for the economy if she wins.
Additionally, there are expectations of increased physical demand from India, the world’s second-largest Gold consumer, following the government's reduction of its Gold import tax from 15% to 6%.
Gold is also expected to benefit from long-term geopolitical factors, particularly plans by BRICS+ nations to replace the US Dollar as the world’s reserve currency with their own Gold-backed alternative. This move aims to prevent the US from leveraging the Dollar in geopolitical conflicts and sanctions against enemy states.
Technical Analysis: Gold continues oscillating in range
Gold is unfolding a new down leg within the widening range it has formed since May. It still appears to be within a sideways market mode rather than a directional trend.
The down leg is expected to fall towards the floor and the 100-day Simple Moving Average (SMA) at circa $2,320. However, the 50-day SMA at $2,360 is likely to present temporary support on the way down.
XAU/USD Daily Chart
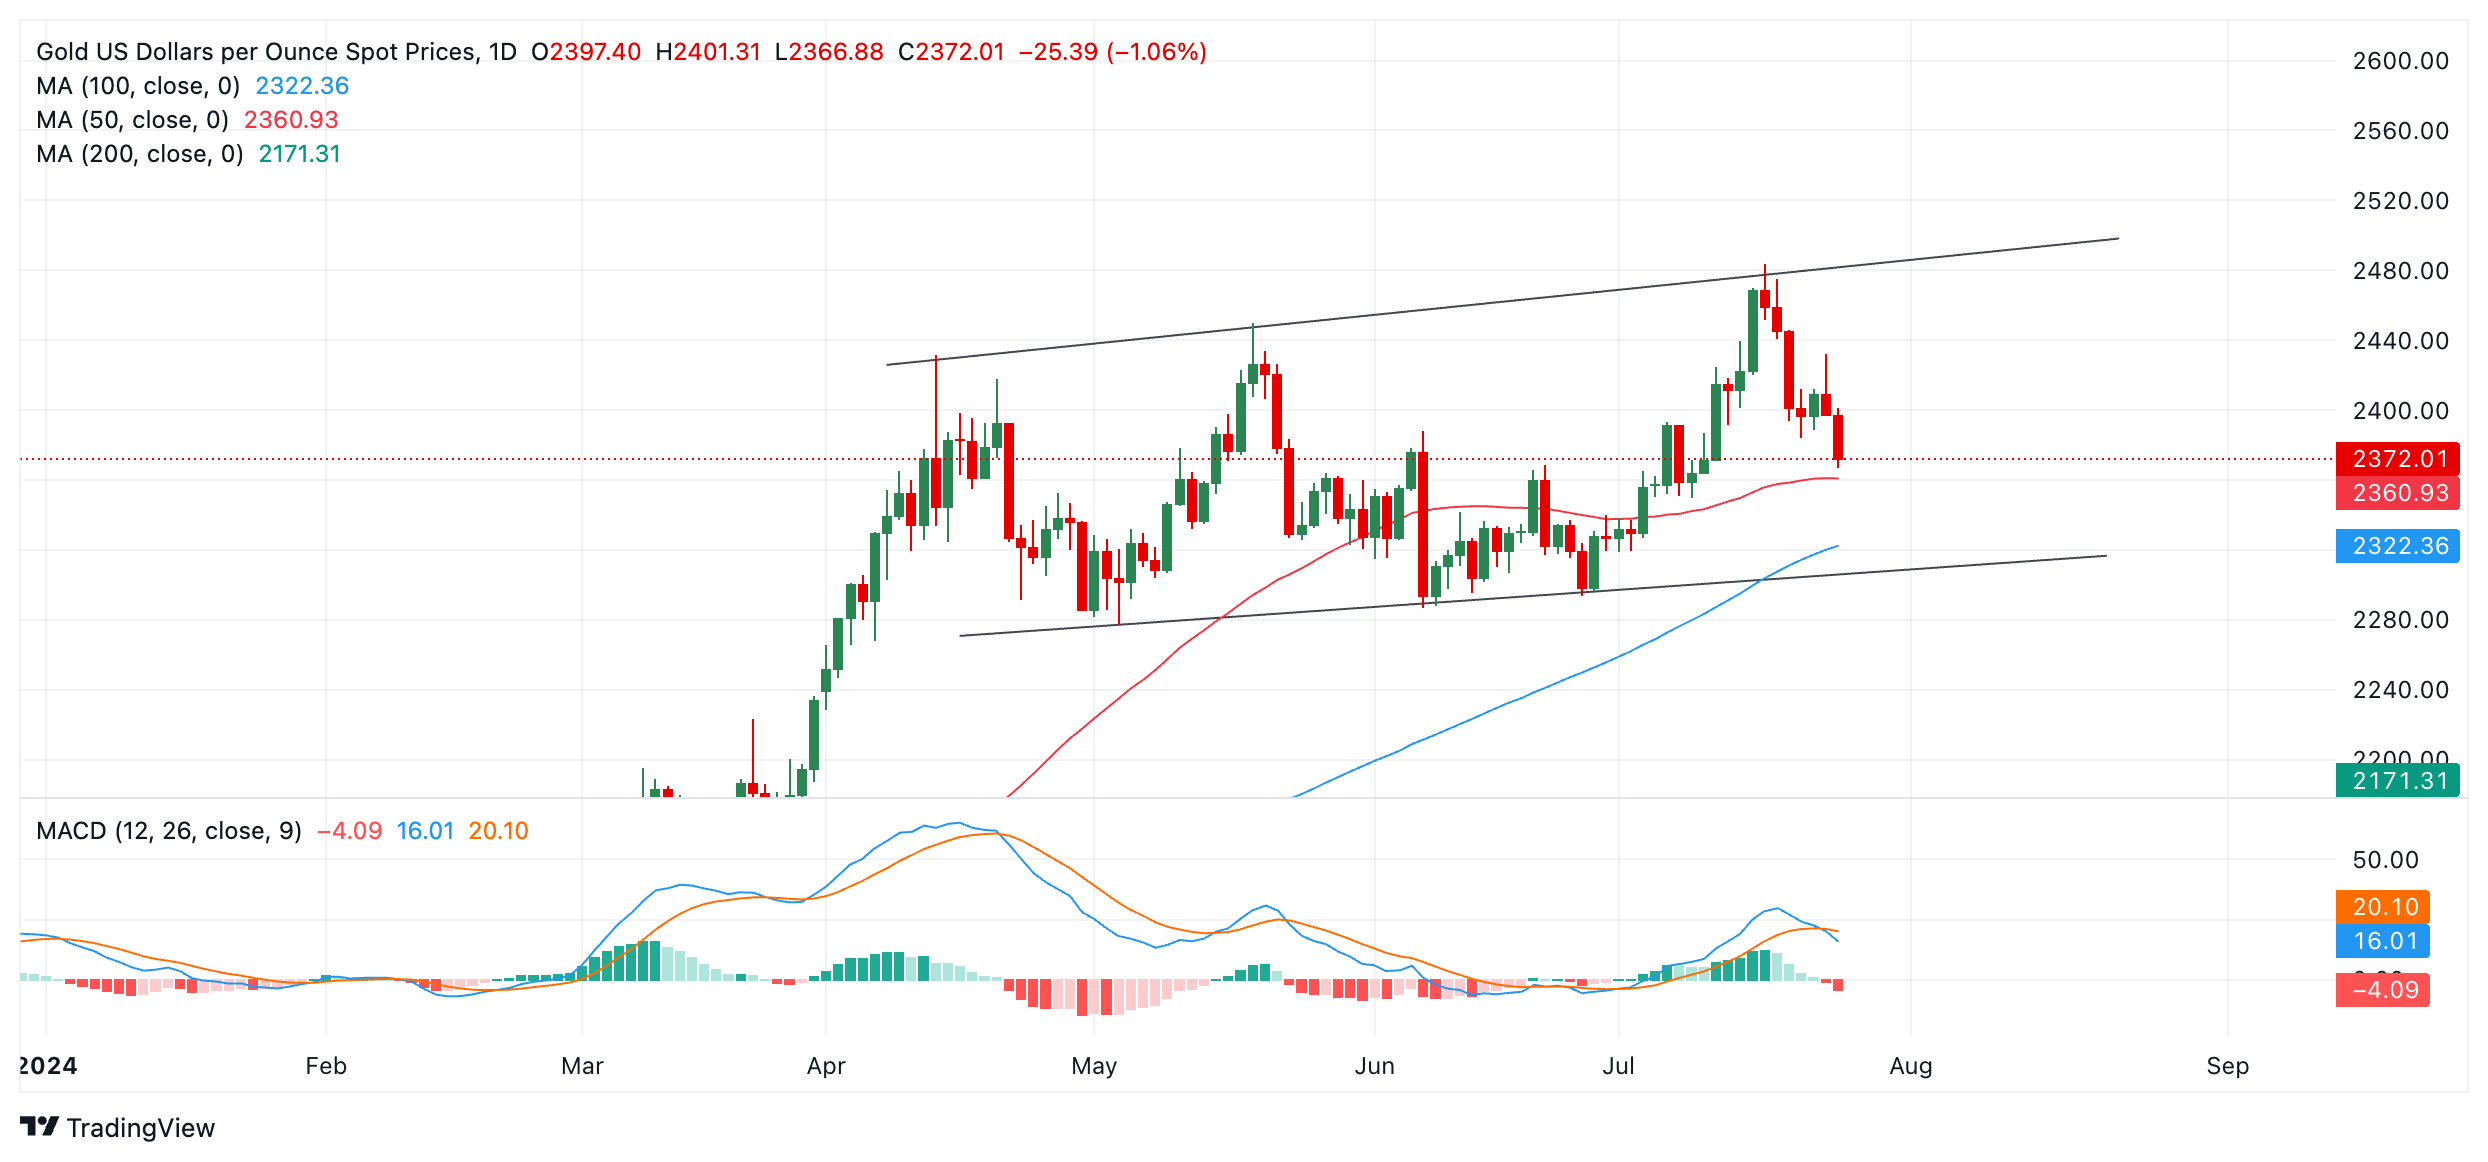
The Moving Average Convergence Divergence (MACD) indicator has crossed below its signal line, adding bearish confirmation to the down move currently unfolding. MACD tends to work particularly well at signaling price turns in sideways markets.
A break above the $2,483 all-time-high would indicate the establishment of a higher high and suggest the possibility of a breakout to the upside and an extension of the longer-term uptrend.
Such a move might unlock Gold’s next upside target at roughly $2,555-$2,560, calculated by extrapolating the 0.618 Fibonacci ratio of the height of the range higher.
Economic Indicator
Gross Domestic Product Annualized
The real Gross Domestic Product (GDP) Annualized, released quarterly by the US Bureau of Economic Analysis, measures the value of the final goods and services produced in the United States in a given period of time. Changes in GDP are the most popular indicator of the nation’s overall economic health. The data is expressed at an annualized rate, which means that the rate has been adjusted to reflect the amount GDP would have changed over a year’s time, had it continued to grow at that specific rate. Generally speaking, a high reading is seen as bullish for the US Dollar (USD), while a low reading is seen as bearish.
Read more.Next release: Thu Jul 25, 2024 12:30 (Prel)
Frequency: Quarterly
Consensus: 2%
Previous: 1.4%
Source: US Bureau of Economic Analysis
The US Bureau of Economic Analysis (BEA) releases the Gross Domestic Product (GDP) growth on an annualized basis for each quarter. After publishing the first estimate, the BEA revises the data two more times, with the third release representing the final reading. Usually, the first estimate is the main market mover and a positive surprise is seen as a USD-positive development while a disappointing print is likely to weigh on the greenback. Market participants usually dismiss the second and third releases as they are generally not significant enough to meaningfully alter the growth picture.


© 2000-2026. All rights reserved.
This site is managed by Teletrade D.J. LLC 2351 LLC 2022 (Euro House, Richmond Hill Road, Kingstown, VC0100, St. Vincent and the Grenadines).
The information on this website is for informational purposes only and does not constitute any investment advice.
The company does not serve or provide services to customers who are residents of the US, Canada, Iran, The Democratic People's Republic of Korea, Yemen and FATF blacklisted countries.
Making transactions on financial markets with marginal financial instruments opens up wide possibilities and allows investors who are willing to take risks to earn high profits, carrying a potentially high risk of losses at the same time. Therefore you should responsibly approach the issue of choosing the appropriate investment strategy, taking the available resources into account, before starting trading.
Use of the information: full or partial use of materials from this website must always be referenced to TeleTrade as the source of information. Use of the materials on the Internet must be accompanied by a hyperlink to teletrade.org. Automatic import of materials and information from this website is prohibited.
Please contact our PR department if you have any questions or need assistance at pr@teletrade.global.
transfers