- Analytics
- News and Tools
- Market News
- USD/CHF turns south after mixed US S&P PMIs
USD/CHF turns south after mixed US S&P PMIs
- USD/CHF declined towards 0.8840 and lost the 200-day SMA.
- Markets digest mixed US S&P PMIs released during the European session.
- Bets on cuts by the Fed and SNB remain high.
On Wednesday, the USD/CHF declined by 0.85% to 0.8835, reflecting a loss of momentum as markets process fresh S&P PMI readings from July.
The USD faced bearish pressure after the release of S&P PMIs. Business activity in the US private sector continued expanding at a healthy pace in July. The preliminary S&P Global Composite PMI rose to 55 from 54.8 in June. Although the S&P Global Manufacturing PMI saw a decline to 49.5 from 51.6 in June, the Services PMI increased to 56 from 55.3.
Key indicators including Q2 Gross Domestic Product (GDP) revisions, Personal Consumption Expenditures (PCE), Durable Goods Orders, and University of Michigan sentiment are due this week, which will likely drive the dynamics for USD. Market anticipates core PCE to print at 0.16% MoM, marking an increase in spending by 0.3% MoM. Personal income should also show a similar increase. The Federal Open Market Committee (FOMC) meeting in the following week will also be a focus but no further Fed remarks will be anticipated due to the blackout period so the steady dovish bets on the bank might continue weighing on the pair.
Regarding the Federal Reserve position, markets are betting on a 90% chance of a cut in September, but these odds might sway with this week’s economic data. Evidence of accelerating inflation should drive demand towards the USD while softish figures would give reasons to investors to bet on a more dovish Fed and hence apply selling pressure on the Greenback.
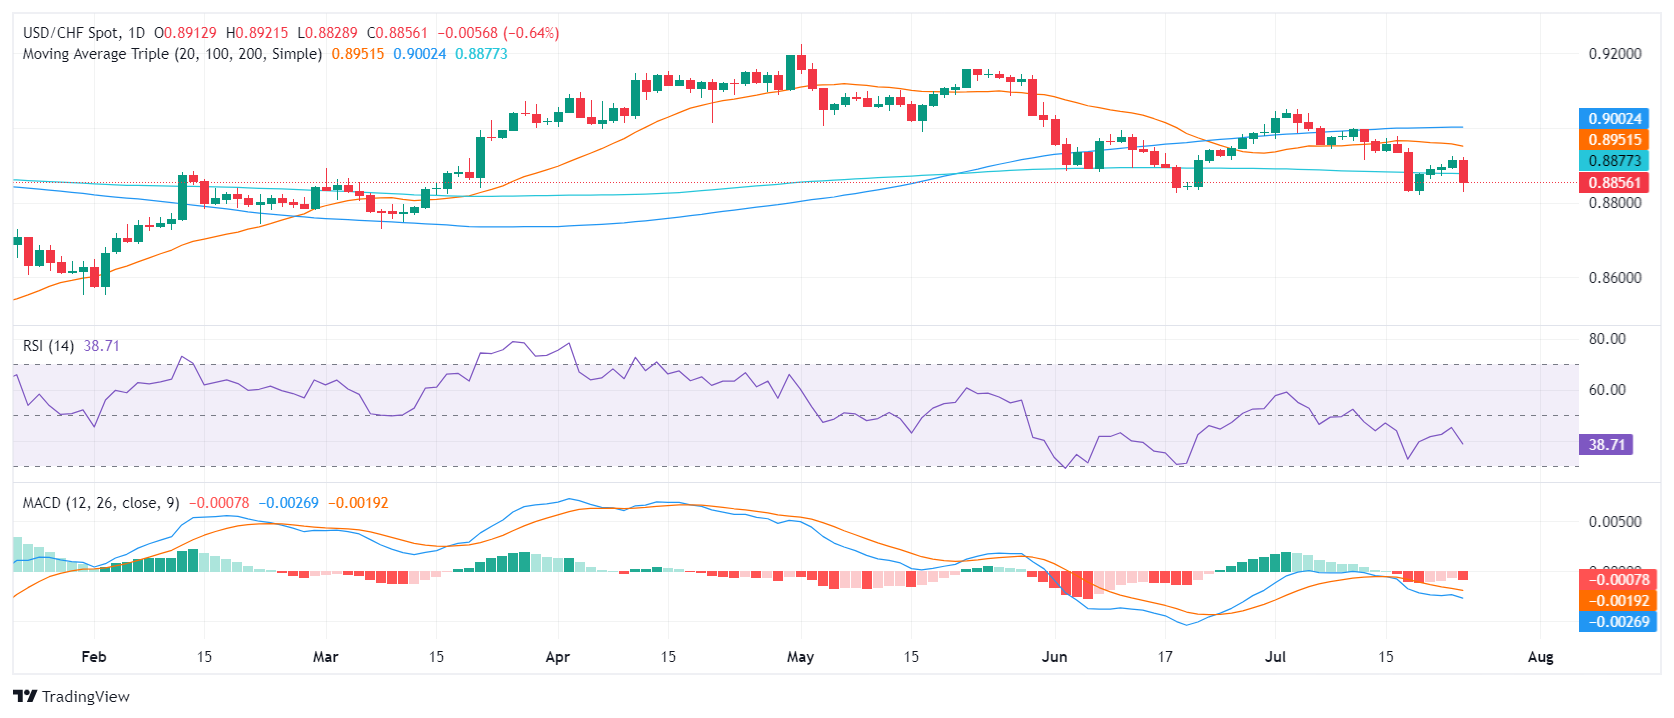
USD/CHF technical analysis
The USD/CHF technical outlook stands bearish, with the pair now below the 20, 100, and 200-day Simple Moving Average (SMA) having lost the latter on Wednesday which was a strong support since June. Meanwhile, technical indicators maintain their negative territory stance.
Key support levels have moved to 0.8830, and 0.8800, whereas resistance levels are at 0.8870, 0.8900, and 0.8930.
USD/CHF daily chart


© 2000-2026. All rights reserved.
This site is managed by Teletrade D.J. LLC 2351 LLC 2022 (Euro House, Richmond Hill Road, Kingstown, VC0100, St. Vincent and the Grenadines).
The information on this website is for informational purposes only and does not constitute any investment advice.
The company does not serve or provide services to customers who are residents of the US, Canada, Iran, The Democratic People's Republic of Korea, Yemen and FATF blacklisted countries.
Making transactions on financial markets with marginal financial instruments opens up wide possibilities and allows investors who are willing to take risks to earn high profits, carrying a potentially high risk of losses at the same time. Therefore you should responsibly approach the issue of choosing the appropriate investment strategy, taking the available resources into account, before starting trading.
Use of the information: full or partial use of materials from this website must always be referenced to TeleTrade as the source of information. Use of the materials on the Internet must be accompanied by a hyperlink to teletrade.org. Automatic import of materials and information from this website is prohibited.
Please contact our PR department if you have any questions or need assistance at pr@teletrade.global.
transfers