- Analytics
- News and Tools
- Market News
- GBP/USD Price Analysis: Slips toward 1.2900, bears eye support at 1.2860
GBP/USD Price Analysis: Slips toward 1.2900, bears eye support at 1.2860
- GBP/USD trades above 1.2900 down 0.13%, approaching key support at 1.2860.
- Bearish momentum observed as RSI slope turns downward, indicating potential further declines.
- Key support levels: 1.2860 (June 12 high) and 1.2779 (July 10 low), with further downside toward the 100-DMA at 1.2678.
The Pound Sterling extended its losses during the North American session against the US Dollar on Tuesday, clinging to the 1.2900 figure after hitting a 7-day high of 1.2887. Traders eye the next key support level of 1.2860. At the time of writing, the GBP/USD trades at 1.2914, down 0.13%.
GBP/USD Price Analysis: Technical outlook
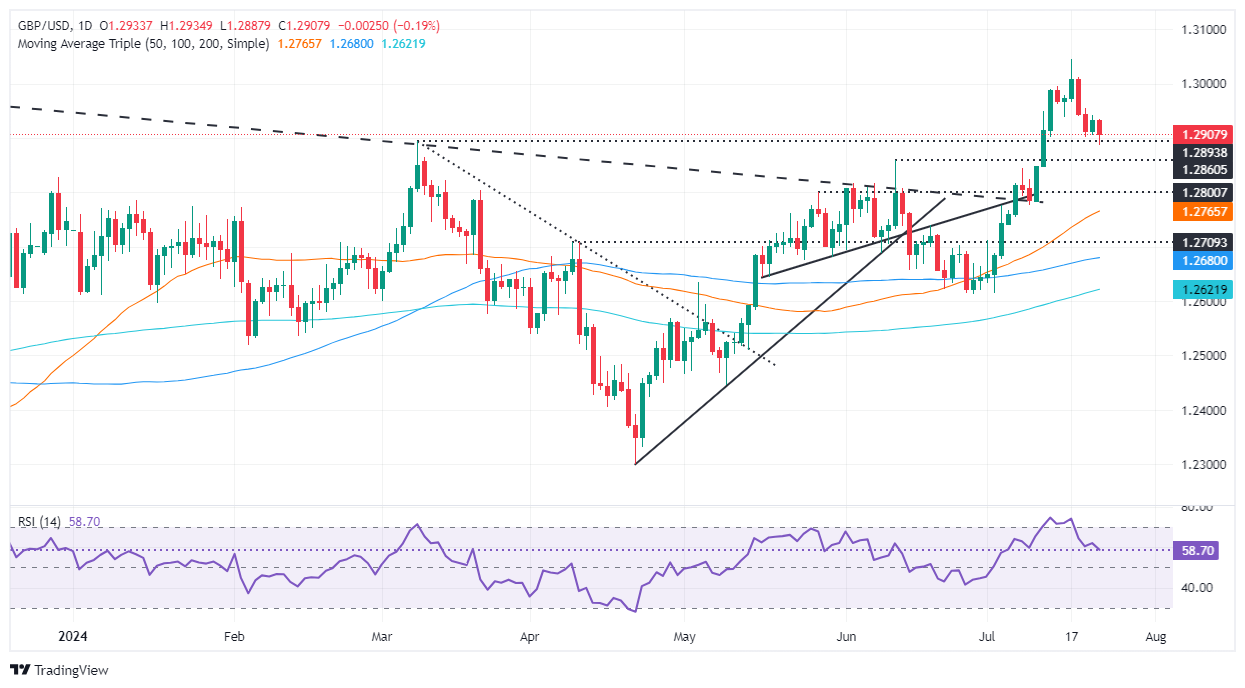
After a five-day consolidation that witnessed the GBP/USD hitting a yearly peak of 1.3044, followed by a tall bearish candle that sent the pair drifting from around 1.3000s toward the 1.2940 mark before tumbling deeper, toward the 1.2900 figure.
Momentum, as depicted by the Relative Strength Index (RSI), remains bullish, but in the near term, sellers have moved in, as the RSI slope aims downwards.
Therefore, the GBP/USD could continue to edge lower, but first, market participants need to push the exchange rate below 1.2900. In that outcome, the next support could be the June 12 high at 1.2860, followed by July 10 low at 1.2779. A further downside is seen at the 100-day moving average (DMA) at 1.2678.
On the flip side, if buyers lift the exchange rate past 1.2940, the next resistance would be 1.3000.
GBP/USD Price Action – Daily Chart
British Pound PRICE Today
The table below shows the percentage change of British Pound (GBP) against listed major currencies today. British Pound was the strongest against the New Zealand Dollar.
| USD | EUR | GBP | JPY | CAD | AUD | NZD | CHF | |
|---|---|---|---|---|---|---|---|---|
| USD | 0.42% | 0.20% | -0.66% | 0.10% | 0.42% | 0.45% | 0.31% | |
| EUR | -0.42% | -0.22% | -1.07% | -0.32% | -0.01% | 0.01% | -0.10% | |
| GBP | -0.20% | 0.22% | -0.85% | -0.09% | 0.23% | 0.24% | 0.10% | |
| JPY | 0.66% | 1.07% | 0.85% | 0.78% | 1.08% | 1.09% | 0.94% | |
| CAD | -0.10% | 0.32% | 0.09% | -0.78% | 0.31% | 0.32% | 0.19% | |
| AUD | -0.42% | 0.01% | -0.23% | -1.08% | -0.31% | 0.02% | -0.13% | |
| NZD | -0.45% | -0.01% | -0.24% | -1.09% | -0.32% | -0.02% | -0.14% | |
| CHF | -0.31% | 0.10% | -0.10% | -0.94% | -0.19% | 0.13% | 0.14% |
The heat map shows percentage changes of major currencies against each other. The base currency is picked from the left column, while the quote currency is picked from the top row. For example, if you pick the British Pound from the left column and move along the horizontal line to the US Dollar, the percentage change displayed in the box will represent GBP (base)/USD (quote).


© 2000-2026. All rights reserved.
This site is managed by Teletrade D.J. LLC 2351 LLC 2022 (Euro House, Richmond Hill Road, Kingstown, VC0100, St. Vincent and the Grenadines).
The information on this website is for informational purposes only and does not constitute any investment advice.
The company does not serve or provide services to customers who are residents of the US, Canada, Iran, The Democratic People's Republic of Korea, Yemen and FATF blacklisted countries.
Making transactions on financial markets with marginal financial instruments opens up wide possibilities and allows investors who are willing to take risks to earn high profits, carrying a potentially high risk of losses at the same time. Therefore you should responsibly approach the issue of choosing the appropriate investment strategy, taking the available resources into account, before starting trading.
Use of the information: full or partial use of materials from this website must always be referenced to TeleTrade as the source of information. Use of the materials on the Internet must be accompanied by a hyperlink to teletrade.org. Automatic import of materials and information from this website is prohibited.
Please contact our PR department if you have any questions or need assistance at pr@teletrade.global.
transfers