- Analytics
- News and Tools
- Market News
- GBP/USD Price Analysis: Holds position above 1.2900; next support at 14-day EMA
GBP/USD Price Analysis: Holds position above 1.2900; next support at 14-day EMA
- GBP/USD could test the upper boundary of the ascending channel around the level of 1.3000.
- Momentum indicators reflect short-term bullish momentum for the pair.
- The 14-day EMA at 1.2885 level could act as immediate support, followed by the lower boundary of the ascending channel.
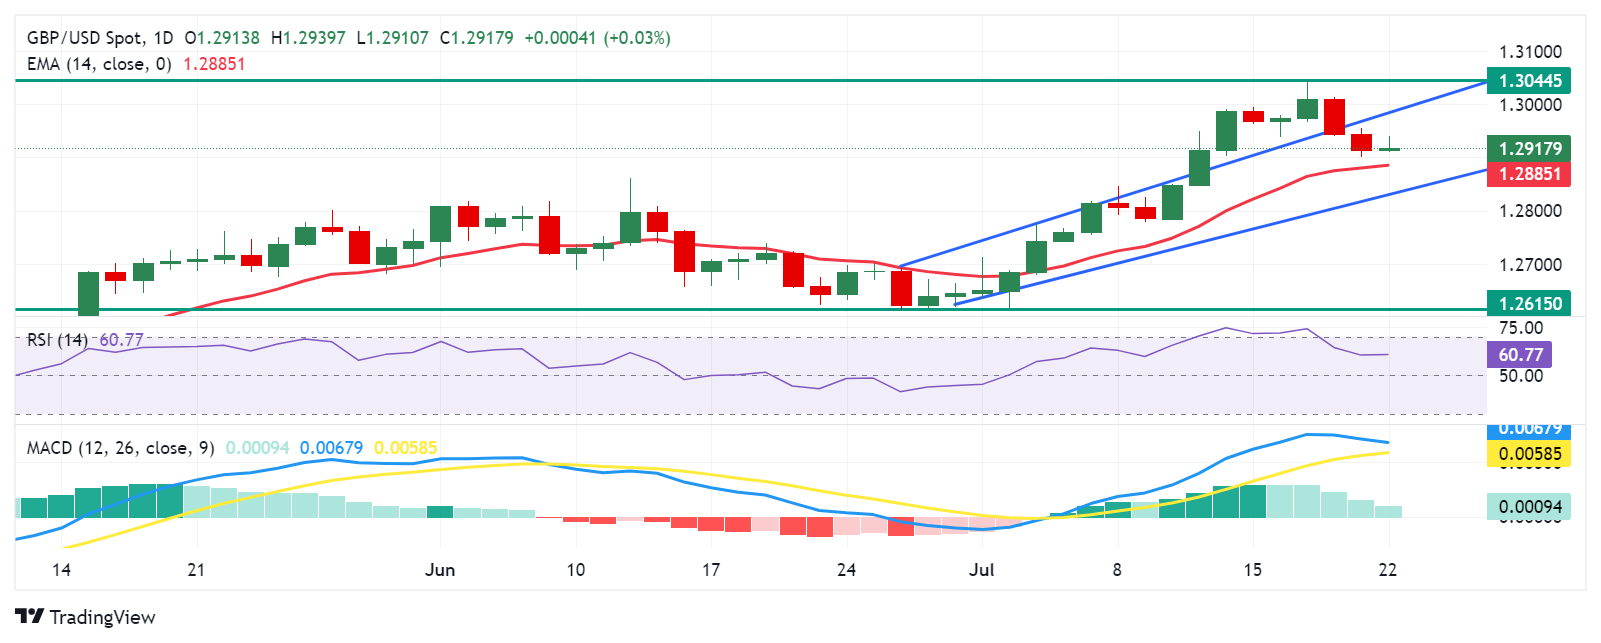
GBP/USD breaks its two-day losses, trading around 1.2920 in Monday's Asian session. The analysis of the daily chart shows the pair lies within an ascending channel, signaling a bullish trend in the pair's price movements.
Moreover, the Moving Average Convergence Divergence (MACD), a momentum indicator, reflects short-term bullish momentum, with the MACD line above the centerline and the signal line. Additionally, the 14-day Relative Strength Index (RSI) sits above the 50 level, confirming the bullish trend.
In terms of resistance, the GBP/USD pair could test the upper boundary of the ascending channel around the psychological level of 1.3000. A breakthrough above this level could provide support for the pair to revisit the yearly high of 1.3044 level recorded on July 17.
On the downside, the immediate support appears at the 14-day Exponential Moving Average (EMA) at the 1.2885 level, followed by the lower threshold of the ascending channel around the 1.2830 level. A break below the latter could lead the GBP/USD pair to navigate the region around the throwback support level of 1.2615.
GBP/USD: Daily Chart
British Pound PRICE Today
The table below shows the percentage change of British Pound (GBP) against listed major currencies today. British Pound was the strongest against the Australian Dollar.
| USD | EUR | GBP | JPY | CAD | AUD | NZD | CHF | |
|---|---|---|---|---|---|---|---|---|
| USD | -0.04% | -0.02% | 0.03% | 0.12% | 0.28% | 0.37% | 0.10% | |
| EUR | 0.04% | 0.02% | 0.05% | 0.12% | 0.36% | 0.36% | 0.08% | |
| GBP | 0.02% | -0.02% | -0.06% | 0.09% | 0.35% | 0.34% | 0.05% | |
| JPY | -0.03% | -0.05% | 0.06% | 0.11% | 0.31% | 0.30% | -0.00% | |
| CAD | -0.12% | -0.12% | -0.09% | -0.11% | 0.26% | 0.26% | -0.02% | |
| AUD | -0.28% | -0.36% | -0.35% | -0.31% | -0.26% | 0.00% | -0.30% | |
| NZD | -0.37% | -0.36% | -0.34% | -0.30% | -0.26% | -0.00% | -0.25% | |
| CHF | -0.10% | -0.08% | -0.05% | 0.00% | 0.02% | 0.30% | 0.25% |
The heat map shows percentage changes of major currencies against each other. The base currency is picked from the left column, while the quote currency is picked from the top row. For example, if you pick the British Pound from the left column and move along the horizontal line to the US Dollar, the percentage change displayed in the box will represent GBP (base)/USD (quote).


© 2000-2026. All rights reserved.
This site is managed by Teletrade D.J. LLC 2351 LLC 2022 (Euro House, Richmond Hill Road, Kingstown, VC0100, St. Vincent and the Grenadines).
The information on this website is for informational purposes only and does not constitute any investment advice.
The company does not serve or provide services to customers who are residents of the US, Canada, Iran, The Democratic People's Republic of Korea, Yemen and FATF blacklisted countries.
Making transactions on financial markets with marginal financial instruments opens up wide possibilities and allows investors who are willing to take risks to earn high profits, carrying a potentially high risk of losses at the same time. Therefore you should responsibly approach the issue of choosing the appropriate investment strategy, taking the available resources into account, before starting trading.
Use of the information: full or partial use of materials from this website must always be referenced to TeleTrade as the source of information. Use of the materials on the Internet must be accompanied by a hyperlink to teletrade.org. Automatic import of materials and information from this website is prohibited.
Please contact our PR department if you have any questions or need assistance at pr@teletrade.global.
transfers