- Analytics
- News and Tools
- Market News
- GBP/USD Price Analysis: Soars past 1.2900 as USD weakens on soft CPI
GBP/USD Price Analysis: Soars past 1.2900 as USD weakens on soft CPI
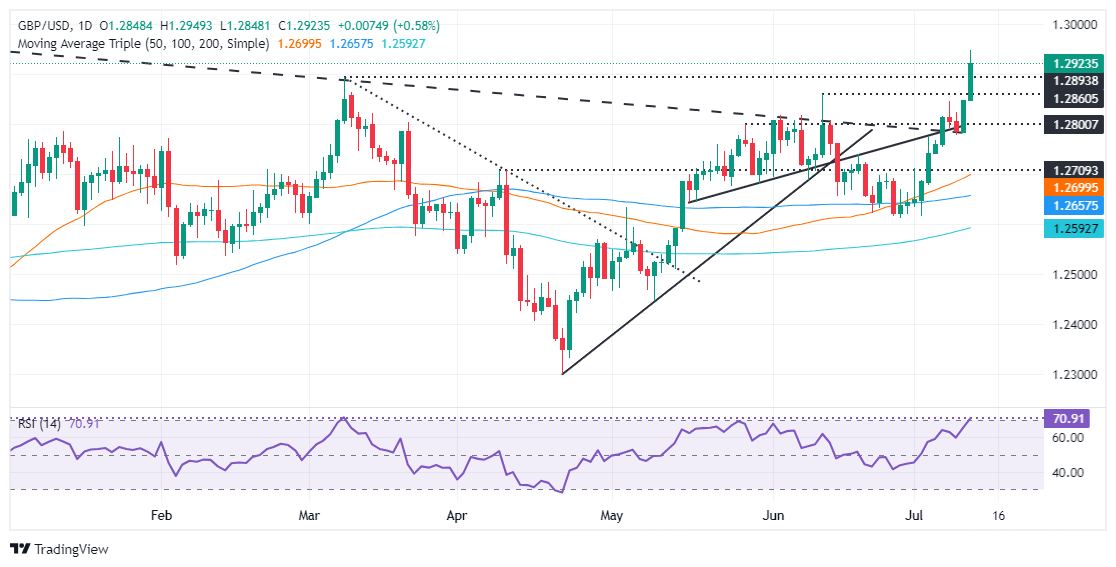
- The GBP/USD climbs sharply as US inflation disappoints; UK economy exceeds expectations.
- Technical outlook remains bullish with RSI near overbought, signaling potential for further gains.
- Key resistance levels: 1.2950, 1.2995, and 1.3142; support at 1.2894, 1.2860, and 1.2800 if pullback occurs.
The Pound Sterling extended its gains on Thursday following better-than-expected data from the UK as the economy expanded above estimates. US inflation missed the mark, coming softer a headwind for the Greenback. Therefore, the GBP/USD trades at 1.2927, up 0.62%.
GBP/USD Price Analysis: Technical outlook
From a technical standpoint, the GBP/USD uptrend remains intact. The pair hit a new year-to-date (YTD) high after clearing the March 8 high of 1.2894.
Momentum favors buyers as the Relative Strength Index (RSI) stands bullish, slightly beneath overbought conditions.
Therefore, if GBP/USD pushes above 1.2950, that could pave the way for testing the July 27, 2023, peak of 1.2995, ahead of testing 1.3000. Further upside is seen once cleared on July 14, 2023, at a high of 1.3142.
On the flip side, if GBP/USD tumbles below 1.2900, the pair could be set for a pullback. The next support would be 1.2894, followed by the June 12 high turned support at 1.2860 and the 1.2800 mark.
GBP/USD Price Action – Daily Chart
British Pound PRICE Today
The table below shows the percentage change of British Pound (GBP) against listed major currencies today. British Pound was the strongest against the US Dollar.
| USD | EUR | GBP | JPY | CAD | AUD | NZD | CHF | |
|---|---|---|---|---|---|---|---|---|
| USD | -0.45% | -0.58% | -1.95% | -0.08% | -0.54% | -0.59% | -0.67% | |
| EUR | 0.45% | -0.12% | -1.50% | 0.37% | -0.09% | -0.13% | -0.22% | |
| GBP | 0.58% | 0.12% | -1.39% | 0.50% | 0.03% | -0.02% | -0.09% | |
| JPY | 1.95% | 1.50% | 1.39% | 1.87% | 1.42% | 1.34% | 1.29% | |
| CAD | 0.08% | -0.37% | -0.50% | -1.87% | -0.48% | -0.51% | -0.59% | |
| AUD | 0.54% | 0.09% | -0.03% | -1.42% | 0.48% | -0.04% | -0.12% | |
| NZD | 0.59% | 0.13% | 0.02% | -1.34% | 0.51% | 0.04% | -0.07% | |
| CHF | 0.67% | 0.22% | 0.09% | -1.29% | 0.59% | 0.12% | 0.07% |
The heat map shows percentage changes of major currencies against each other. The base currency is picked from the left column, while the quote currency is picked from the top row. For example, if you pick the British Pound from the left column and move along the horizontal line to the US Dollar, the percentage change displayed in the box will represent GBP (base)/USD (quote).


© 2000-2026. All rights reserved.
This site is managed by Teletrade D.J. LLC 2351 LLC 2022 (Euro House, Richmond Hill Road, Kingstown, VC0100, St. Vincent and the Grenadines).
The information on this website is for informational purposes only and does not constitute any investment advice.
The company does not serve or provide services to customers who are residents of the US, Canada, Iran, The Democratic People's Republic of Korea, Yemen and FATF blacklisted countries.
Making transactions on financial markets with marginal financial instruments opens up wide possibilities and allows investors who are willing to take risks to earn high profits, carrying a potentially high risk of losses at the same time. Therefore you should responsibly approach the issue of choosing the appropriate investment strategy, taking the available resources into account, before starting trading.
Use of the information: full or partial use of materials from this website must always be referenced to TeleTrade as the source of information. Use of the materials on the Internet must be accompanied by a hyperlink to teletrade.org. Automatic import of materials and information from this website is prohibited.
Please contact our PR department if you have any questions or need assistance at pr@teletrade.global.
transfers