- Analytics
- News and Tools
- Market News
- GBP/USD Price Analysis: Surges past 1.2750 as buyers gain momentum
GBP/USD Price Analysis: Surges past 1.2750 as buyers gain momentum
- GBP/USD rises and surpasses 1.2700 resistance after weak ISM Services PMI.
- Technicals show buyer momentum; RSI remains bullish above 50.
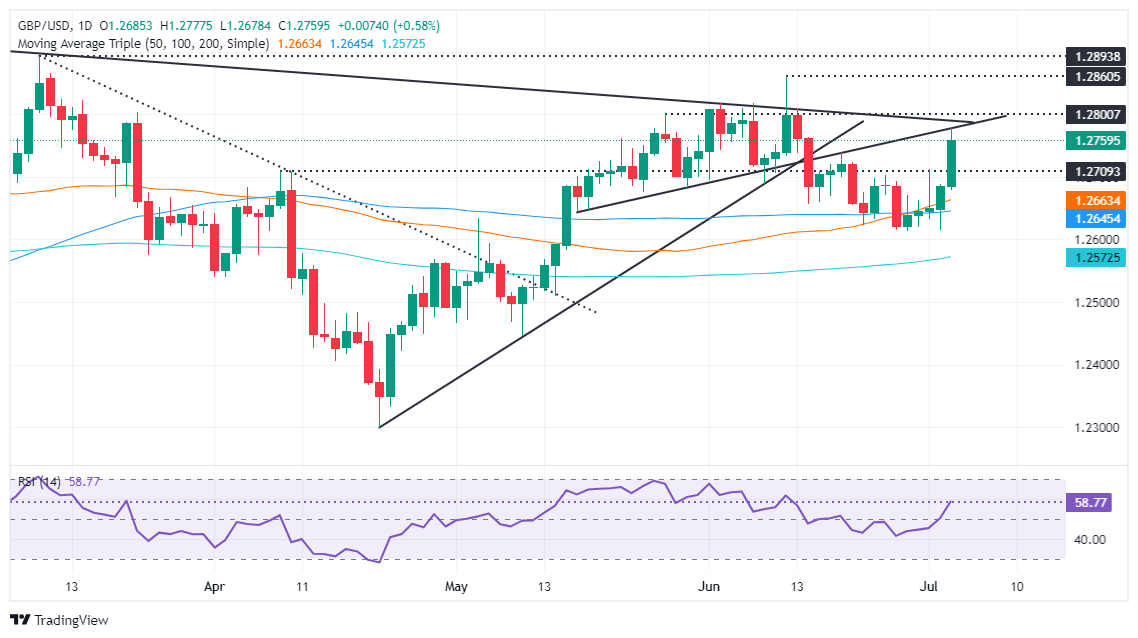
- Resistance levels: 1.2777 (May 27 high), 1.2760/1.2775 (trendline confluence), 1.2800, 1.2860 (June 12 high), 1.2894 (YTD high).
- Support points: 1.2750, 1.2700, 1.2662 (50-DMA), 1.2644 (100-DMA).
The Pound Sterling rallied sharply against the US Dollar following a dismal ISM Services PMI reading, which increased the likelihood that the Federal Reserve will indeed cut rates at least once in 2024. The GBP/USD trades at 1.2772, up 0.69%.
GBP/USD Price Analysis: Technical outlook
The GBP/USD pushed through key resistance seen at 1.2700 and aimed toward a confluence of technical resistance levels, like the May 27 high of 1.2777 and two key resistance trendlines, which confluence at around 1.2760/1.2775.
Momentum favors buyers as depicted by the Relative Strength Index (RSI) bullish above the 50-neutral line, with enough room before turning overbought.
For a bullish continuation, the GBP/USD needs to clear 1.2775 so buyers can test 1.2800. A breach of the latter will expose the June 12 high at 1.2860, ahead of the year-to-date (YTD) high of 1.2894.
On further weakness, if GBP/USD drops below 1.2750 the next demand area is seen at 1.2700. Once surpassed, the 50-day moving average (DMA) emerges as first support at 1.2662, followed by the 100-DMA at 1.2644.
GBP/USD Price Action – Daily Chart
British Pound PRICE Today
The table below shows the percentage change of British Pound (GBP) against listed major currencies today. British Pound was the strongest against the US Dollar.
| USD | EUR | GBP | JPY | CAD | AUD | NZD | CHF | |
|---|---|---|---|---|---|---|---|---|
| USD | -0.51% | -0.57% | -0.08% | -0.34% | -0.74% | -0.60% | -0.33% | |
| EUR | 0.51% | -0.07% | 0.45% | 0.17% | -0.24% | -0.07% | 0.18% | |
| GBP | 0.57% | 0.07% | 0.51% | 0.23% | -0.17% | 0.00% | 0.25% | |
| JPY | 0.08% | -0.45% | -0.51% | -0.27% | -0.67% | -0.51% | -0.25% | |
| CAD | 0.34% | -0.17% | -0.23% | 0.27% | -0.41% | -0.24% | 0.01% | |
| AUD | 0.74% | 0.24% | 0.17% | 0.67% | 0.41% | 0.16% | 0.42% | |
| NZD | 0.60% | 0.07% | -0.00% | 0.51% | 0.24% | -0.16% | 0.26% | |
| CHF | 0.33% | -0.18% | -0.25% | 0.25% | -0.01% | -0.42% | -0.26% |
The heat map shows percentage changes of major currencies against each other. The base currency is picked from the left column, while the quote currency is picked from the top row. For example, if you pick the British Pound from the left column and move along the horizontal line to the US Dollar, the percentage change displayed in the box will represent GBP (base)/USD (quote).


© 2000-2026. All rights reserved.
This site is managed by Teletrade D.J. LLC 2351 LLC 2022 (Euro House, Richmond Hill Road, Kingstown, VC0100, St. Vincent and the Grenadines).
The information on this website is for informational purposes only and does not constitute any investment advice.
The company does not serve or provide services to customers who are residents of the US, Canada, Iran, The Democratic People's Republic of Korea, Yemen and FATF blacklisted countries.
Making transactions on financial markets with marginal financial instruments opens up wide possibilities and allows investors who are willing to take risks to earn high profits, carrying a potentially high risk of losses at the same time. Therefore you should responsibly approach the issue of choosing the appropriate investment strategy, taking the available resources into account, before starting trading.
Use of the information: full or partial use of materials from this website must always be referenced to TeleTrade as the source of information. Use of the materials on the Internet must be accompanied by a hyperlink to teletrade.org. Automatic import of materials and information from this website is prohibited.
Please contact our PR department if you have any questions or need assistance at pr@teletrade.global.
transfers