- Analytics
- News and Tools
- Market News
- Natural Gas sees bearish sentiment not fading soon
Natural Gas sees bearish sentiment not fading soon
- Natural Gas sets forth its losing streak for a seventh day.
- European gas storages are filling up quickly, even with demand picking up.
- The US Dollar index eases ahead of a very full agenda due to Thursday’s public holiday.
Natural Gas price (XNG/USD) still stuck in its correction, adding a seventh day for now to the chronicles. The decline is being fueled again by the outlook that European gas storages are still being filled up, despite the current pickup in energy demand. Europe looks set to head into the next heating season with ample amount of supply to winter through.
Meanwhile, the US Dollar Index (DXY), which tracks the Greenback’s value against six major currencies, easing after US Federal Reserve Bank of Chicago President Austan Goolsbee had a change of heart and advocated for rate cuts during an interview with Bloomberg during the European Central Bank symposium in Sintra, Portugal. The change comes after several weeks of comments from Fed officials all signaling the same message: that rates should be kept steady for longer.
Natural Gas is trading at $2.45 per MMBtu at the time of writing.
Natural Gas news and market movers: Supply is flowing
- Norwegian gas operator GASSCO is showing that gas flows from Norway into Europe are above their 5-day average volume, according to Bloomberg.
- Northwestern Europe will see high temperatures returning by the weekend, which means energy consumption to pick up.
- Reuters reports that the French energy company TotalEnergies has notified South Africa's petroleum regulator of its plans to exit its offshore gas field but has yet to submit a formal request to do so, a source at Petroleum Agency SA said.
Natural Gas Technical Analysis: Still room to go
Natural Gas price has snapped the important 200-day Simple Moving Average (SMA) support near $2.53 and is ekeing out more losses. With that break lower, Gas price is now trading below $2.50. A very wide area is opening up now where gas prices could still sink around 8% lower, before the Relative Strength Index (RSI) reaches the oversold barrier.
The 200-day SMA turns now as a resistance, near $2.53. Once back above there, the pivotal level near $3.08 (March 6, 2023, high) remains key resistance after its false break last week, which is still 20% away. In addition, the red descending trendline in the chart below at $3.10 will also weigh on this area as a cap. Further up, the fresh year-to-date high at $3.16 is the level to beat.
On the downside, the next target could be the pivotal level near $2.13, with interim support by the 100-day SMA near $2.25
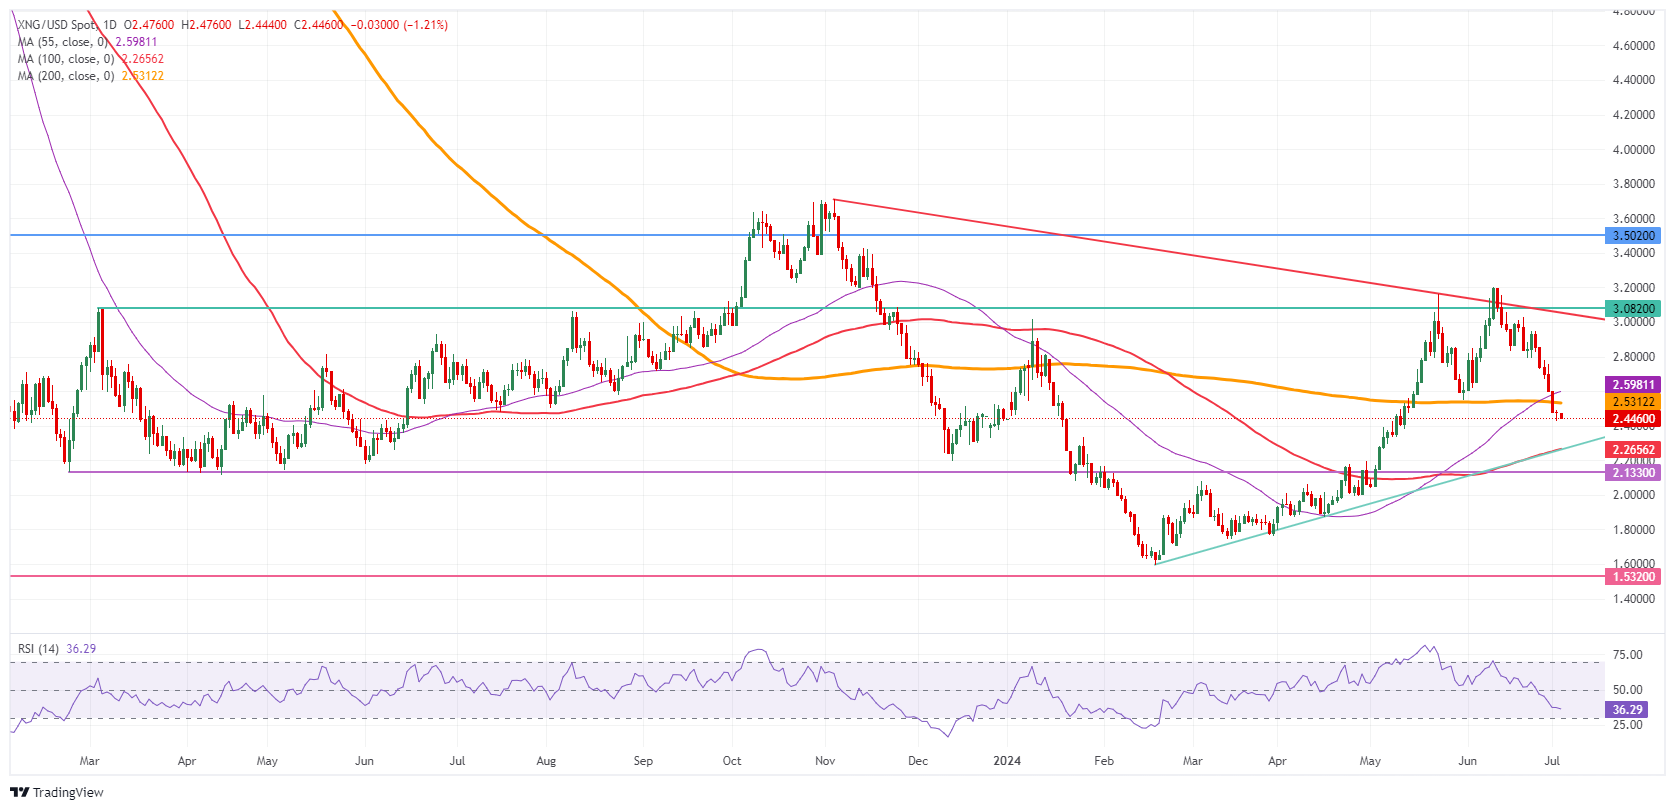
Natural Gas: Daily Chart
Natural Gas FAQs
Supply and demand dynamics are a key factor influencing Natural Gas prices, and are themselves influenced by global economic growth, industrial activity, population growth, production levels, and inventories. The weather impacts Natural Gas prices because more Gas is used during cold winters and hot summers for heating and cooling. Competition from other energy sources impacts prices as consumers may switch to cheaper sources. Geopolitical events are factors as exemplified by the war in Ukraine. Government policies relating to extraction, transportation, and environmental issues also impact prices.
The main economic release influencing Natural Gas prices is the weekly inventory bulletin from the Energy Information Administration (EIA), a US government agency that produces US gas market data. The EIA Gas bulletin usually comes out on Thursday at 14:30 GMT, a day after the EIA publishes its weekly Oil bulletin. Economic data from large consumers of Natural Gas can impact supply and demand, the largest of which include China, Germany and Japan. Natural Gas is primarily priced and traded in US Dollars, thus economic releases impacting the US Dollar are also factors.
The US Dollar is the world’s reserve currency and most commodities, including Natural Gas are priced and traded on international markets in US Dollars. As such, the value of the US Dollar is a factor in the price of Natural Gas, because if the Dollar strengthens it means less Dollars are required to buy the same volume of Gas (the price falls), and vice versa if USD strengthens.


© 2000-2026. All rights reserved.
This site is managed by Teletrade D.J. LLC 2351 LLC 2022 (Euro House, Richmond Hill Road, Kingstown, VC0100, St. Vincent and the Grenadines).
The information on this website is for informational purposes only and does not constitute any investment advice.
The company does not serve or provide services to customers who are residents of the US, Canada, Iran, The Democratic People's Republic of Korea, Yemen and FATF blacklisted countries.
Making transactions on financial markets with marginal financial instruments opens up wide possibilities and allows investors who are willing to take risks to earn high profits, carrying a potentially high risk of losses at the same time. Therefore you should responsibly approach the issue of choosing the appropriate investment strategy, taking the available resources into account, before starting trading.
Use of the information: full or partial use of materials from this website must always be referenced to TeleTrade as the source of information. Use of the materials on the Internet must be accompanied by a hyperlink to teletrade.org. Automatic import of materials and information from this website is prohibited.
Please contact our PR department if you have any questions or need assistance at pr@teletrade.global.
transfers