- Analytics
- News and Tools
- Market News
- Silver Price Analysis: Silver continues battling higher within descending channel
Silver Price Analysis: Silver continues battling higher within descending channel
- Silver is recovering within a falling channel.
- It has met tough resistance at the level of the 50 and 100-period SMAs on the 4-hour chart.
- There are bullish signs but a breakout of the channel would be a prerequisite for a more confident stance.
Silver (XAG/USD) continues recovering within a descending channel. The precious metal found support at the June 26 and 13 lows (around 26.88). Its first attempt to break above the cluster of Moving Averages in the mid $29.40s failed but after its pullback on July 1 it has started creeping higher again.
Silver 4-hour Chart
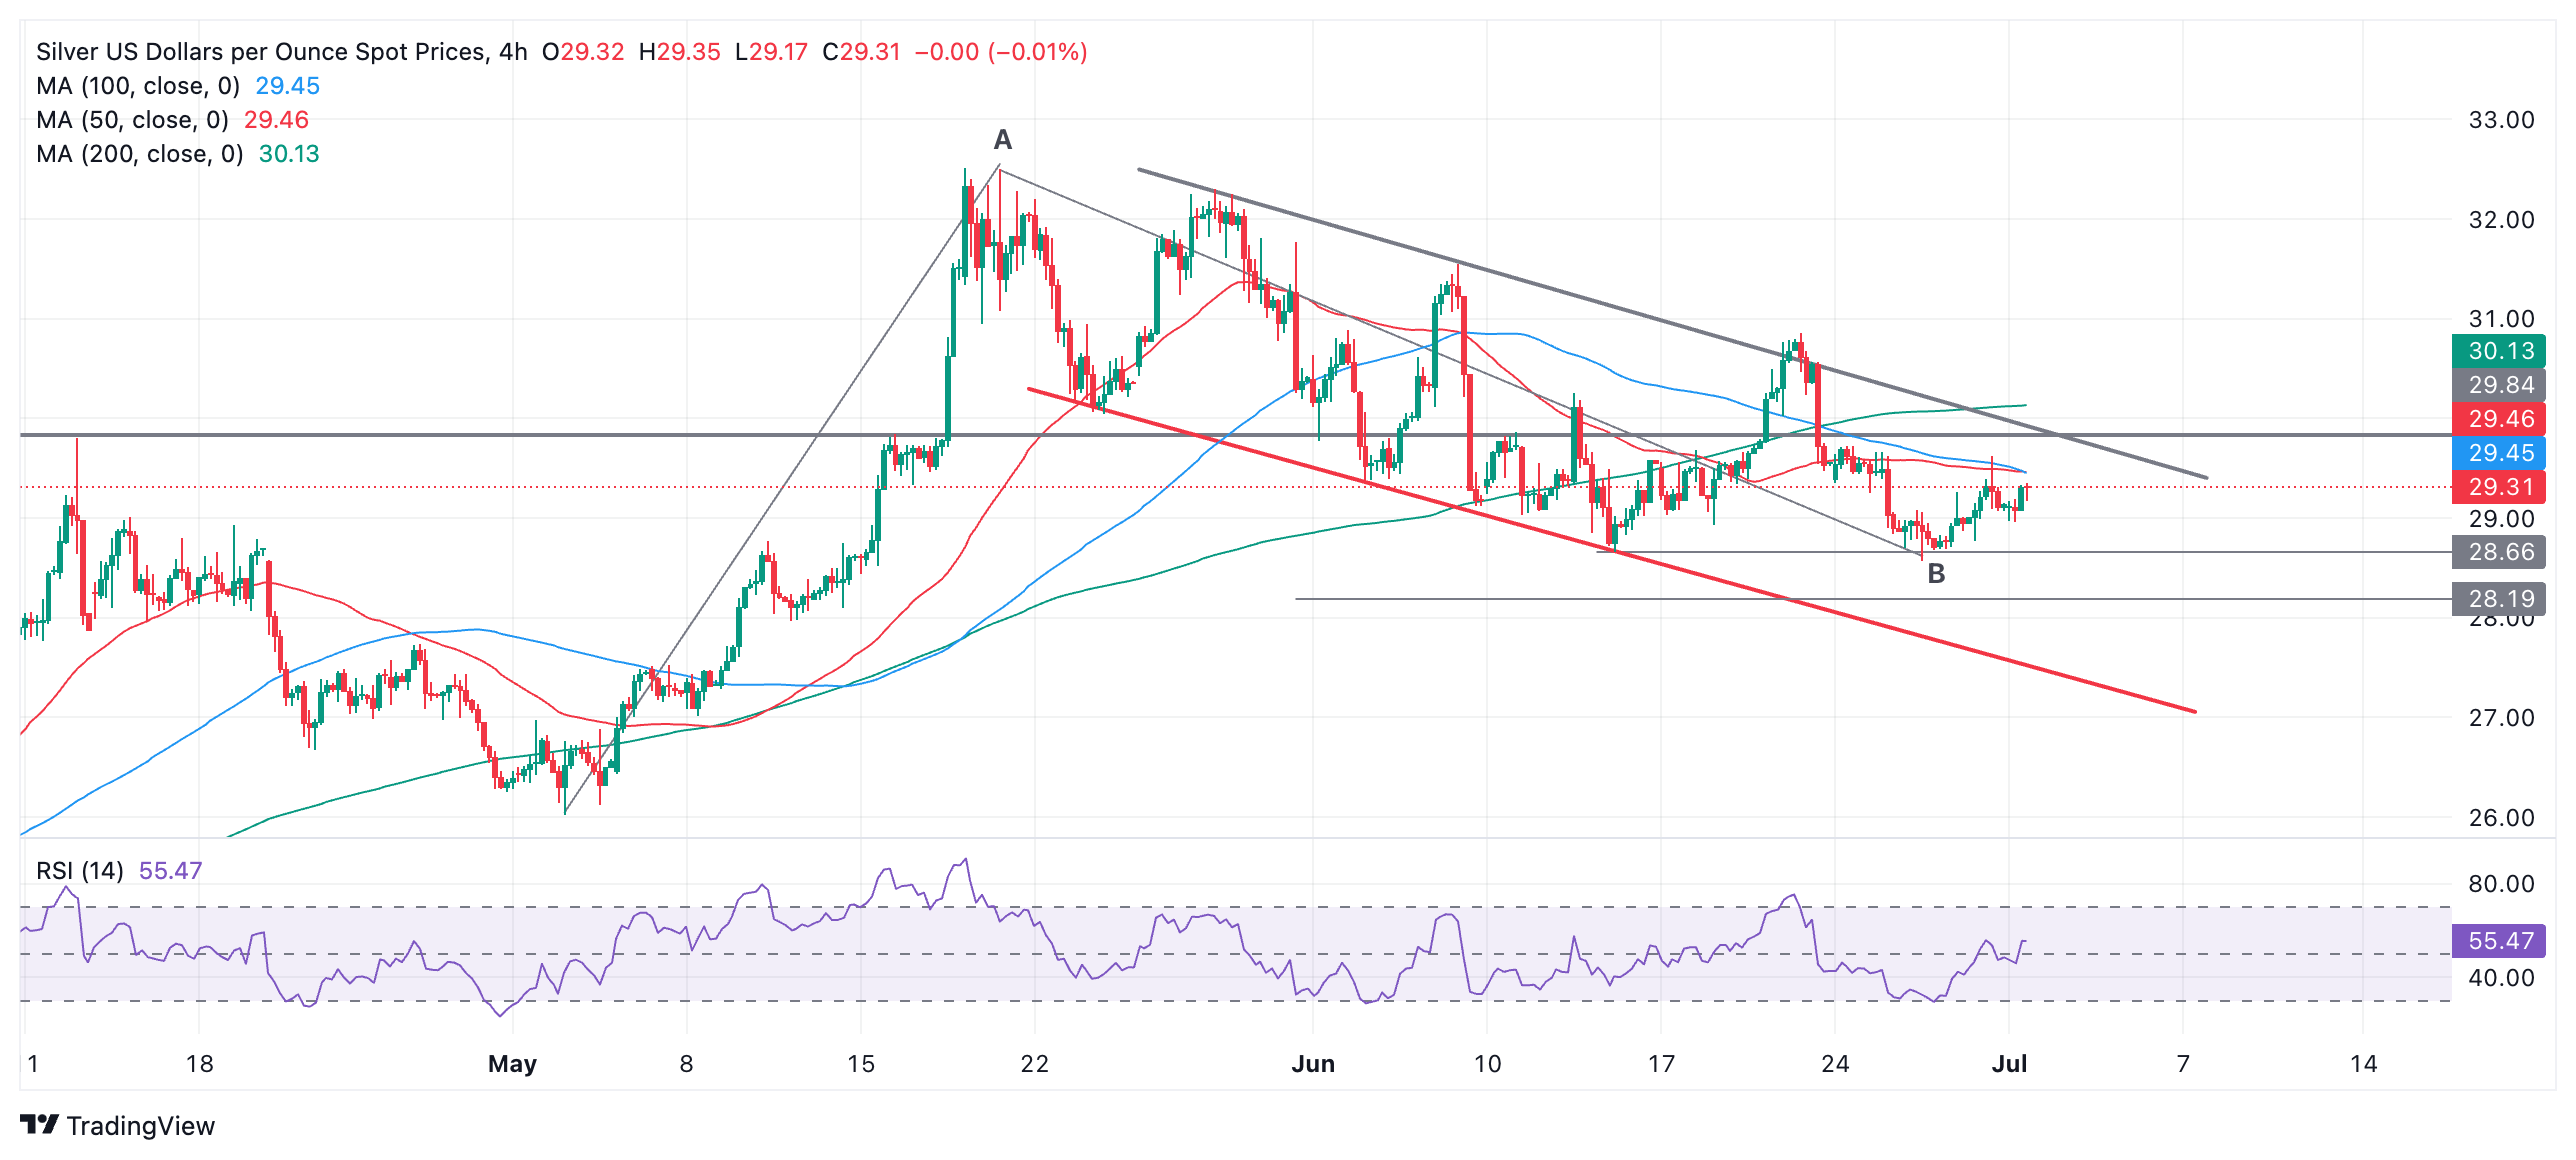
It is now debatable whether Silver is still in a bearish short-term trend, which means there is no longer a downside bias. However, it is in a falling channel which does add a bearish tone to the charts.
Therefore, if price falls back below $28.57, the June 26 low, it would reconfirm the downside bias, with the next target lying at the lower channel line, at around $27.50.
If Silver continues recovering and breaks on a closing basis above the 50 and 100 SMAs, however, it would indicate a continuation higher to the upper channel line at around $29.90. This would be a critical crossroads for the pair. It is also a major resistance level at the top of a four-year consolidation zone. A decisive break above would indicate the start of a new short-term uptrend.
A decisive break would be one accompanied by a long green up candle that broke clearly above the level and closed near its high or three green candles in a row that broke above the level.
Silver temporarily broke out of the top of the falling channel on June 20, and although it quickly fell back, the fact it breached the integrity of the channel, albeit temporarily, indicates the upper channel line has been weakened and is more likely to give way again. This also adds a slightly bullish note to the charts.
The rally during the start of May also gives the chart a further bullish aspect. One view could suggest this rally was a wave “A” and the whole of the falling channel is the second large wave, or wave “B”, of a Measured Move (MM) pattern higher. MMs are three-wave zig-zags. If so, this could indicate a move of a similar length could unfold to the upside, in a wave “C”. Such a move, if it materializes – and it’s too early to say yet – would probably take Silver up to around the $33.00 mark.


© 2000-2026. All rights reserved.
This site is managed by Teletrade D.J. LLC 2351 LLC 2022 (Euro House, Richmond Hill Road, Kingstown, VC0100, St. Vincent and the Grenadines).
The information on this website is for informational purposes only and does not constitute any investment advice.
The company does not serve or provide services to customers who are residents of the US, Canada, Iran, The Democratic People's Republic of Korea, Yemen and FATF blacklisted countries.
Making transactions on financial markets with marginal financial instruments opens up wide possibilities and allows investors who are willing to take risks to earn high profits, carrying a potentially high risk of losses at the same time. Therefore you should responsibly approach the issue of choosing the appropriate investment strategy, taking the available resources into account, before starting trading.
Use of the information: full or partial use of materials from this website must always be referenced to TeleTrade as the source of information. Use of the materials on the Internet must be accompanied by a hyperlink to teletrade.org. Automatic import of materials and information from this website is prohibited.
Please contact our PR department if you have any questions or need assistance at pr@teletrade.global.
transfers