- Analytics
- News and Tools
- Market News
- USD/JPY Price Analysis: Hits 38-year high at around 160.80s
USD/JPY Price Analysis: Hits 38-year high at around 160.80s
- USD/JPY reaches multi-year peak at 160.83, surpassing key 160.00 level amid USD strength.
- Technicals show strong uptrend with overbought RSI, buying momentum strong.
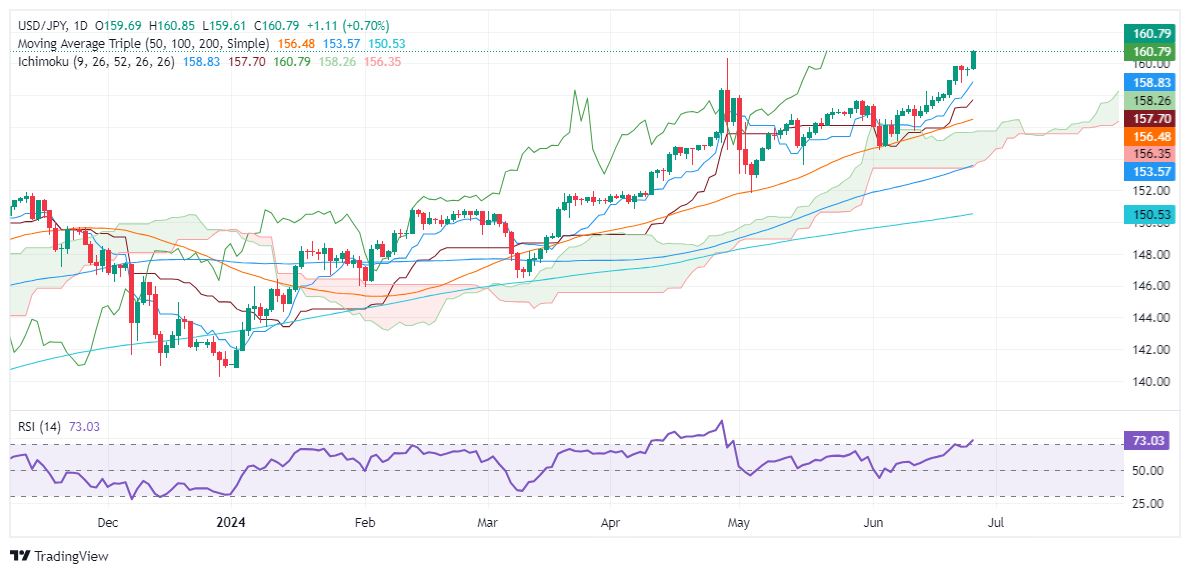
- Resistance levels: 161.00, 162.00, 164.87 (Nov 1986 high), 178 (Apr 1986 high).
- Support found at 158.75 (June 24 low), Tenkan-Sen at 157.82, Senkou Span A at 157.53, Kijun-Sen at 157.24.
The USD/JPY rallied sharply during Wednesday’s session after the pair hit a 38-year high past the 160.00 psychological figure, seen as the line of the sand for Japanese authorities and the Japanese Yen to intervene in the FX space. Nevertheless, failure to do it prompted US dollar bulls to push the exchange rate higher, and at the time of writing, the pair traded at 160.83, which was up 0.73%.
USD/JPY Price Analysis: Technical outlook
The USD/JPY is upward biased and extended its gains past the psychological 160.00 barrier for the second time since April 29, when the pair printed a year-to-date (YTD) high of 160.32. This has reignited fears that Japanese authorities or the Bank of Japan (BoJ) could step into the plate to halt Yen’s depreciation.
Momentum favors buyers, with the Relative Strength Index (RSI) at overbought conditions. However, due to the strength of the uptrend, most technicians use 80 as “extreme” overextended conditions.
The next resistance would be the psychological levels of 161.00, 162.00, and so forth, ahead of testing November’s 1986 high of 164.87, followed by April's 1986 high of 178.
Conversely, if USD/JPY drops below 160.00, the first support would be June’s 24 low of 158.75, followed by the Tenkan-Sen at 157.82. Once those levels are cleared, the next stop would be the Senkou Span A at 157.53, and then the Kijun-Sen at 157.24.
USD/JPY Price Action – Daily Chart


© 2000-2026. All rights reserved.
This site is managed by Teletrade D.J. LLC 2351 LLC 2022 (Euro House, Richmond Hill Road, Kingstown, VC0100, St. Vincent and the Grenadines).
The information on this website is for informational purposes only and does not constitute any investment advice.
The company does not serve or provide services to customers who are residents of the US, Canada, Iran, The Democratic People's Republic of Korea, Yemen and FATF blacklisted countries.
Making transactions on financial markets with marginal financial instruments opens up wide possibilities and allows investors who are willing to take risks to earn high profits, carrying a potentially high risk of losses at the same time. Therefore you should responsibly approach the issue of choosing the appropriate investment strategy, taking the available resources into account, before starting trading.
Use of the information: full or partial use of materials from this website must always be referenced to TeleTrade as the source of information. Use of the materials on the Internet must be accompanied by a hyperlink to teletrade.org. Automatic import of materials and information from this website is prohibited.
Please contact our PR department if you have any questions or need assistance at pr@teletrade.global.
transfers