- Analytics
- News and Tools
- Market News
- EUR/USD Price Analysis: Falls to near 1.0700 before a throwback support
EUR/USD Price Analysis: Falls to near 1.0700 before a throwback support
- The EUR/USD pair could test a throwback support at the 1.0670 level.
- The daily chart suggests a bearish bias as the pair consolidates within the descending channel.
- The immediate resistance appears at the 14-day EMA at the level of 1.0743.
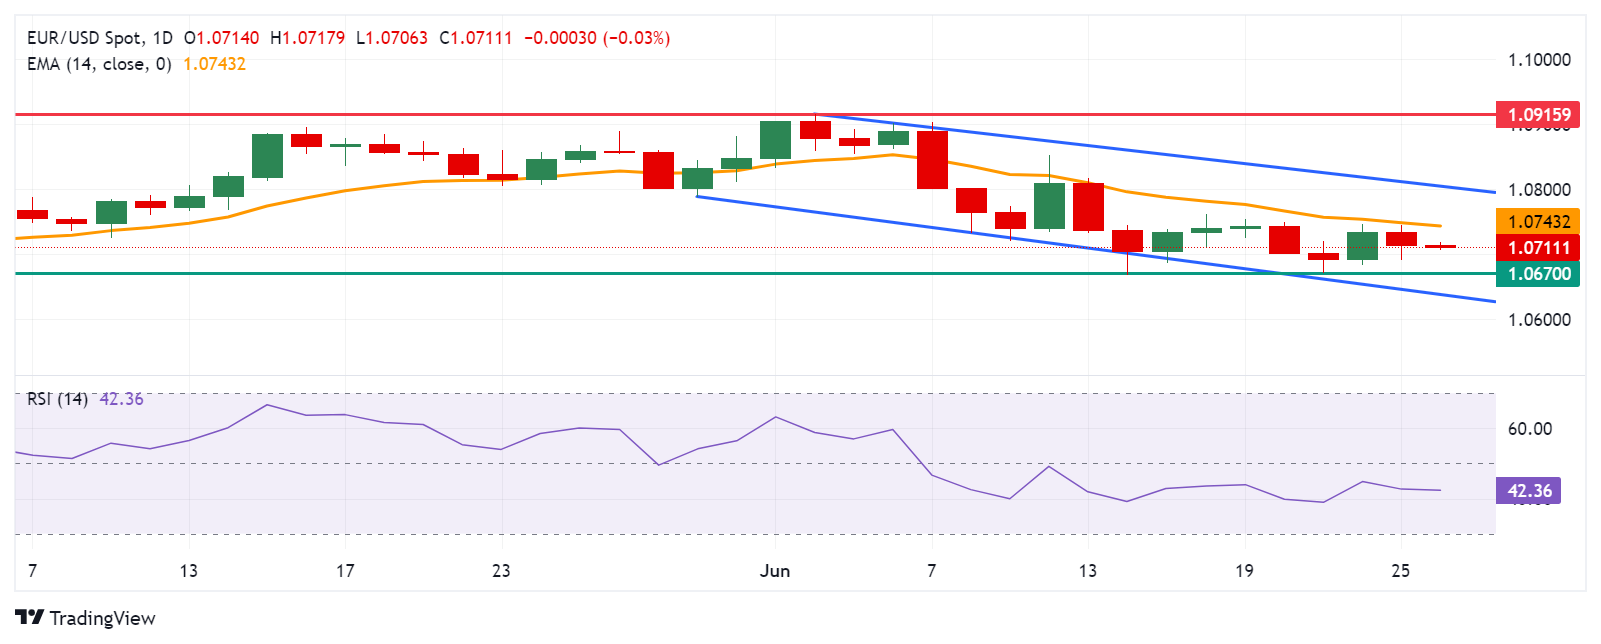
EUR/USD extends its losses for the second consecutive day, trading around 1.0710 during the Asian session on Wednesday. A technical analysis of a daily chart suggests a bearish bias for the pair, as it consolidates within the descending channel.
Additionally, the momentum indicator 14-day Relative Strength Index (RSI) is positioned below the 50 level, suggesting a confirmation of a bearish bias for the EUR/USD pair.
The EUR/USD pair could find immediate support at the psychological level of 1.0700. A break below this level could exert downward pressure on the pair to test the throwback support at the level of 1.0670.
Further decline would strengthen the bearish bias and the pair could navigate the region around the lower boundary of the descending channel near the 1.0640 level.
On the upside, the EUR/USD pair could meet the immediate barrier at the 14-day Exponential Moving Average (EMA) at the level of 1.0743. A breakthrough above this level could lead the pair to test the area around the psychological level of 1.0800 and the upper boundary of the descending channel nearing the level of 1.0810.
Further resistance appears at the vicinity of the significant level of 1.0900 and a three-month high at 1.0915, which was recorded on June 4.
EUR/USD: Daily Chart


© 2000-2026. All rights reserved.
This site is managed by Teletrade D.J. LLC 2351 LLC 2022 (Euro House, Richmond Hill Road, Kingstown, VC0100, St. Vincent and the Grenadines).
The information on this website is for informational purposes only and does not constitute any investment advice.
The company does not serve or provide services to customers who are residents of the US, Canada, Iran, The Democratic People's Republic of Korea, Yemen and FATF blacklisted countries.
Making transactions on financial markets with marginal financial instruments opens up wide possibilities and allows investors who are willing to take risks to earn high profits, carrying a potentially high risk of losses at the same time. Therefore you should responsibly approach the issue of choosing the appropriate investment strategy, taking the available resources into account, before starting trading.
Use of the information: full or partial use of materials from this website must always be referenced to TeleTrade as the source of information. Use of the materials on the Internet must be accompanied by a hyperlink to teletrade.org. Automatic import of materials and information from this website is prohibited.
Please contact our PR department if you have any questions or need assistance at pr@teletrade.global.
transfers