- Analytics
- News and Tools
- Market News
- NZD/JPY Price Analysis: Cross continues consolidating, still above 97.00
NZD/JPY Price Analysis: Cross continues consolidating, still above 97.00
- NZD/JPY remains stable at 97.60, as the pair starts consolidating.
- The 20-day SMA at 96.30 offers considerable support against a potential correction.
- Despite the consolidation phase, the bullish outlook persists, eyeing the next key resistance at 98.00.
On Tuesday, the NZD/JPY cross appeared to have entered a consolidation phase, retaining its footing at the fresh high of 97.80. Flaunting its resilience, the pair maintained its strong support at the 20-day Simple Moving Average (SMA) of 96.30, while hovering at high levels not witnessed since July 2007. The bullish outlook remains undisputed, despite the necessity for a healthy correction to address the overbought conditions.
The daily Relative Strength Index (RSI) currently stands at 66, a decline from Monday's 68, hinting at an impending downtrend. However, it remains within a positive territory devoid of extreme conditions. Meanwhile, the Moving Average Convergence Divergence (MACD) prints flat red bars which implies diminishing buying pressure as a shift towards a potential consolidation or correction phase.
NZD/JPY daily chart
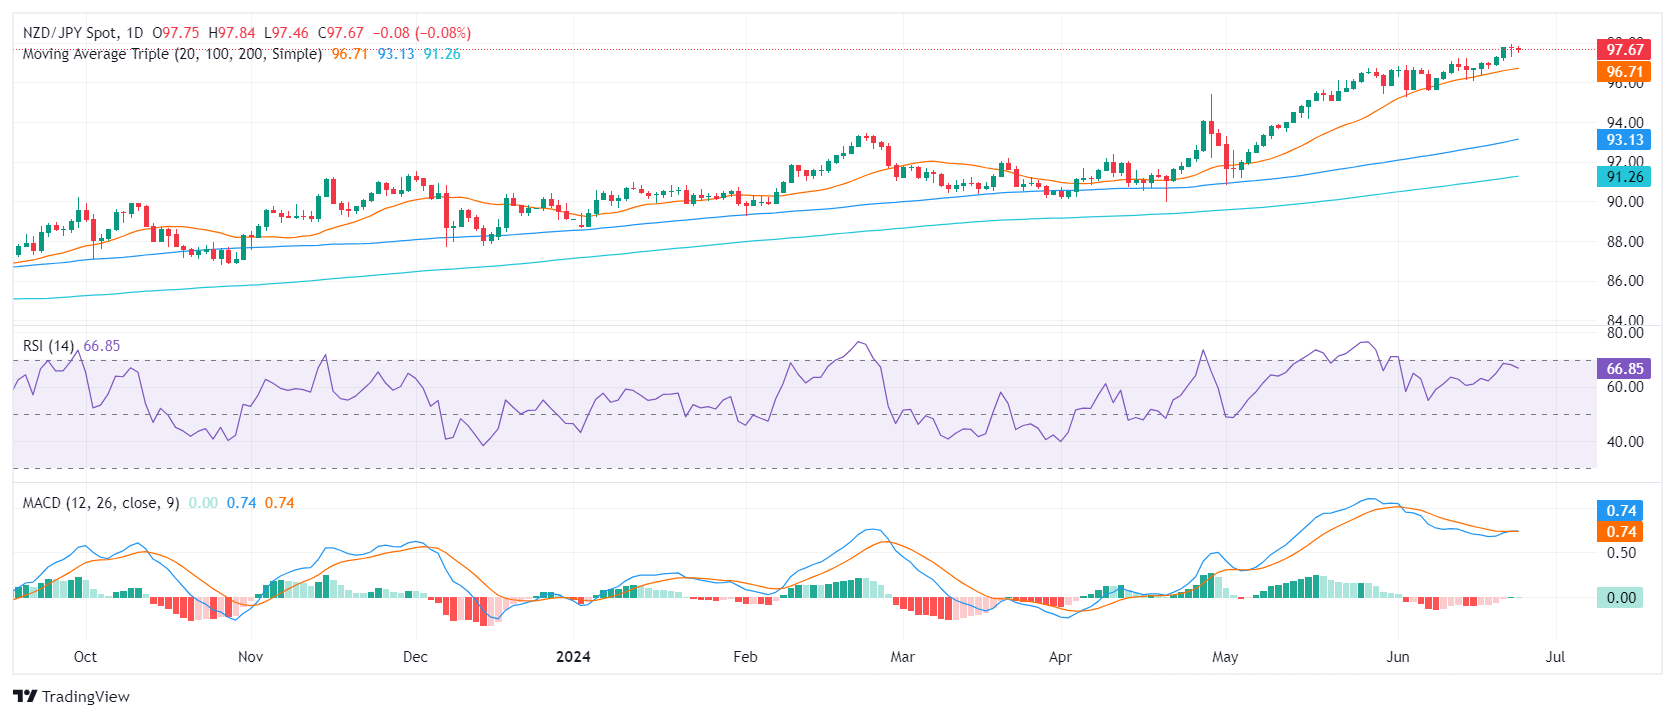
The steady grip of bulls above the 20-day SMA illustrates their strength, coupled with the technical indicators nearing overbought status, this further cements the positive technical outlook of the Kiwi against the Yen. However, overbought conditions necessitate a healthy correction or consolidation to ensure sustained upward momentum.
As investors anticipate subsequent trading sessions, the focus is on the immediate support at 97.00 and the resistance target at 98.00. A sustained break above the consolidation range could validate further upside while slipping below the 20-day SMA could indicate a deeper correction.


© 2000-2026. All rights reserved.
This site is managed by Teletrade D.J. LLC 2351 LLC 2022 (Euro House, Richmond Hill Road, Kingstown, VC0100, St. Vincent and the Grenadines).
The information on this website is for informational purposes only and does not constitute any investment advice.
The company does not serve or provide services to customers who are residents of the US, Canada, Iran, The Democratic People's Republic of Korea, Yemen and FATF blacklisted countries.
Making transactions on financial markets with marginal financial instruments opens up wide possibilities and allows investors who are willing to take risks to earn high profits, carrying a potentially high risk of losses at the same time. Therefore you should responsibly approach the issue of choosing the appropriate investment strategy, taking the available resources into account, before starting trading.
Use of the information: full or partial use of materials from this website must always be referenced to TeleTrade as the source of information. Use of the materials on the Internet must be accompanied by a hyperlink to teletrade.org. Automatic import of materials and information from this website is prohibited.
Please contact our PR department if you have any questions or need assistance at pr@teletrade.global.
transfers