- Analytics
- News and Tools
- Market News
- Silver Price Analysis: XAG/USD collapses below 50-DMA as surrenders $29.00
Silver Price Analysis: XAG/USD collapses below 50-DMA as surrenders $29.00
- Silver drops to $28.90, under 50-day MA, after Fed's Bowman's hawkish remarks.
- Bearish pattern evident, with RSI suggesting further downside.
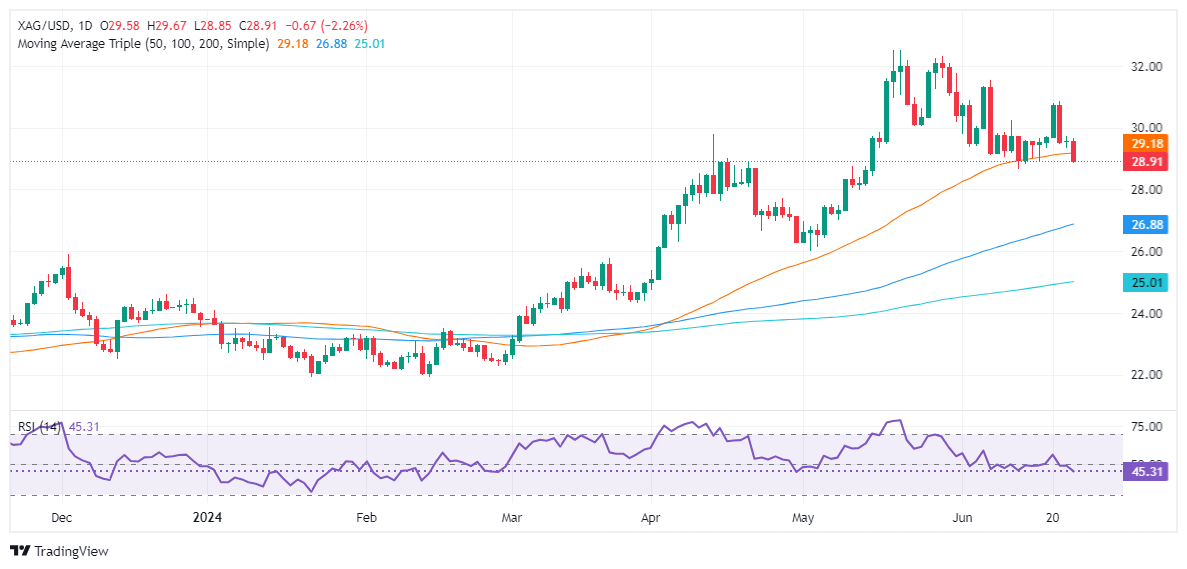
- Support levels: $28.74 (May 18 high), $28.28 (June 10 high), $28.00, $26.82 (100-DMA).
- Resistance points: $29.16 (50-DMA), $31.54 (June 7 high), $32.00, $32.51 (YTD high).
Silver price collapsed on Tuesday amid a strong US Dollar, sponsored by hawkish comments by Fed Governor Michelle Bowman. Although US Treasury yields were unchanged, the Greenback registered moderate gains, which weighed on the grey metal. The XAG/USD trades at $28.90, below its 50-day moving average (DMA) for the first time since March 1.
XAG/USD Price Analysis: Technical outlook
The grey metal formed a ‘bearish engulfing’ chart pattern last week, which opened the door for further downside. Momentum favors sellers, as shown by the Relative Strength Index (RSI), which stands bearish. This suggests that Silver could extend its losses.
Hence, the XAG/USD's first support would be the May 18, 2021, high turned support at $28.74, ahead of challenging June 10, 2021, high at $28.28. Key support levels lie underneath, like the $28.00 figure, followed by the 100-DMA at $26.82.
Conversely, if XAG/USD resumes its uptrend, the next resistance level would be the 50-day moving average (DMA) at $29.16. Once surpassed, the next stop is the June 7 high of $31.54. Clearing this level would target $32.00 before challenging the year-to-date (YTD) high of $32.51.
XAG/USD Price Action – Daily Chart


© 2000-2026. All rights reserved.
This site is managed by Teletrade D.J. LLC 2351 LLC 2022 (Euro House, Richmond Hill Road, Kingstown, VC0100, St. Vincent and the Grenadines).
The information on this website is for informational purposes only and does not constitute any investment advice.
The company does not serve or provide services to customers who are residents of the US, Canada, Iran, The Democratic People's Republic of Korea, Yemen and FATF blacklisted countries.
Making transactions on financial markets with marginal financial instruments opens up wide possibilities and allows investors who are willing to take risks to earn high profits, carrying a potentially high risk of losses at the same time. Therefore you should responsibly approach the issue of choosing the appropriate investment strategy, taking the available resources into account, before starting trading.
Use of the information: full or partial use of materials from this website must always be referenced to TeleTrade as the source of information. Use of the materials on the Internet must be accompanied by a hyperlink to teletrade.org. Automatic import of materials and information from this website is prohibited.
Please contact our PR department if you have any questions or need assistance at pr@teletrade.global.
transfers