- Analytics
- News and Tools
- Market News
- NZD/USD Price Analysis: Kiwi trades sideways, outlook hinges on SMA convergence
NZD/USD Price Analysis: Kiwi trades sideways, outlook hinges on SMA convergence
- NZD/USD moved sideways with mild losses while pair remains under the 20-day SMA.
- The Kiwi's outlook continues to skew bearish in the short term while the 100 and 200-day SMAs converge at 0.6070 potentially brightening the broader picture.
- Despite the bearish sentiment, a break above 0.6150, the position of the 20-day SMA, would change direction.
On Tuesday, the NZD/USD continues to trade sideways with minor losses. Sellers have consolidated their stance and taken the pair under the 20-day Simple Moving Average (SMA). Despite this, the convergence of the 100 and 200-day SMAs at 0.6070 could paint a more optimistic picture if they complete a bullish crossover.
The Relative Strength Index (RSI) on the daily chart fell to 49, suggesting more bearishness. Still, despite the downward shift, the RSI remains near the neutral zone. The Moving Average Convergence Divergence (MACD) remains flat with red bars, showcasing a seller's market.
NZD/USD daily chart
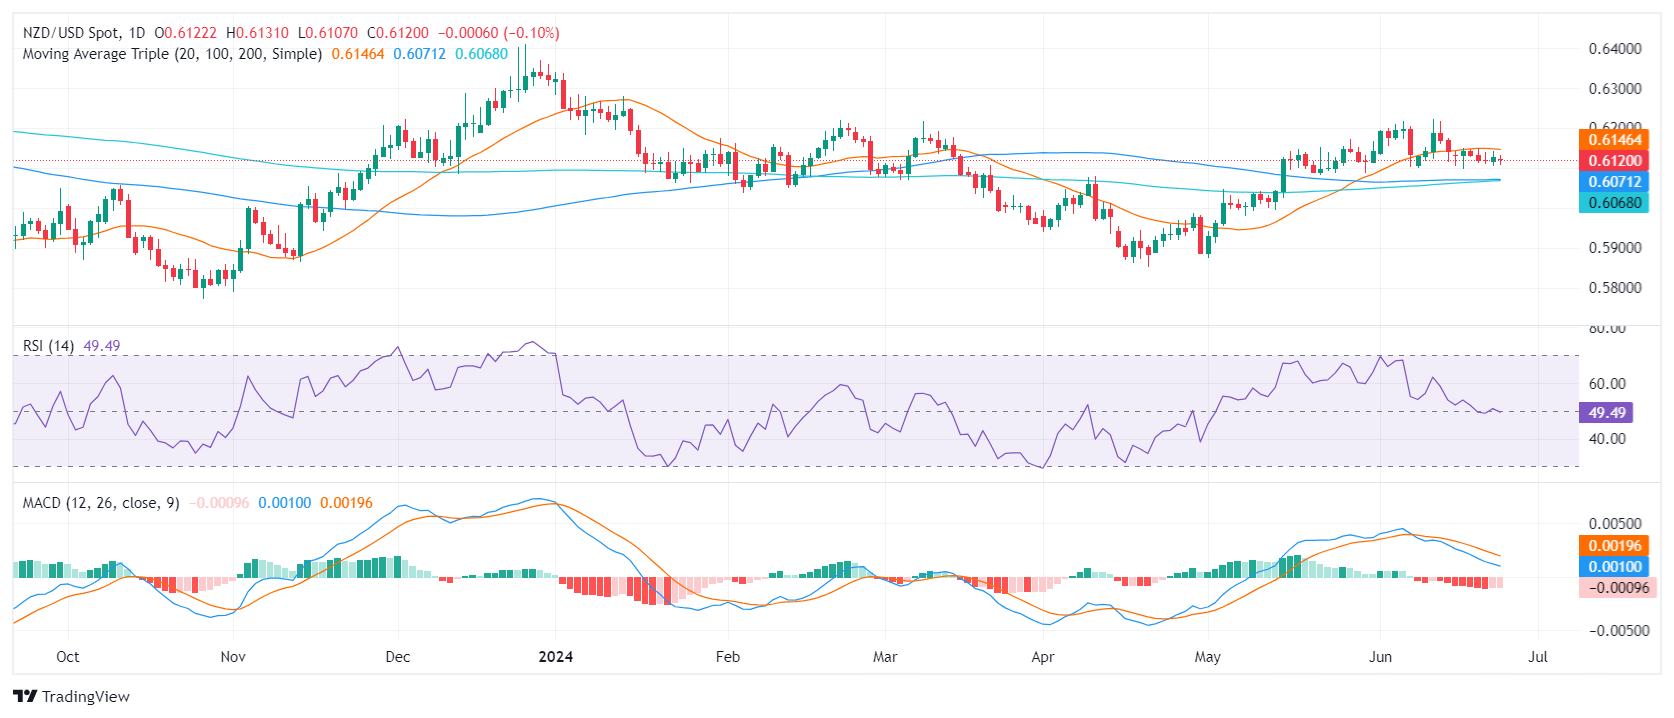
The NZD/USD finds immediate support near the 0.6100 level. Beneath that, additional support is available at the converging 100 and 200-day SMAs at 0.6070. If the pair continues its descent, these levels could provide a robust defense. A failure to hold these SMAs could signal a deepening of the sell-off scenario.
Conversely, resistance remains at the 20-day SMA at 0.6150, with additional resistance points at 0.6170 and 0.6200. A decisive breakout above these levels might indicate an end to the current bearish market sentiment and a shift in favor of the bulls.


© 2000-2026. All rights reserved.
This site is managed by Teletrade D.J. LLC 2351 LLC 2022 (Euro House, Richmond Hill Road, Kingstown, VC0100, St. Vincent and the Grenadines).
The information on this website is for informational purposes only and does not constitute any investment advice.
The company does not serve or provide services to customers who are residents of the US, Canada, Iran, The Democratic People's Republic of Korea, Yemen and FATF blacklisted countries.
Making transactions on financial markets with marginal financial instruments opens up wide possibilities and allows investors who are willing to take risks to earn high profits, carrying a potentially high risk of losses at the same time. Therefore you should responsibly approach the issue of choosing the appropriate investment strategy, taking the available resources into account, before starting trading.
Use of the information: full or partial use of materials from this website must always be referenced to TeleTrade as the source of information. Use of the materials on the Internet must be accompanied by a hyperlink to teletrade.org. Automatic import of materials and information from this website is prohibited.
Please contact our PR department if you have any questions or need assistance at pr@teletrade.global.
transfers