- Analytics
- News and Tools
- Market News
- GBP/USD Price Analysis: Stays firm below 1.2700, bearishly biased
GBP/USD Price Analysis: Stays firm below 1.2700, bearishly biased
- GBP/USD is steady as worse-than-expected US Consumer Confidence report, weighs on US Dollar.
- Technical outlook shows a 'bullish piercing' pattern, but momentum favors sellers, with RSI standing bearish.
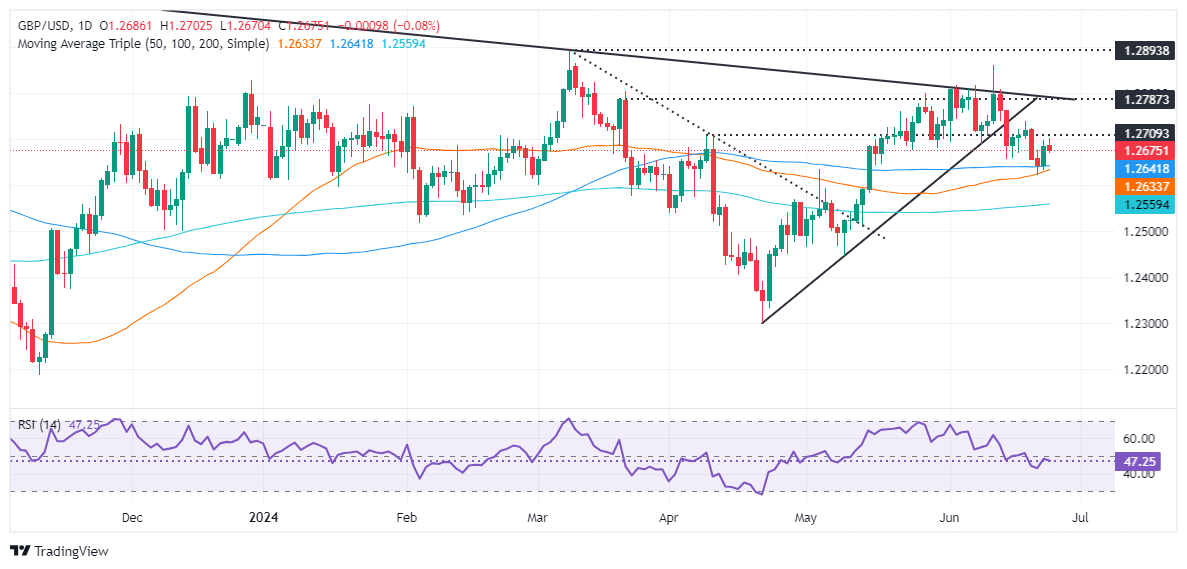
- Key support levels will be 100-DMA and the May 3 high at 1.2640/34, with further losses eyed beneath the psychological level of 1.2600.
- Key resistance levels are 1.2700 and previous support trendline turned resistance at 1.2730/40.
The Pound Sterling stayed firm against the Greenback on Tuesday, even though the latter remained positive, and a worse-than-expected Consumer Confidence report capped the US Dollar advance. Therefore, the GBP/USD trades at 1.2678, virtually unchanged.
GBP/USD Price Analysis: Technical outlook
The pair formed a ‘bullish piercing’ pattern, hinting that traders could challenge the next resistance seen at 1.2700, yet buyers remain reluctant to lift the GBP/USD towards that level.
Momentum still favors sellers, as depicted by the Relative Strength Index (RSI), which remains bearish and aims lower. That said, the GBP/USD path of least resistance is downwards.
The first support will be the confluence of the 100-day moving average (DMA) and the May 3 high-turned support at around 1.2640/34, closely followed by the 50-DMA at 1.2632. Once that area is surpassed, the psychological 1.2600 mark would be up next, ahead of the 200-DMA at 1.2555.
For a bullish continuation, traders must claim 1.2700 and clear a previous support trendline turned resistance at around 1.2730/40.
GBP/USD Price Action – Daily Chart


© 2000-2026. All rights reserved.
This site is managed by Teletrade D.J. LLC 2351 LLC 2022 (Euro House, Richmond Hill Road, Kingstown, VC0100, St. Vincent and the Grenadines).
The information on this website is for informational purposes only and does not constitute any investment advice.
The company does not serve or provide services to customers who are residents of the US, Canada, Iran, The Democratic People's Republic of Korea, Yemen and FATF blacklisted countries.
Making transactions on financial markets with marginal financial instruments opens up wide possibilities and allows investors who are willing to take risks to earn high profits, carrying a potentially high risk of losses at the same time. Therefore you should responsibly approach the issue of choosing the appropriate investment strategy, taking the available resources into account, before starting trading.
Use of the information: full or partial use of materials from this website must always be referenced to TeleTrade as the source of information. Use of the materials on the Internet must be accompanied by a hyperlink to teletrade.org. Automatic import of materials and information from this website is prohibited.
Please contact our PR department if you have any questions or need assistance at pr@teletrade.global.
transfers