- Analytics
- News and Tools
- Market News
- EUR/JPY Price Analysis: Extends gains eye YTD high above 171.00
EUR/JPY Price Analysis: Extends gains eye YTD high above 171.00
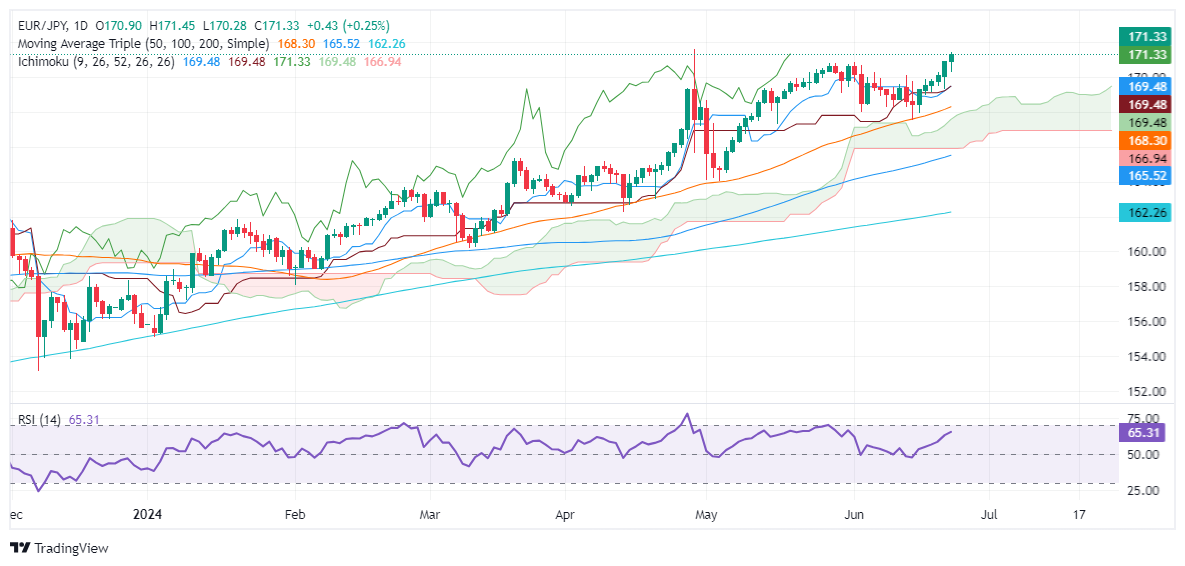
- EUR/JPY extends its gains for the sixth consecutive day and nearing the YTD high of 171.58.
- Technical outlook shows bullish momentum, with RSI indicating potential for further gains.
- Key resistance levels are YTD high at 171.58, 172.00, 172.50, and 173.00.
- Key support levels would be 171.00, the confluence of Tenkan, Kijun-Sen, and Senkou Span A at 169.48, and 50-DMA.
The EUR/JPY extended its gains for the sixth straight day on Monday and is up 0.24%. Yet it remains shy of testing the year-to-date (YTD) high reached on April 29 at 171.58. At the time of writing, the cross is trading at 171.29, above the 171.00 key technical level.
EUR/JPY Price Analysis: Technical outlook
The pair is set to extend its gains. Still, intervention fears that the Bank of Japan or the Minister of Finance might step into the FX markets loom, keeping investors on their toes.
Momentum suggests that the cross could extend its gains, as the Relative Strength Index (RSI) is bullish.
Therefore, the EUR/JPY first resistance would be the YTD high at 171.58. A breach of the latter will expose the 172.00 figure, followed by the 172.50 mark. Once those two levels are cleated, up next will be the 173.00 psychological level.
On further weakness, the EUR/JPY might be headed for a pullback, and test 171.00. Once cleared, the next support would be the confluence of the Tenkan, Kijun-Sen and Senkou Span A at 169.48. Once surpassed, the next stop would be the 50-day moving average (DMA) at 168.40.
EUR/JPY Price Action – Daily Chart


© 2000-2026. All rights reserved.
This site is managed by Teletrade D.J. LLC 2351 LLC 2022 (Euro House, Richmond Hill Road, Kingstown, VC0100, St. Vincent and the Grenadines).
The information on this website is for informational purposes only and does not constitute any investment advice.
The company does not serve or provide services to customers who are residents of the US, Canada, Iran, The Democratic People's Republic of Korea, Yemen and FATF blacklisted countries.
Making transactions on financial markets with marginal financial instruments opens up wide possibilities and allows investors who are willing to take risks to earn high profits, carrying a potentially high risk of losses at the same time. Therefore you should responsibly approach the issue of choosing the appropriate investment strategy, taking the available resources into account, before starting trading.
Use of the information: full or partial use of materials from this website must always be referenced to TeleTrade as the source of information. Use of the materials on the Internet must be accompanied by a hyperlink to teletrade.org. Automatic import of materials and information from this website is prohibited.
Please contact our PR department if you have any questions or need assistance at pr@teletrade.global.
transfers