- Analytics
- News and Tools
- Market News
- GBP/JPY Price Analysis: Bulls persist and propelled pair to fresh cycle, overbought signals arise
GBP/JPY Price Analysis: Bulls persist and propelled pair to fresh cycle, overbought signals arise
- GBP/JPY extends its rally, hitting fresh cycle highs of around 202.50 on Monday.
- Daily RSI and MACD stand near overbought territory.
- Trend remains bullish but overbought conditions suggest potential corrections.
During Monday's session, the GBP/JPY pair sustained its uptrend, hitting new cycle highs around 202.50, reaching its highest point since 2007. Despite sellers making strides earlier in the session, bringing the pair down to a low of 106.14, buyers managed to counteract and propel the pair back to fresh cycle highs.
The Daily Relative Strength Index (RSI) currently sits at 68, settling slightly below the overbought territory. The upsurge recorded in last Friday’s readings hints at remaining bullish momentum, though the swift approach to overbought conditions may suggest a potential incoming correction. The Daily Moving Average Convergence Divergence (MACD) continues to display rising green bars, implying that the bullish momentum is still in the play, albeit approaching a crest.
GBP/JPY daily chart
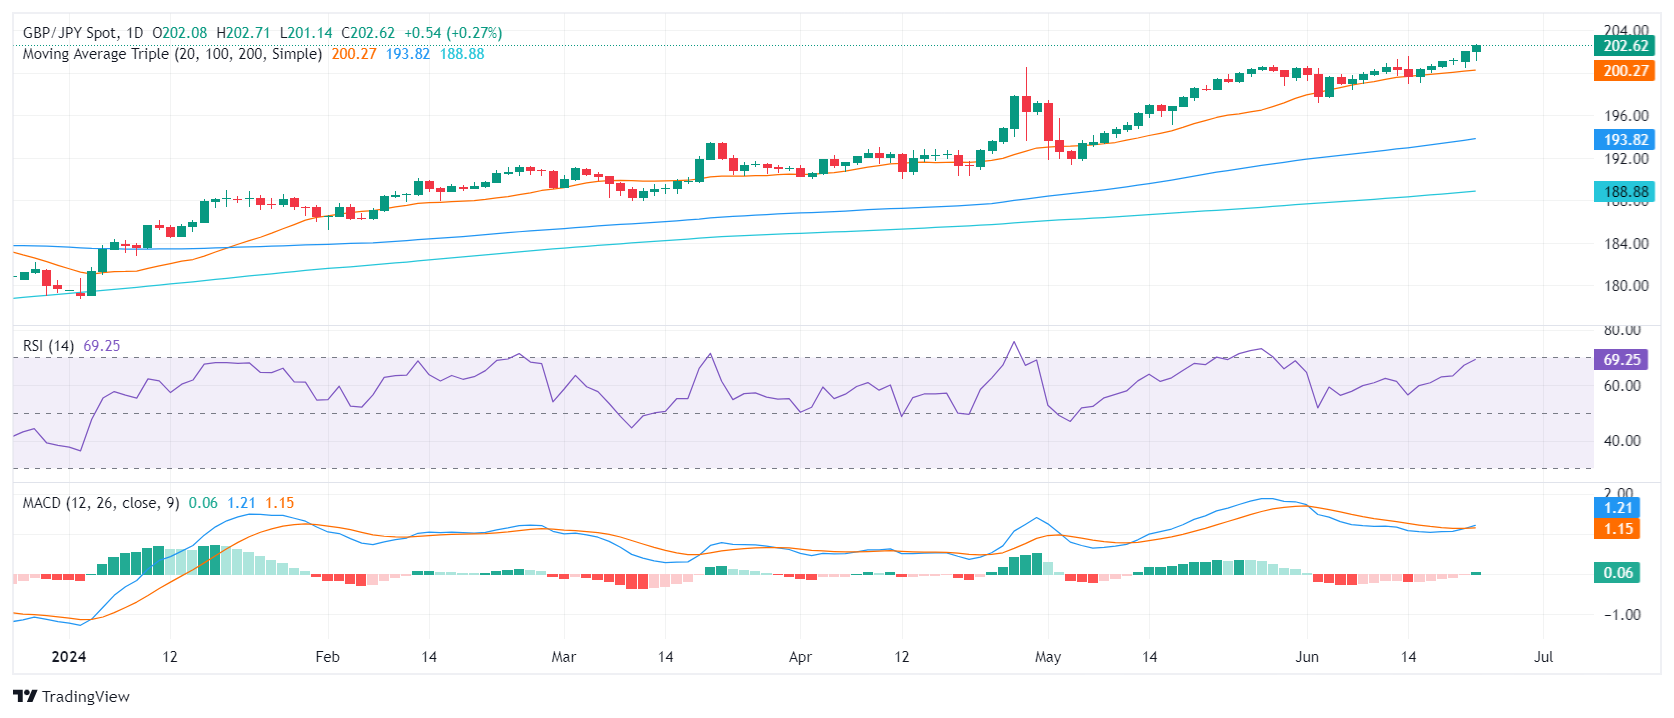
In summary, the GBP/JPY pair's solid performance on Monday underpins a broader bullish trend. The trend's positive outlook is validated by the pair's position above the 20-day, 100-day, and 200-day Simple Moving Averages (SMAs). However, as current indicators suggest over-extended movements, traders might brace for a likely correction event.
If the pair falls below the immediate support level set at 202.00, followed by the 201.00 and 202.20 levels (20-day SMA), it would likely seek new support thresholds at around the 200.00 psychological area. Conversely, resistance is seen near the psychological mark of 203.00 and further at 203.50, in case the bulls persist.


© 2000-2026. All rights reserved.
This site is managed by Teletrade D.J. LLC 2351 LLC 2022 (Euro House, Richmond Hill Road, Kingstown, VC0100, St. Vincent and the Grenadines).
The information on this website is for informational purposes only and does not constitute any investment advice.
The company does not serve or provide services to customers who are residents of the US, Canada, Iran, The Democratic People's Republic of Korea, Yemen and FATF blacklisted countries.
Making transactions on financial markets with marginal financial instruments opens up wide possibilities and allows investors who are willing to take risks to earn high profits, carrying a potentially high risk of losses at the same time. Therefore you should responsibly approach the issue of choosing the appropriate investment strategy, taking the available resources into account, before starting trading.
Use of the information: full or partial use of materials from this website must always be referenced to TeleTrade as the source of information. Use of the materials on the Internet must be accompanied by a hyperlink to teletrade.org. Automatic import of materials and information from this website is prohibited.
Please contact our PR department if you have any questions or need assistance at pr@teletrade.global.
transfers