- Analytics
- News and Tools
- Market News
- EUR/USD Price Analysis: Trims losses near 1.0700, the bearish outlook remains intact
EUR/USD Price Analysis: Trims losses near 1.0700, the bearish outlook remains intact
- EUR/USD trades on a stronger around 1.0700 in Monday’s early European session.
- The pair keeps the negative vibe below the key 100-period EMA, with the bearish RSI indicator.
- The key upside barrier will emerge near 1.0762; 1.0670 acts as an initial support level for the pair.
The EUR/USD pair trims losses near 1.0700 during the early European session on Monday. The upside of the major pair might be limited as investors are concerned about the political uncertainties in the Eurozone, particularly the outcome of a snap election in France. Furthermore, the firmer US Dollar (USD) after the stronger-than-expected US PMIs released on Friday might lift the Greenback and create a headwind for the pair.
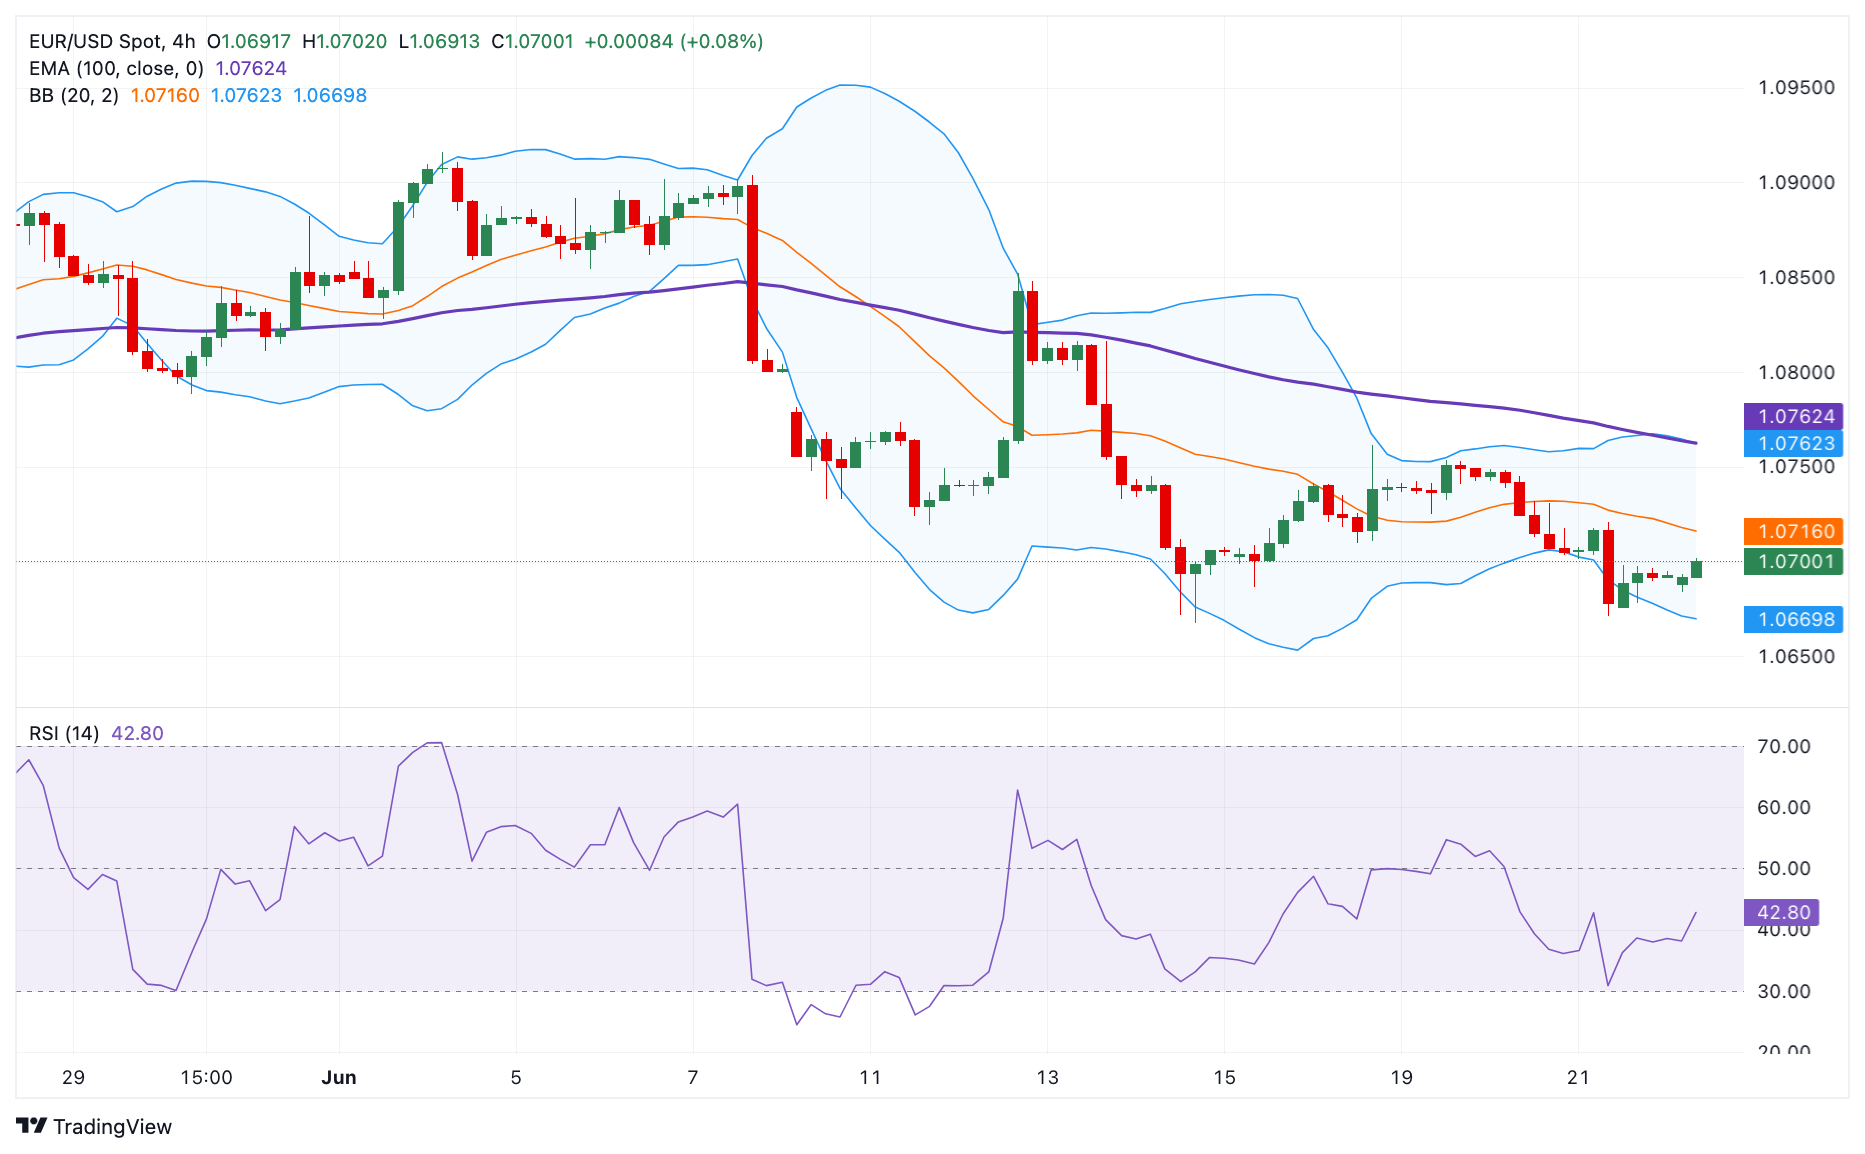
Technically, the bearish outlook of EUR/USD remains intact as the major pair holds below the key 100-period Exponential Moving Average (EMA) on the 4-hour chart. The downward momentum is backed by the Relative Strength Index (RSI), which stands in the bearish zone near 40.0, indicating that further downside looks favorable.
The key upside barrier for EUR/USD will emerge near 1.0762, portraying the confluence of the 100-period EMA and the upper boundary of the Bollinger Band. Further north, the next hurdle is seen at 1.0815, a high of June 15. Any follow-through buying will see a rally to 1.0852, a high of June 12.
On the flip side, the lower limit of the Bollinger Band at 1.0670 acts as an initial support level for the major pair. A breach of this level will pave the way to 1.0650, a low of May 1. The additional downside filter to watch is the 1.0600 psychological level.
EUR/USD 4-hour chart


© 2000-2026. All rights reserved.
This site is managed by Teletrade D.J. LLC 2351 LLC 2022 (Euro House, Richmond Hill Road, Kingstown, VC0100, St. Vincent and the Grenadines).
The information on this website is for informational purposes only and does not constitute any investment advice.
The company does not serve or provide services to customers who are residents of the US, Canada, Iran, The Democratic People's Republic of Korea, Yemen and FATF blacklisted countries.
Making transactions on financial markets with marginal financial instruments opens up wide possibilities and allows investors who are willing to take risks to earn high profits, carrying a potentially high risk of losses at the same time. Therefore you should responsibly approach the issue of choosing the appropriate investment strategy, taking the available resources into account, before starting trading.
Use of the information: full or partial use of materials from this website must always be referenced to TeleTrade as the source of information. Use of the materials on the Internet must be accompanied by a hyperlink to teletrade.org. Automatic import of materials and information from this website is prohibited.
Please contact our PR department if you have any questions or need assistance at pr@teletrade.global.
transfers