- Analytics
- News and Tools
- Market News
- AUD/JPY Price Analysis: Strong bullish momentum pushes pair to fresh cycle highs
AUD/JPY Price Analysis: Strong bullish momentum pushes pair to fresh cycle highs
- AUD/JPY continues its rally, reaching fresh cycle highs around 105.70 on Thursday.
- Daily RSI and MACD stand deep in positive terrain.
- Indicators point towards more room for additional gains.
During Thursday's session, the AUD/JPY pair maintained its uptrend, achieving new cycle highs around 105.70, its the highest point reached since 2013. There has been a clear consolidation around the 104.00 level in the last sessions, and as the sellers failed to make a significant move, buyers stepped in.
On a daily scale, the Relative Strength Index (RSI) of the AUDJPY has risen to 68, up from 63 recorded on Wednesday. This increase suggests bullish momentum continues to gain strength. The Moving Average Convergence Divergence (MACD) marker persists in showing rising green bars, indicating the bullish momentum is far from plateauing.
AUD/JPY daily chart
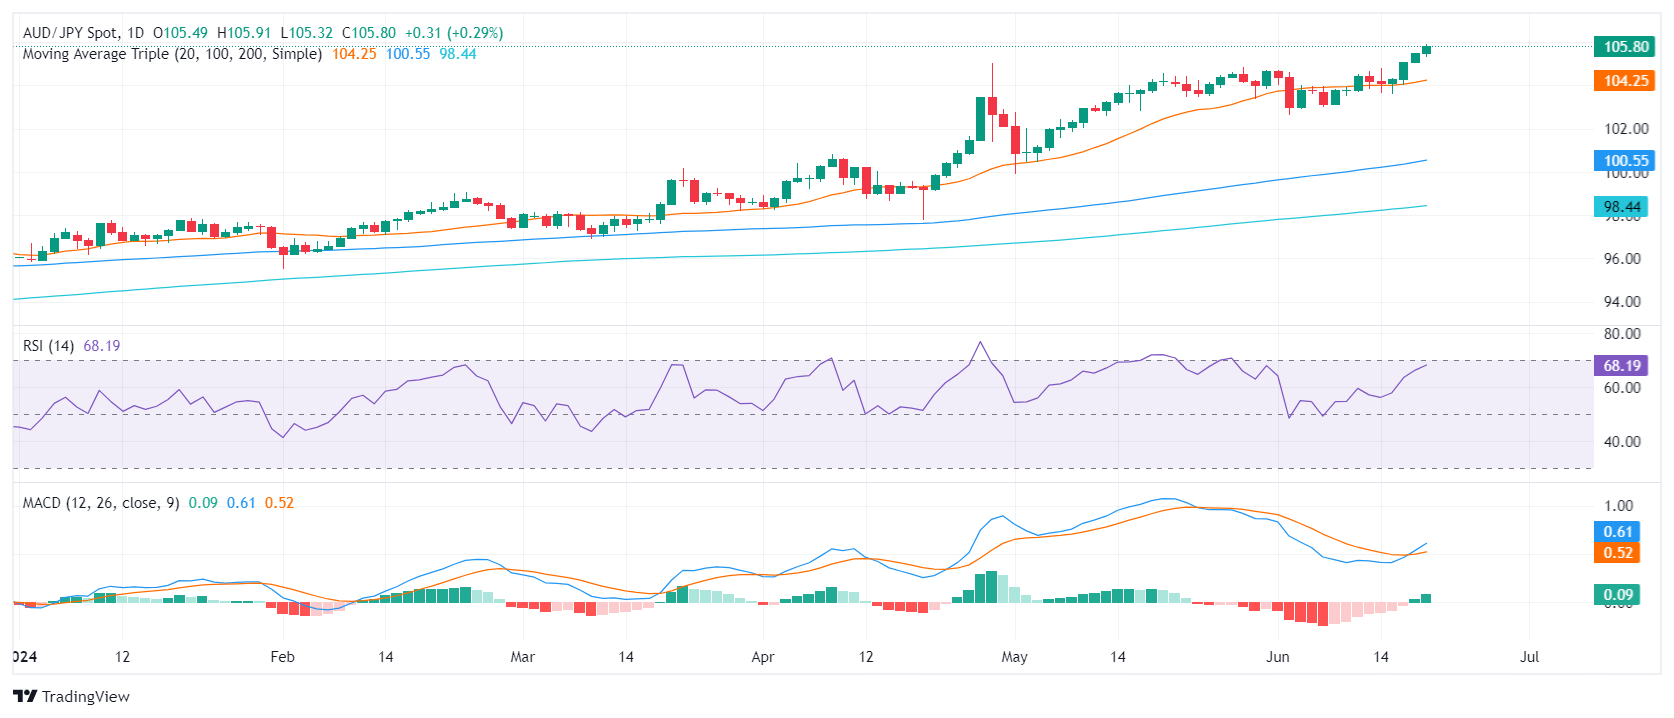 In summary, the AUD/JPY pair's robust showing on Thursday endorses a broader bullish outlook, with the intensity of the trend validated by the pair's position above the 20-day, 100-day, and 200-day Simple Moving Averages (SMAs). Looking forward, traders can expect the pair to sustain its uptrend, potentially reaching into the 105.80-106.00 range, as current indicators do not suggest over-extended movements and hence provide space for subsequent gains.
On the off chance that the pair falls below the support level set at 105.00, followed by the 104.15 level (20-day SMA), it would likely seek new support thresholds. As such, the 102.50 and 100.35 levels may serve as potential support lines.


© 2000-2026. All rights reserved.
This site is managed by Teletrade D.J. LLC 2351 LLC 2022 (Euro House, Richmond Hill Road, Kingstown, VC0100, St. Vincent and the Grenadines).
The information on this website is for informational purposes only and does not constitute any investment advice.
The company does not serve or provide services to customers who are residents of the US, Canada, Iran, The Democratic People's Republic of Korea, Yemen and FATF blacklisted countries.
Making transactions on financial markets with marginal financial instruments opens up wide possibilities and allows investors who are willing to take risks to earn high profits, carrying a potentially high risk of losses at the same time. Therefore you should responsibly approach the issue of choosing the appropriate investment strategy, taking the available resources into account, before starting trading.
Use of the information: full or partial use of materials from this website must always be referenced to TeleTrade as the source of information. Use of the materials on the Internet must be accompanied by a hyperlink to teletrade.org. Automatic import of materials and information from this website is prohibited.
Please contact our PR department if you have any questions or need assistance at pr@teletrade.global.
transfers