- Analytics
- News and Tools
- Market News
- Silver Price Analysis: XAG/USD climbs more than 0.50%, eyes $30.00
Silver Price Analysis: XAG/USD climbs more than 0.50%, eyes $30.00
- Silver trades and gains 0.60% after touching a daily low of $29.35.
- Momentum is neutral, with RSI around the 50-neutral line, suggesting buyers and sellers are balanced.
- Key resistance at $30.25 and $31.54, with support levels at $29.05 and $28.66.
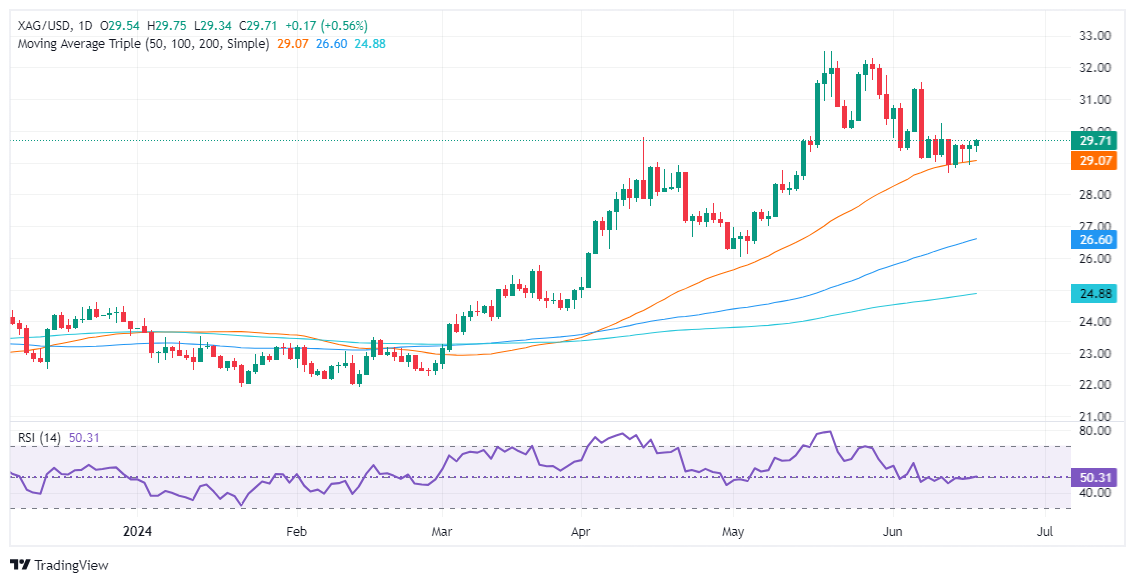
Silver climbed during the North American session, gaining more than 0.60% amid thin trading liquidity conditions. Wall Street remained closed in observance of the Juneteenth holiday. The XAG/USD trades at $29.71 after hitting a daily low of $29.35.
XAG/USD Price Analysis: Technical analysis
The grey metal remains neutral to upward bias, despite diving from year-to-date (YTD) highs reached at $32.51, below the $30.00 figure. Silver seems to have bottomed after hitting a monthly low of $28.66; since then, XAG/USD edged higher, and it’s shy of challenging the $30.00 mark.
Momentum shows that neither buyers nor sellers are in charge, as the Relative Strength Index (RSI) hovers around the 50-neutral line.
The most likely scenario would be a bullish continuation if XAG/USD buyers reclaim $30.00, which could reignite Silver’s rally and pave the way for further upside. The next resistance level would be the June 12 high at $30.25, followed by the month-to-date (MTD) high of $31.54, the June 7 peak. A breach of the latter will expose the YTD high of $32.51.
On the other hand, if XAG/USD sellers drag spot prices below the 50-day moving average (DMA) at $29.05, it will expose $29.00. Once cleared, that could expose the MTD low of $28.66, ahead of plunging toward the 100-DMA at $26.60.
XAG/USD Price Action – Daily Chart


© 2000-2026. All rights reserved.
This site is managed by Teletrade D.J. LLC 2351 LLC 2022 (Euro House, Richmond Hill Road, Kingstown, VC0100, St. Vincent and the Grenadines).
The information on this website is for informational purposes only and does not constitute any investment advice.
The company does not serve or provide services to customers who are residents of the US, Canada, Iran, The Democratic People's Republic of Korea, Yemen and FATF blacklisted countries.
Making transactions on financial markets with marginal financial instruments opens up wide possibilities and allows investors who are willing to take risks to earn high profits, carrying a potentially high risk of losses at the same time. Therefore you should responsibly approach the issue of choosing the appropriate investment strategy, taking the available resources into account, before starting trading.
Use of the information: full or partial use of materials from this website must always be referenced to TeleTrade as the source of information. Use of the materials on the Internet must be accompanied by a hyperlink to teletrade.org. Automatic import of materials and information from this website is prohibited.
Please contact our PR department if you have any questions or need assistance at pr@teletrade.global.
transfers