- Analytics
- News and Tools
- Market News
- NZD/USD Price Analysis: Bears lose some claws as the pair manages to recoup losses
NZD/USD Price Analysis: Bears lose some claws as the pair manages to recoup losses
- Despite declining below the 20-day SMA, the NZD/USD recovers some losses to stabilize at 0.6140.
- Short-term outlook remains bearish, but seller momentum isn’t that strong..
- Bulls must recover the 20-day SMA at 0.61450.
On Tuesday, the NZD/USD extended its decline, initially dropping to 0.6095, but managed to pare the majority of its losses by the end of the trading day. Buyers staged a comeback, pushing the pair back towards 0.6140. However, the short-term outlook still leans towards the downside, but the day's recovery is a positive sign for the pair.
According to the daily chart, the Relative Strength Index (RSI) at 53 suggests a neutral situation. This implies that the market is neither overbought nor oversold, providing some room for upward movement if the buying pressures can keep the momentum. However, the Moving Average Convergence Divergence (MACD) continues to print red bars, which confirms the presence of the sellers.
NZD/USD daily chart
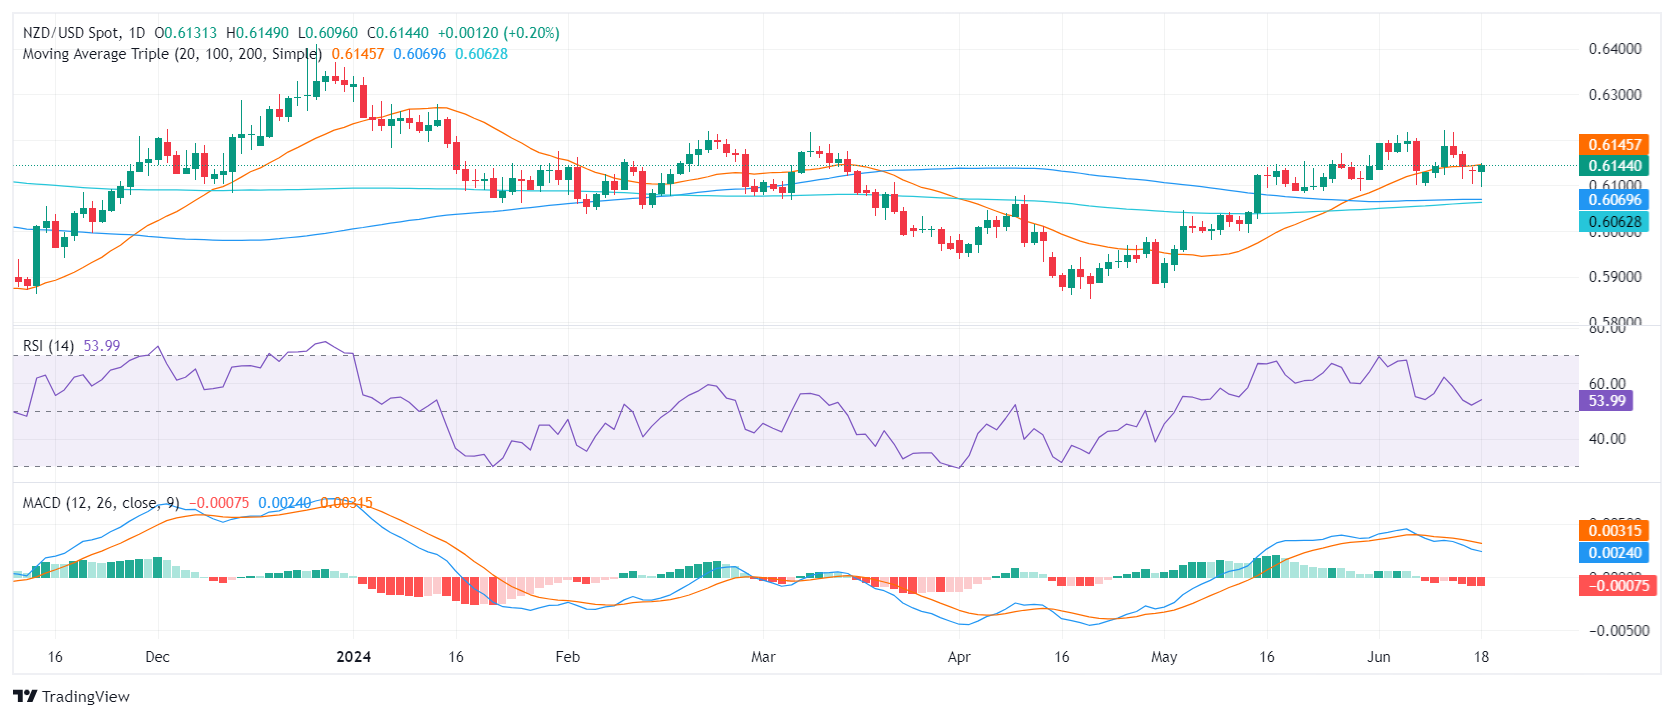
For the NZD/USD, the immediate support resides at 0.6100. Deeper support is available at the convergence of the 100-day and 200-day SMAs at 0.6069 and 0.6062 respectively, which can provide a solid footing for the pair in case of an extended downside move. A break below these SMA convergence points could point towards a huge sell signal.
In contrast, the pair's main resistance remains around the 20-day SMA at 0.6145 and above at the recent high at the 0.6220 level. A breakout above this consolidation range could be interpreted as a buy signal, suggesting the current bearish sentiment could be coming to an end.


© 2000-2026. All rights reserved.
This site is managed by Teletrade D.J. LLC 2351 LLC 2022 (Euro House, Richmond Hill Road, Kingstown, VC0100, St. Vincent and the Grenadines).
The information on this website is for informational purposes only and does not constitute any investment advice.
The company does not serve or provide services to customers who are residents of the US, Canada, Iran, The Democratic People's Republic of Korea, Yemen and FATF blacklisted countries.
Making transactions on financial markets with marginal financial instruments opens up wide possibilities and allows investors who are willing to take risks to earn high profits, carrying a potentially high risk of losses at the same time. Therefore you should responsibly approach the issue of choosing the appropriate investment strategy, taking the available resources into account, before starting trading.
Use of the information: full or partial use of materials from this website must always be referenced to TeleTrade as the source of information. Use of the materials on the Internet must be accompanied by a hyperlink to teletrade.org. Automatic import of materials and information from this website is prohibited.
Please contact our PR department if you have any questions or need assistance at pr@teletrade.global.
transfers